Oilfield Services Market Analysis North America, Middle East and Africa, APAC, Europe, South America - US, Canada, Russia, Saudi Arabia, China, UAE, Japan, Qatar, Mexico, India - Size and Forecast 2025-2029

Oilfield Services Market Analysis North America, Middle East and Africa, APAC, Europe, South America - US, Canada, Russia, Saudi Arabia, China, UAE, Japan, Qatar, Mexico, India - Size and Forecast 2025-2029

Published: Mar 2025 207 Pages SKU: IRTNTR74370

Market Overview at a Glance

$42.5 B
Market Opportunity
4.6%
CAGR
4.4
YoY growth 2024-2025(%)

Oilfield Services Market Size 2025-2029

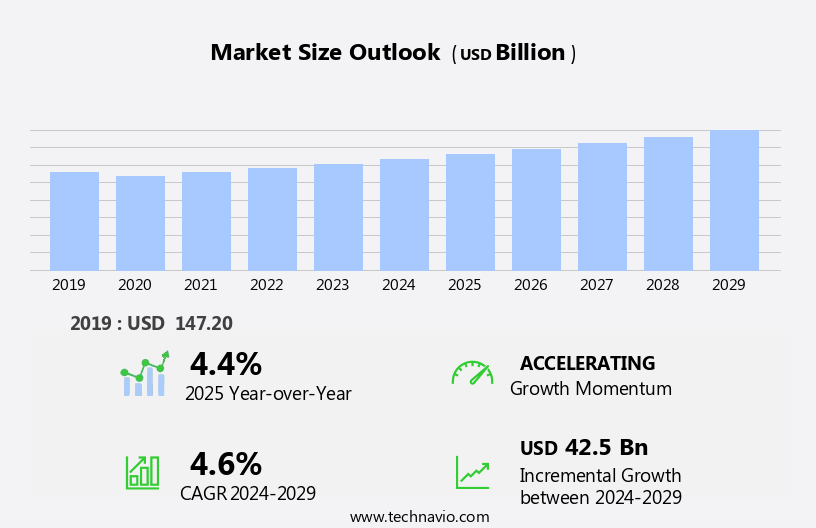
The oilfield services market size is forecast to increase by USD 42.5 billion, at a CAGR of 4.6% between 2024 and 2029.

  • The market is experiencing significant growth, driven by the increasing demand for oil and natural gas worldwide. This expanding need is fueled by ongoing energy consumption and the continuous development of new energy infrastructure projects. Technological innovations are playing a pivotal role in enhancing productivity and efficiency in the oilfield services sector, enabling companies to optimize their operations and reduce costs. However, the market is not without challenges. Fluctuations in crude oil prices pose a significant risk, as they can impact both the demand for oilfield services and the profitability of service providers.
  • Effective risk management strategies and the ability to adapt to price volatility will be crucial for companies seeking to capitalize on market opportunities and navigate these challenges successfully.

What will be the Size of the Oilfield Services Market during the forecast period?

Oilfield Services Market Size

Explore in-depth regional segment analysis with market size data - historical 2019-2023 and forecasts 2025-2029 - in the full report.  
Request Free Sample

The market continues to evolve, with dynamic market dynamics shaping its various sectors. Production optimization remains a key focus, with artificial lift systems and workover services ensuring maximum output from existing wells. Offshore services are in high demand, as oil and gas companies explore new frontiers in deep waters. Environmental compliance is another critical area, with stringent regulations driving the need for corrosion control, hydraulic fracturing with enhanced environmental practices, and waste disposal solutions. Reservoir characterization and steam injection are essential for reservoir management, providing valuable insights into oil and gas reserves. Downhole tools and drilling automation are transforming drilling operations, enhancing drilling efficiency and reducing costs.

Production forecasting and well testing are integral parts of the production enhancement process, ensuring optimal performance from wells. Pipeline installation and maintenance, along with pressure pumping and wellbore pressure management, are crucial for ensuring the safe and efficient transportation of oil and gas. Remote monitoring and data analytics are revolutionizing the industry, providing real-time insights into well performance and enabling proactive intervention. Safety regulations and well integrity remain top priorities, with cementing services, well logging, and directional drilling ensuring the safe and effective completion of wells. Sand control and flow assurance are essential for maintaining production levels and maximizing revenue.

The ongoing unfolding of market activities continues to shape the oilfield services landscape, with new technologies and applications emerging to meet the evolving needs of the industry.

How is this Oilfield Services Industry segmented?

The oilfield services industry research report provides comprehensive data (region-wise segment analysis), with forecasts and estimates in "USD billion" for the period 2025-2029, as well as historical data from 2019-2023 for the following segments.

  • Application
    • Onshore
    • Offshore
  • Type
    • Field operations
    • Analytical and consulting services
    • Equipment rental
  • Geography
    • North America
      • US
      • Canada
      • Mexico
    • Europe
      • Russia
    • Middle East and Africa
      • Qatar
      • UAE
    • APAC
      • China
      • India
      • Japan
    • Rest of World (ROW)

    By Application Insights

    The onshore segment is estimated to witness significant growth during the forecast period.

    The market encompasses a range of technologies and services essential to the exploration and production of oil and gas. Key entities include chemical flooding, production monitoring, pipeline installation, production enhancement, horizontal drilling, completion services, subsea production, coiled tubing, wellbore stability, data acquisition systems, well intervention, data analytics, sand control, cementing services, production optimization, artificial lift, offshore services, environmental compliance, workover services, reservoir characterization, steam injection, corrosion control, hydraulic fracturing, enhanced oil recovery, wireline services, fracture modeling, flow assurance, remote monitoring, reservoir management, mud logging, reservoir simulation, water management, drilling optimization, pressure pumping, wellbore pressure, drilling fluids, drilling efficiency, carbon capture, reservoir simulation software, well stimulation, safety regulations, well integrity, well logging, and seismic data acquisition.

    In 2024, the onshore segment held a significant market share due to the high volume of onshore drilling and production activities and the lower capital requirements compared to offshore projects. The onshore market is populated by various large to small-scale oilfield service providers. The growth of the onshore segment is fueled by the increasing upstream activities, such as new drilling and the adoption of enhanced oil recovery technologies, driven by the global energy demand surge. Oil and gas E&P companies in North America and the Middle East are actively pursuing new greenfield projects as mature fields reach the end of their production life cycle.

    Oilfield Services Market Size

    Request Free Sample

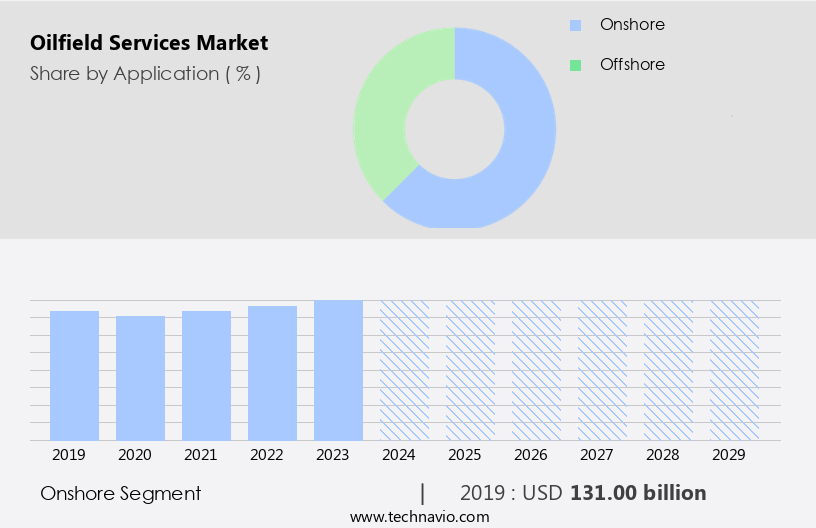
    The Onshore segment was valued at USD 131.00 billion in 2019 and showed a gradual increase during the forecast period.

    Regional Analysis

    North America is estimated to contribute 44% to the growth of the global market during the forecast period.Technavio’s analysts have elaborately explained the regional trends and drivers that shape the market during the forecast period.

    Oilfield Services Market Share by Geography

     Request Free Sample

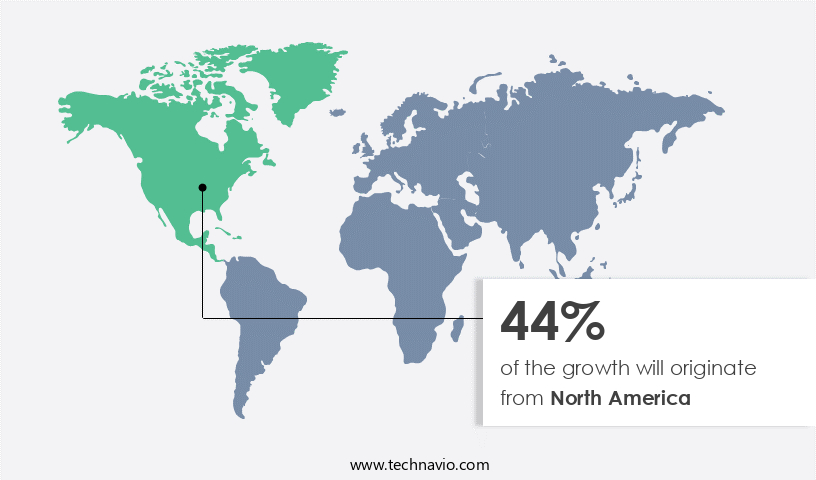
    In the US the market of North America, the country held a significant share in 2024. The recovery of crude oil prices and the surge in shale oil production in the US served as the primary growth drivers for the market in North America during this period. Technological advancements, particularly in automation and IoT, are influencing oil rig operators to implement automated drilling solutions for onshore and offshore oil and gas projects. Semi-automated technologies are increasingly being adopted by companies in the industry to access remote offshore oil wells, which present logistical challenges due to harsh weather conditions.

    Production monitoring, pipeline installation, and production enhancement are some of the key services in demand. Horizontal drilling, completion services, subsea production, coiled tubing, and well intervention are other significant areas of investment. Data acquisition systems, data analytics, sand control, cementing services, production optimization, artificial lift, and offshore services are essential components of the market. Environmental compliance, workover services, reservoir characterization, steam injection, corrosion control, hydraulic fracturing, enhanced oil recovery, and waste disposal are other evolving trends. Wireline services, fracture modeling, flow assurance, remote monitoring, reservoir management, mud logging, reservoir simulation, production decline, water management, drilling optimization, pressure pumping, wellbore pressure, drilling fluids, drilling efficiency, carbon capture, reservoir simulation software, well stimulation, safety regulations, well integrity, well logging, and seismic data acquisition are integral to the market's dynamics.

    Directional drilling and drilling automation are also gaining traction.

    Market Dynamics

    Our researchers analyzed the data with 2024 as the base year, along with the key drivers, trends, and challenges. A holistic analysis of drivers will help companies refine their marketing strategies to gain a competitive advantage.

    What are the key market drivers leading to the rise in the adoption of Oilfield Services Industry?

    • The global market is primarily driven by the increasing demand for oil and natural gas, which is a significant trend in the energy sector. 

    • The global oil and gas industry is experiencing significant growth due to increasing energy demand, leading to the exploration and production of new reservoirs. According to the US Energy Information Administration, global liquid fuel consumption averaged 102.8 million barrels per day in 2024, with over 70% of this growth expected to be met by oil, natural gas, and coal. With existing reservoirs maturing or depleting, there is a necessity to drill new wells. To optimize oil and gas production, various techniques and services are employed. Production enhancement methods such as chemical flooding, horizontal drilling, and completion services are commonly used to maximize reservoir output.
    • Additionally, production monitoring through data acquisition systems and data analytics plays a crucial role in maintaining and improving production efficiency. Pipeline installation and subsea production systems are essential for transporting and processing oil and gas. Coiled tubing, well intervention, sand control, and cementing services are integral to maintaining wellbore stability and ensuring efficient drilling and completion operations. Well intervention and data analytics are also crucial for identifying and addressing production issues in real-time, ensuring optimal well performance. In conclusion, the market is experiencing significant growth due to the increasing demand for oil and gas.
    • Technologies and services such as production enhancement, pipeline installation, and well intervention are essential for optimizing production and maintaining well performance. The market is expected to continue growing as the world's energy needs evolve.

    What are the market trends shaping the Oilfield Services Industry?

    • The market is experiencing a significant trend towards the adoption of technological innovations to enhance productivity. These advancements are essential for driving efficiency and competitiveness in the industry.

    • The market is experiencing a significant focus on production optimization and cost reduction as pricing pressures mount from operators and E&P companies. To enhance productivity and profitability, service providers are embracing automation, advanced tools, and data-driven approaches. For example, some companies are investing in automated drilling systems, such as Nabors Industries' iRig, which automates drill pipe handling, thereby reducing labor costs and operational expenses. Additionally, there is a growing emphasis on environmental compliance, with service providers integrating technologies for steam injection, corrosion control, hydraulic fracturing, and enhanced oil recovery.
    • Furthermore, wireline services, multilateral wells, and waste disposal are other areas of investment for oilfield service providers to improve operational efficiency and reduce costs. Overall, the oilfield services industry is undergoing a transformation, with a focus on innovation, efficiency, and cost savings.

    What challenges does the Oilfield Services Industry face during its growth?

    • The volatility of crude oil prices poses a significant challenge to the growth of the industry. 

    • The market experiences significant fluctuations due to crude oil price volatility. Geopolitical tensions, OPEC production decisions, supply-demand imbalances, economic downturns, and energy transition policies are among the factors influencing oil prices and, consequently, the demand for oilfield services. When crude oil prices decline, E and P companies cut capital expenditures, leading to decreased demand for services like drilling, completion, and well intervention. This results in lower revenues and profit margins for oilfield service providers. On the other hand, rising crude oil prices trigger increased upstream investments, leading to heightened demand for oilfield services. However, sharp price surges can also bring about higher operational costs, supply chain constraints, and labor shortages, adding complexity to market dynamics.
    • Well testing, production forecasting, drilling rigs, downhole tools, fracture modeling, flow assurance, remote monitoring, reservoir management, mud logging, reservoir simulation, production decline, water management, drilling optimization, and pressure pumping are essential services offered by oilfield service providers. These services contribute to enhancing efficiency, optimizing production, and ensuring safety and environmental compliance in oil and gas operations. Despite the challenges, the market continues to evolve, with advancements in technology and innovation playing a crucial role in improving operational efficiency and reducing costs. Companies are focusing on digitalization, automation, and remote monitoring to streamline processes and enhance productivity.
    • Additionally, the integration of artificial intelligence, machine learning, and data analytics is transforming the industry by providing valuable insights into reservoir performance, drilling optimization, and production forecasting. In conclusion, the market is subject to the volatility of crude oil prices, which impact investment cycles, operational budgets, and overall market stability. However, advancements in technology and innovation are helping companies navigate these challenges and improve operational efficiency, ensuring their long-term competitiveness in the industry.

    Exclusive Customer Landscape

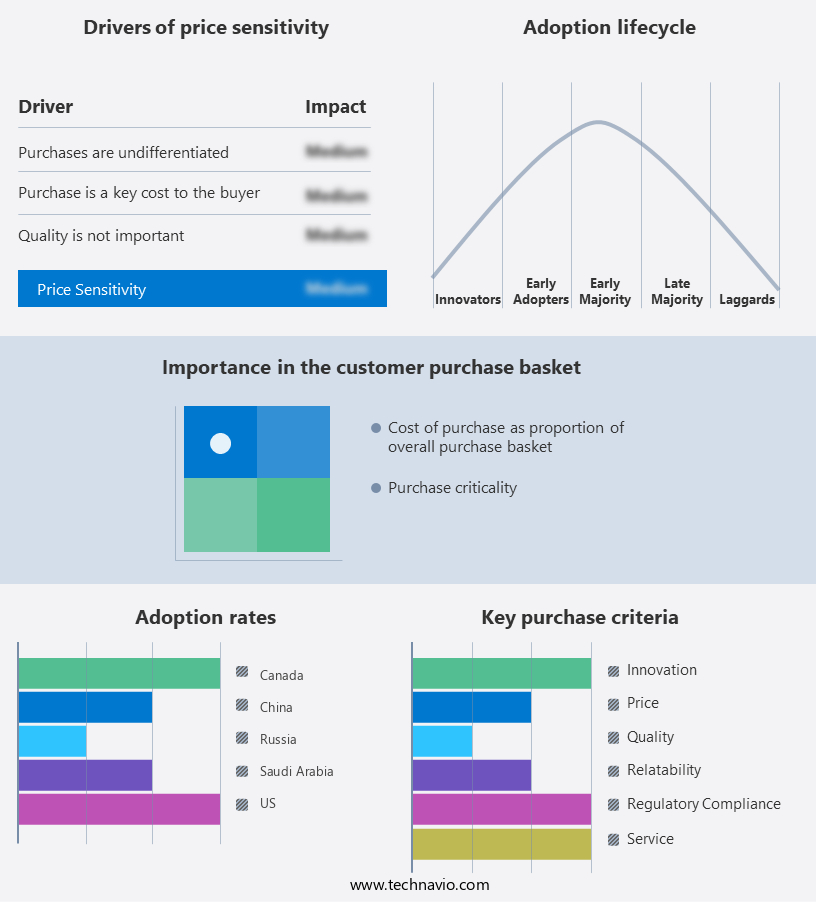
    The oilfield services market forecasting report includes the adoption lifecycle of the market, covering from the innovator’s stage to the laggard’s stage. It focuses on adoption rates in different regions based on penetration. Furthermore, the oilfield services market report also includes key purchase criteria and drivers of price sensitivity to help companies evaluate and develop their market growth analysis strategies.

    Oilfield Services Market Share by Geography

     Customer Landscape

    Key Companies & Market Insights

    Companies are implementing various strategies, such as strategic alliances, oilfield services market forecast, partnerships, mergers and acquisitions, geographical expansion, and product/service launches, to enhance their presence in the industry.

    Archer Ltd. - The company specializes in providing comprehensive oilfield services, encompassing drilling operations, well integrity interventions, plug and abandonment, and decommissioning of infrastructure for the oil and gas industry. Our expertise lies in ensuring the highest standards of safety and efficiency in these critical areas. Through advanced technologies and proven methodologies, we deliver solutions that enhance production, minimize downtime, and promote sustainable operations. Our team of experienced professionals is dedicated to optimizing asset life cycles and maximizing returns for our clients.

    The industry research and growth report includes detailed analyses of the competitive landscape of the market and information about key companies, including:

    • Archer Ltd.
    • Baker Hughes Co.
    • Calfrac Well Services Ltd.
    • Caterpillar Inc.
    • China Oilfield Services Ltd.
    • Expro Group Holdings NV
    • Halliburton Co.
    • Helmerich and Payne Inc.
    • Huawei Technologies Co. Ltd.
    • Key Energy Services Inc.
    • Nabors Industries Ltd.
    • Nexans AmerCable
    • NOV Inc.
    • Oil States International Inc.
    • Patterson UTI Energy Inc.
    • Proserv UK Ltd.
    • Saipem S.p.A.
    • Schlumberger Ltd.
    • Superior Energy Services Inc.
    • TechnipFMC plc

    Qualitative and quantitative analysis of companies has been conducted to help clients understand the wider business environment as well as the strengths and weaknesses of key industry players. Data is qualitatively analyzed to categorize companies as pure play, category-focused, industry-focused, and diversified; it is quantitatively analyzed to categorize companies as dominant, leading, strong, tentative, and weak.

    Recent Development and News in Oilfield Services Market

    • In January 2024, Schlumberger Limited, a leading oilfield services company, announced the launch of its new digital platform, "Oilfield Data Intelligence Hub," designed to optimize drilling operations and enhance data analytics for clients (Schlumberger press release, 2024). This innovative solution aims to improve operational efficiency and reduce costs for oil and gas companies.
    • In March 2024, Baker Hughes, a GE company, and Saudi Aramco, the world's largest oil company, signed a strategic collaboration agreement to jointly develop and commercialize advanced technologies for the energy sector (Baker Hughes press release, 2024). This partnership focuses on digitalization, automation, and sustainable energy solutions, positioning both companies at the forefront of technological innovation in the oilfield services industry.
    • In July 2025, Halliburton Company completed the acquisition of Danish firm, National Oilwell Varco, for approximately USD3.3 billion (Halliburton SEC filing, 2025). This merger strengthens Halliburton's position as a leading provider of oilfield equipment and services, expanding its product portfolio and enhancing its operational capabilities.
    • In November 2025, the United States Bureau of Land Management (BLM) announced a new policy to encourage the use of hydraulic fracturing, or fracking, in federal lands, opening up new opportunities for oilfield services companies (BLM press release, 2025). This policy change is expected to boost demand for oilfield services, particularly in drilling, completion, and production activities.

    Research Analyst Overview

    • In the dynamic the market, service providers are leveraging advanced technologies to enhance drilling performance and ensure well integrity in the exploration and production of unconventional resources, including shale gas and tight oil. Blowout prevention and offshore safety remain top priorities, with machine learning and artificial intelligence used for drilling cost optimization and hazard mitigation. Environmental impact assessments are integral to field development plans, while reservoir simulation and production data analysis inform well abandonment and decommissioning strategies. Drilling permits are secured through data-driven decision-making, and equipment rental and waste minimization contribute to carbon footprint reduction. Arctic drilling and deepwater projects require specialized expertise, with wellbore clean-up and water recycling essential for sustainable operations.
    • Safety training and well control are ongoing concerns, as is the integration of green energy and digital twin technologies to improve field optimization and reduce drilling hazards. Production optimization software and plugging and abandonment solutions are essential for maximizing efficiency and minimizing costs throughout the drilling lifecycle.

    Dive into Technavio’s robust research methodology, blending expert interviews, extensive data synthesis, and validated models for unparalleled Oilfield Services Market insights. See full methodology.

    Market Scope

    Report Coverage

    Details

    Page number

    207

    Base year

    2024

    Historic period

    2019-2023

    Forecast period

    2025-2029

    Growth momentum & CAGR

    Accelerate at a CAGR of 4.6%

    Market growth 2025-2029

    USD 42.5 billion

    Market structure

    Fragmented

    YoY growth 2024-2025(%)

    4.4

    Key countries

    US, Canada, Russia, Saudi Arabia, China, UAE, Japan, Qatar, Mexico, and India

    Competitive landscape

    Leading Companies, Market Positioning of Companies, Competitive Strategies, and Industry Risks

    Request Free Sample

    What are the Key Data Covered in this Oilfield Services Market Research and Growth Report?

    • CAGR of the Oilfield Services industry during the forecast period
    • Detailed information on factors that will drive the growth and forecasting between 2025 and 2029
    • Precise estimation of the size of the market and its contribution of the industry in focus to the parent market
    • Accurate predictions about upcoming growth and trends and changes in consumer behaviour
    • Growth of the market across North America, Middle East and Africa, APAC, Europe, and South America
    • Thorough analysis of the market’s competitive landscape and detailed information about companies
    • Comprehensive analysis of factors that will challenge the oilfield services market growth of industry companies

    We can help! Our analysts can customize this oilfield services market research report to meet your requirements.

    Get in touch


    1 Executive Summary

    • 1.1 Market overview
      • Executive Summary - Chart on Market Overview
      • Executive Summary - Data Table on Market Overview
      • Executive Summary - Chart on Global Market Characteristics
      • Executive Summary - Chart on Market by Geography
      • Executive Summary - Chart on Market Segmentation by Application
      • Executive Summary - Chart on Market Segmentation by Type
      • Executive Summary - Chart on Incremental Growth
      • Executive Summary - Data Table on Incremental Growth
      • Executive Summary - Chart on Company Market Positioning

    2 Technavio Analysis

    • 2.1 Analysis of price sensitivity, lifecycle, customer purchase basket, adoption rates, and purchase criteria
      • Analysis of price sensitivity, lifecycle, customer purchase basket, adoption rates, and purchase criteria
    • 2.2 Criticality of inputs and Factors of differentiation
      • Overview on criticality of inputs and factors of differentiation
    • 2.3 Factors of disruption
      • Overview on factors of disruption
    • 2.4 Impact of drivers and challenges
      • Impact of drivers and challenges in 2024 and 2029

    3 Market Landscape

    • 3.1 Market ecosystem
      • Parent Market
      • Data Table on - Parent Market
    • 3.2 Market characteristics
      • Market characteristics analysis
    • 3.3 Value chain analysis
      • Value chain analysis

    4 Market Sizing

    • 4.1 Market definition
      • Offerings of companies included in the market definition
    • 4.2 Market segment analysis
      • Market segments
    • 4.3 Market size 2024
      • 4.4 Market outlook: Forecast for 2024-2029
        • Chart on Global - Market size and forecast 2024-2029 ($ billion)
        • Data Table on Global - Market size and forecast 2024-2029 ($ billion)
        • Chart on Global Market: Year-over-year growth 2024-2029 (%)
        • Data Table on Global Market: Year-over-year growth 2024-2029 (%)

      5 Historic Market Size

      • 5.1 Global Oilfield Services Market 2019 - 2023
        • Historic Market Size - Data Table on Global Oilfield Services Market 2019 - 2023 ($ billion)
      • 5.2 Application segment analysis 2019 - 2023
        • Historic Market Size - Application Segment 2019 - 2023 ($ billion)
      • 5.3 Type segment analysis 2019 - 2023
        • Historic Market Size - Type Segment 2019 - 2023 ($ billion)
      • 5.4 Geography segment analysis 2019 - 2023
        • Historic Market Size - Geography Segment 2019 - 2023 ($ billion)
      • 5.5 Country segment analysis 2019 - 2023
        • Historic Market Size - Country Segment 2019 - 2023 ($ billion)

      6 Qualitative Analysis

      • 6.1 Impact of AI on the Global Oilfield Services Market

        7 Five Forces Analysis

        • 7.1 Five forces summary
          • Five forces analysis - Comparison between 2024 and 2029
        • 7.2 Bargaining power of buyers
          • Bargaining power of buyers - Impact of key factors 2024 and 2029
        • 7.3 Bargaining power of suppliers
          • Bargaining power of suppliers - Impact of key factors in 2024 and 2029
        • 7.4 Threat of new entrants
          • Threat of new entrants - Impact of key factors in 2024 and 2029
        • 7.5 Threat of substitutes
          • Threat of substitutes - Impact of key factors in 2024 and 2029
        • 7.6 Threat of rivalry
          • Threat of rivalry - Impact of key factors in 2024 and 2029
        • 7.7 Market condition
          • Chart on Market condition - Five forces 2024 and 2029

        8 Market Segmentation by Application

        • 8.1 Market segments
          • Chart on Application - Market share 2024-2029 (%)
          • Data Table on Application - Market share 2024-2029 (%)
        • 8.2 Comparison by Application
          • Chart on Comparison by Application
          • Data Table on Comparison by Application
        • 8.3 Onshore - Market size and forecast 2024-2029
          • Chart on Onshore - Market size and forecast 2024-2029 ($ billion)
          • Data Table on Onshore - Market size and forecast 2024-2029 ($ billion)
          • Chart on Onshore - Year-over-year growth 2024-2029 (%)
          • Data Table on Onshore - Year-over-year growth 2024-2029 (%)
        • 8.4 Offshore - Market size and forecast 2024-2029
          • Chart on Offshore - Market size and forecast 2024-2029 ($ billion)
          • Data Table on Offshore - Market size and forecast 2024-2029 ($ billion)
          • Chart on Offshore - Year-over-year growth 2024-2029 (%)
          • Data Table on Offshore - Year-over-year growth 2024-2029 (%)
        • 8.5 Market opportunity by Application
          • Market opportunity by Application ($ billion)
          • Data Table on Market opportunity by Application ($ billion)

        9 Market Segmentation by Type

        • 9.1 Market segments
          • Chart on Type - Market share 2024-2029 (%)
          • Data Table on Type - Market share 2024-2029 (%)
        • 9.2 Comparison by Type
          • Chart on Comparison by Type
          • Data Table on Comparison by Type
        • 9.3 Field operations - Market size and forecast 2024-2029
          • Chart on Field operations - Market size and forecast 2024-2029 ($ billion)
          • Data Table on Field operations - Market size and forecast 2024-2029 ($ billion)
          • Chart on Field operations - Year-over-year growth 2024-2029 (%)
          • Data Table on Field operations - Year-over-year growth 2024-2029 (%)
        • 9.4 Analytical and consulting services - Market size and forecast 2024-2029
          • Chart on Analytical and consulting services - Market size and forecast 2024-2029 ($ billion)
          • Data Table on Analytical and consulting services - Market size and forecast 2024-2029 ($ billion)
          • Chart on Analytical and consulting services - Year-over-year growth 2024-2029 (%)
          • Data Table on Analytical and consulting services - Year-over-year growth 2024-2029 (%)
        • 9.5 Equipment rental - Market size and forecast 2024-2029
          • Chart on Equipment rental - Market size and forecast 2024-2029 ($ billion)
          • Data Table on Equipment rental - Market size and forecast 2024-2029 ($ billion)
          • Chart on Equipment rental - Year-over-year growth 2024-2029 (%)
          • Data Table on Equipment rental - Year-over-year growth 2024-2029 (%)
        • 9.6 Market opportunity by Type
          • Market opportunity by Type ($ billion)
          • Data Table on Market opportunity by Type ($ billion)

        10 Customer Landscape

        • 10.1 Customer landscape overview
          • Analysis of price sensitivity, lifecycle, customer purchase basket, adoption rates, and purchase criteria

        11 Geographic Landscape

        • 11.1 Geographic segmentation
          • Chart on Market share by geography 2024-2029 (%)
          • Data Table on Market share by geography 2024-2029 (%)
        • 11.2 Geographic comparison
          • Chart on Geographic comparison
          • Data Table on Geographic comparison
        • 11.3 North America - Market size and forecast 2024-2029
          • Chart on North America - Market size and forecast 2024-2029 ($ billion)
          • Data Table on North America - Market size and forecast 2024-2029 ($ billion)
          • Chart on North America - Year-over-year growth 2024-2029 (%)
          • Data Table on North America - Year-over-year growth 2024-2029 (%)
        • 11.4 Middle East and Africa - Market size and forecast 2024-2029
          • Chart on Middle East and Africa - Market size and forecast 2024-2029 ($ billion)
          • Data Table on Middle East and Africa - Market size and forecast 2024-2029 ($ billion)
          • Chart on Middle East and Africa - Year-over-year growth 2024-2029 (%)
          • Data Table on Middle East and Africa - Year-over-year growth 2024-2029 (%)
        • 11.5 APAC - Market size and forecast 2024-2029
          • Chart on APAC - Market size and forecast 2024-2029 ($ billion)
          • Data Table on APAC - Market size and forecast 2024-2029 ($ billion)
          • Chart on APAC - Year-over-year growth 2024-2029 (%)
          • Data Table on APAC - Year-over-year growth 2024-2029 (%)
        • 11.6 Europe - Market size and forecast 2024-2029
          • Chart on Europe - Market size and forecast 2024-2029 ($ billion)
          • Data Table on Europe - Market size and forecast 2024-2029 ($ billion)
          • Chart on Europe - Year-over-year growth 2024-2029 (%)
          • Data Table on Europe - Year-over-year growth 2024-2029 (%)
        • 11.7 South America - Market size and forecast 2024-2029
          • Chart on South America - Market size and forecast 2024-2029 ($ billion)
          • Data Table on South America - Market size and forecast 2024-2029 ($ billion)
          • Chart on South America - Year-over-year growth 2024-2029 (%)
          • Data Table on South America - Year-over-year growth 2024-2029 (%)
        • 11.8 US - Market size and forecast 2024-2029
          • Chart on US - Market size and forecast 2024-2029 ($ billion)
          • Data Table on US - Market size and forecast 2024-2029 ($ billion)
          • Chart on US - Year-over-year growth 2024-2029 (%)
          • Data Table on US - Year-over-year growth 2024-2029 (%)
        • 11.9 Canada - Market size and forecast 2024-2029
          • Chart on Canada - Market size and forecast 2024-2029 ($ billion)
          • Data Table on Canada - Market size and forecast 2024-2029 ($ billion)
          • Chart on Canada - Year-over-year growth 2024-2029 (%)
          • Data Table on Canada - Year-over-year growth 2024-2029 (%)
        • 11.10 Russia - Market size and forecast 2024-2029
          • Chart on Russia - Market size and forecast 2024-2029 ($ billion)
          • Data Table on Russia - Market size and forecast 2024-2029 ($ billion)
          • Chart on Russia - Year-over-year growth 2024-2029 (%)
          • Data Table on Russia - Year-over-year growth 2024-2029 (%)
        • 11.11 Saudi Arabia - Market size and forecast 2024-2029
          • Chart on Saudi Arabia - Market size and forecast 2024-2029 ($ billion)
          • Data Table on Saudi Arabia - Market size and forecast 2024-2029 ($ billion)
          • Chart on Saudi Arabia - Year-over-year growth 2024-2029 (%)
          • Data Table on Saudi Arabia - Year-over-year growth 2024-2029 (%)
        • 11.12 China - Market size and forecast 2024-2029
          • Chart on China - Market size and forecast 2024-2029 ($ billion)
          • Data Table on China - Market size and forecast 2024-2029 ($ billion)
          • Chart on China - Year-over-year growth 2024-2029 (%)
          • Data Table on China - Year-over-year growth 2024-2029 (%)
        • 11.13 UAE - Market size and forecast 2024-2029
          • Chart on UAE - Market size and forecast 2024-2029 ($ billion)
          • Data Table on UAE - Market size and forecast 2024-2029 ($ billion)
          • Chart on UAE - Year-over-year growth 2024-2029 (%)
          • Data Table on UAE - Year-over-year growth 2024-2029 (%)
        • 11.14 Qatar - Market size and forecast 2024-2029
          • Chart on Qatar - Market size and forecast 2024-2029 ($ billion)
          • Data Table on Qatar - Market size and forecast 2024-2029 ($ billion)
          • Chart on Qatar - Year-over-year growth 2024-2029 (%)
          • Data Table on Qatar - Year-over-year growth 2024-2029 (%)
        • 11.15 Japan - Market size and forecast 2024-2029
          • Chart on Japan - Market size and forecast 2024-2029 ($ billion)
          • Data Table on Japan - Market size and forecast 2024-2029 ($ billion)
          • Chart on Japan - Year-over-year growth 2024-2029 (%)
          • Data Table on Japan - Year-over-year growth 2024-2029 (%)
        • 11.16 Mexico - Market size and forecast 2024-2029
          • Chart on Mexico - Market size and forecast 2024-2029 ($ billion)
          • Data Table on Mexico - Market size and forecast 2024-2029 ($ billion)
          • Chart on Mexico - Year-over-year growth 2024-2029 (%)
          • Data Table on Mexico - Year-over-year growth 2024-2029 (%)
        • 11.17 India - Market size and forecast 2024-2029
          • Chart on India - Market size and forecast 2024-2029 ($ billion)
          • Data Table on India - Market size and forecast 2024-2029 ($ billion)
          • Chart on India - Year-over-year growth 2024-2029 (%)
          • Data Table on India - Year-over-year growth 2024-2029 (%)
        • 11.18 Market opportunity by geography
          • Market opportunity by geography ($ billion)
          • Data Tables on Market opportunity by geography ($ billion)

        12 Drivers, Challenges, and Opportunity/Restraints

        • 12.1 Market drivers
          • 12.2 Market challenges
            • 12.3 Impact of drivers and challenges
              • Impact of drivers and challenges in 2024 and 2029
            • 12.4 Market opportunities/restraints

              13 Competitive Landscape

              • 13.1 Overview
                • 13.2 Competitive Landscape
                  • Overview on criticality of inputs and factors of differentiation
                • 13.3 Landscape disruption
                  • Overview on factors of disruption
                • 13.4 Industry risks
                  • Impact of key risks on business

                14 Competitive Analysis

                • 14.1 Companies profiled
                  • Companies covered
                • 14.2 Company ranking index
                  • Company ranking index
                • 14.3 Market positioning of companies
                  • Matrix on companies position and classification
                • 14.4 Archer Ltd.
                  • Archer Ltd. - Overview
                  • Archer Ltd. - Business segments
                  • Archer Ltd. - Key offerings
                  • Archer Ltd. - Segment focus
                  • SWOT
                • 14.5 Baker Hughes Co.
                  • Baker Hughes Co. - Overview
                  • Baker Hughes Co. - Business segments
                  • Baker Hughes Co. - Key news
                  • Baker Hughes Co. - Key offerings
                  • Baker Hughes Co. - Segment focus
                  • SWOT
                • 14.6 Calfrac Well Services Ltd.
                  • Calfrac Well Services Ltd. - Overview
                  • Calfrac Well Services Ltd. - Business segments
                  • Calfrac Well Services Ltd. - Key offerings
                  • Calfrac Well Services Ltd. - Segment focus
                  • SWOT
                • 14.7 Caterpillar Inc.
                  • Caterpillar Inc. - Overview
                  • Caterpillar Inc. - Business segments
                  • Caterpillar Inc. - Key news
                  • Caterpillar Inc. - Key offerings
                  • Caterpillar Inc. - Segment focus
                  • SWOT
                • 14.8 China Oilfield Services Ltd.
                  • China Oilfield Services Ltd. - Overview
                  • China Oilfield Services Ltd. - Business segments
                  • China Oilfield Services Ltd. - Key offerings
                  • China Oilfield Services Ltd. - Segment focus
                  • SWOT
                • 14.9 Expro Group Holdings NV
                  • Expro Group Holdings NV - Overview
                  • Expro Group Holdings NV - Business segments
                  • Expro Group Holdings NV - Key offerings
                  • Expro Group Holdings NV - Segment focus
                  • SWOT
                • 14.10 Halliburton Co.
                  • Halliburton Co. - Overview
                  • Halliburton Co. - Business segments
                  • Halliburton Co. - Key news
                  • Halliburton Co. - Key offerings
                  • Halliburton Co. - Segment focus
                  • SWOT
                • 14.11 Helmerich and Payne Inc.
                  • Helmerich and Payne Inc. - Overview
                  • Helmerich and Payne Inc. - Business segments
                  • Helmerich and Payne Inc. - Key offerings
                  • Helmerich and Payne Inc. - Segment focus
                  • SWOT
                • 14.12 Key Energy Services Inc.
                  • Key Energy Services Inc. - Overview
                  • Key Energy Services Inc. - Product / Service
                  • Key Energy Services Inc. - Key offerings
                  • SWOT
                • 14.13 Nabors Industries Ltd.
                  • Nabors Industries Ltd. - Overview
                  • Nabors Industries Ltd. - Business segments
                  • Nabors Industries Ltd. - Key news
                  • Nabors Industries Ltd. - Key offerings
                  • Nabors Industries Ltd. - Segment focus
                  • SWOT
                • 14.14 NOV Inc.
                  • NOV Inc. - Overview
                  • NOV Inc. - Business segments
                  • NOV Inc. - Key news
                  • NOV Inc. - Key offerings
                  • NOV Inc. - Segment focus
                  • SWOT
                • 14.15 Oil States International Inc.
                  • Oil States International Inc. - Overview
                  • Oil States International Inc. - Business segments
                  • Oil States International Inc. - Key offerings
                  • Oil States International Inc. - Segment focus
                  • SWOT
                • 14.16 Patterson UTI Energy Inc.
                  • Patterson UTI Energy Inc. - Overview
                  • Patterson UTI Energy Inc. - Business segments
                  • Patterson UTI Energy Inc. - Key news
                  • Patterson UTI Energy Inc. - Key offerings
                  • Patterson UTI Energy Inc. - Segment focus
                  • SWOT
                • 14.17 Saipem S.p.A.
                  • Saipem S.p.A. - Overview
                  • Saipem S.p.A. - Business segments
                  • Saipem S.p.A. - Key offerings
                  • Saipem S.p.A. - Segment focus
                  • SWOT
                • 14.18 Schlumberger Ltd.
                  • Schlumberger Ltd. - Overview
                  • Schlumberger Ltd. - Business segments
                  • Schlumberger Ltd. - Key news
                  • Schlumberger Ltd. - Key offerings
                  • Schlumberger Ltd. - Segment focus
                  • SWOT

                15 Appendix

                • 15.1 Scope of the report
                  • 15.2 Inclusions and exclusions checklist
                    • Inclusions checklist
                    • Exclusions checklist
                  • 15.3 Currency conversion rates for US$
                    • Currency conversion rates for US$
                  • 15.4 Research methodology
                    • Research methodology
                  • 15.5 Data procurement
                    • Information sources
                  • 15.6 Data validation
                    • Data validation
                  • 15.7 Validation techniques employed for market sizing
                    • Validation techniques employed for market sizing
                  • 15.8 Data synthesis
                    • Data synthesis
                  • 15.9 360 degree market analysis
                    • 360 degree market analysis
                  • 15.10 List of abbreviations
                    • List of abbreviations

                  Research Methodology

                  Technavio presents a detailed picture of the market by way of study, synthesis, and summation of data from multiple sources. The analysts have presented the various facets of the market with a particular focus on identifying the key industry influencers. The data thus presented is comprehensive, reliable, and the result of extensive research, both primary and secondary.

                  INFORMATION SOURCES

                  Primary sources

                  • Manufacturers and suppliers
                  • Channel partners
                  • Industry experts
                  • Strategic decision makers

                  Secondary sources

                  • Industry journals and periodicals
                  • Government data
                  • Financial reports of key industry players
                  • Historical data
                  • Press releases

                  DATA ANALYSIS

                  Data Synthesis

                  • Collation of data
                  • Estimation of key figures
                  • Analysis of derived insights

                  Data Validation

                  • Triangulation with data models
                  • Reference against proprietary databases
                  • Corroboration with industry experts

                  REPORT WRITING

                  Qualitative

                  • Market drivers
                  • Market challenges
                  • Market trends
                  • Five forces analysis

                  Quantitative

                  • Market size and forecast
                  • Market segmentation
                  • Geographical insights
                  • Competitive landscape

                  Interested in this report?

                  Get your sample now to see our research methodology and insights!

                  Download Now

                  Frequently Asked Questions

                  Oilfield Services market growth will increase by $ 42.5 bn during 2025-2029.

                  The Oilfield Services market is expected to grow at a CAGR of 4.6% during 2025-2029.

                  Oilfield Services market is segmented by Application( Onshore, Offshore) Type( Field operations, Analytical and consulting services, Equipment rental, Europe, South America)

                  Archer Ltd., Baker Hughes Co., Calfrac Well Services Ltd., Caterpillar Inc., China Oilfield Services Ltd., Expro Group Holdings NV, Halliburton Co., Helmerich and Payne Inc., Huawei Technologies Co. Ltd., Key Energy Services Inc., Nabors Industries Ltd., Nexans AmerCable, NOV Inc., Oil States International Inc., Patterson UTI Energy Inc., Proserv UK Ltd., Saipem S.p.A., Schlumberger Ltd., Superior Energy Services Inc., TechnipFMC plc are a few of the key vendors in the Oilfield Services market.

                  North America will register the highest growth rate of 44% among the other regions. Therefore, the Oilfield Services market in North America is expected to garner significant business opportunities for the vendors during the forecast period.

                  US, Canada, Russia, Saudi Arabia, China, UAE, Japan, Qatar, Mexico, India

                  • Growing demand for oil and natural gas globallyAccording to the US Energy Information Administration is the driving factor this market.
                  • the global liquid fuel consumption averaged 102.8 million barrels per day in 2024. It is expected to grow at a high rate during the forecast period due to the increase in the global demand for oil and gas. Over 70% of this growth in demand for energy is to be met by oil is the driving factor this market.
                  • natural gas is the driving factor this market.
                  • and coal. As the demand for oil and gas is increasing is the driving factor this market.
                  • there is a need to explore and produce new oil and gas reservoirs. Existing reservoirs have started to mature or have depleted. This has resulted in the drilling of new wells. Therefore is the driving factor this market.
                  • new oil and gas wells are being drilled in countries that have not been major producers. Also is the driving factor this market.
                  • as offshore oil and gas reservoirs are larger than onshore reservoirs is the driving factor this market.
                  • and the production life of offshore wells is higher than that of onshore wells is the driving factor this market.
                  • companies are shifting toward offshore E and P activities.As developing countries are urbanizing rapidly is the driving factor this market.
                  • the demand for energy is also increasing significantly. Thus is the driving factor this market.
                  • the consumption of liquid fuels and natural gas has increased.According to the World Bank Group is the driving factor this market.
                  • the percentage of the urban population in China increased from around 897 million in 2022 to around 910 million in 2023. According to the US Energy Information Agency (EIA) is the driving factor this market.
                  • global liquid fuel consumption increased to 102.8 mbpd in 2024 is the driving factor this market.
                  • an increase of 1.0 mbpd from 2023. Thus is the driving factor this market.
                  • to cater to the growing energy demand is the driving factor this market.
                  • major oil and gas companies are increasing their E and P activities.With the increasing consumption of fuel in developing economies such as India and China is the driving factor this market.
                  • the demand for natural gas is also likely to rise during the forecast period. With the growing demand for energy is the driving factor this market.
                  • oil and gas is the driving factor this market.
                  • E and P companies will increase their seismic activities to identify new prospects at both onshore and offshore locations. Therefore is the driving factor this market.
                  • the growing demand for oil and natural gas is expected to drive the growth of the global oilfield services market during the forecast period. is the driving factor this market.

                  The Oilfield Services market vendors should focus on grabbing business opportunities from the Onshore segment as it accounted for the largest market share in the base year.