
Oil And Gas Refinery Maintenance Services Market Size 2026-2030
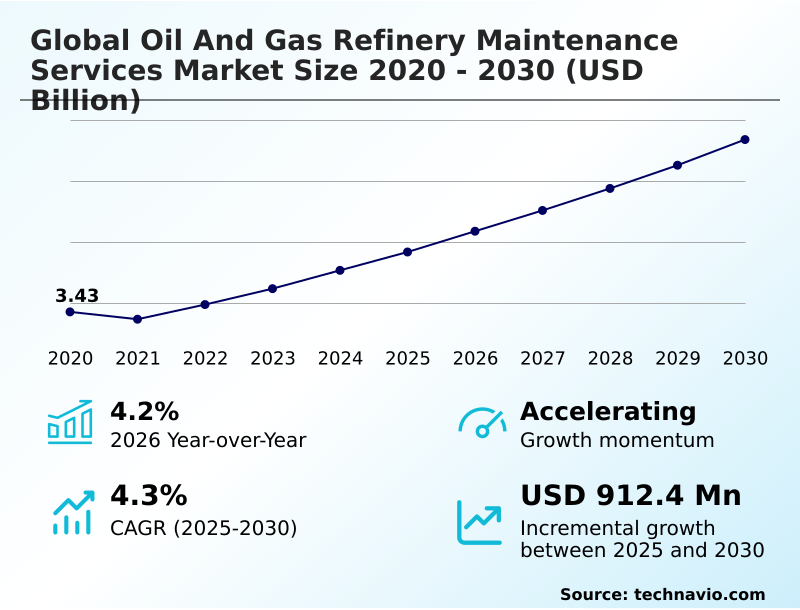
The oil and gas refinery maintenance services market size is valued to increase by USD 912.4 million, at a CAGR of 4.3% from 2025 to 2030. Aging refining infrastructure and asset integrity management will drive the oil and gas refinery maintenance services market.
Major Market Trends & Insights
- APAC dominated the market and accounted for a 42.3% growth during the forecast period.
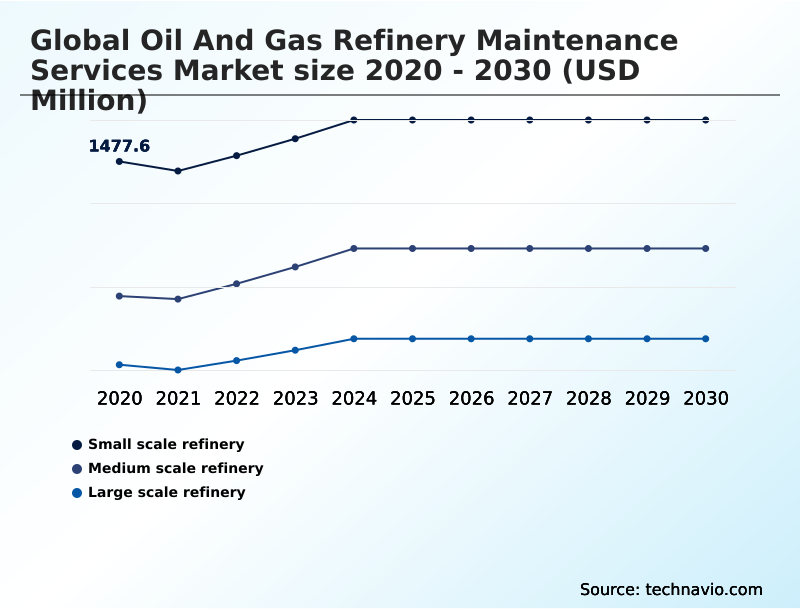
- By End-user - Small scale refinery segment was valued at USD 1.60 billion in 2024
- By Type - Turnaround segment accounted for the largest market revenue share in 2024
Market Size & Forecast
- Market Opportunities: USD 1.41 billion
- Market Future Opportunities: USD 912.4 million
- CAGR from 2025 to 2030 : 4.3%
Market Summary
- The oil and gas refinery maintenance services market is undergoing a significant strategic evolution, shaped by the dual imperatives of operational reliability and environmental compliance. With much of the global refining infrastructure aging, the focus has shifted from reactive repairs to sophisticated, technology-driven interventions centered on asset integrity management.
- The growing complexity of processing heavier crude slates and integrating biofuels necessitates a high degree of technical expertise to manage critical equipment. As a result, outsourcing maintenance activities to specialists who offer integrated lifecycle management services is becoming standard practice.
- A key business scenario involves optimizing a major turnaround, where the use of digital twin technology and advanced diagnostic tools allows for prescriptive maintenance. By simulating repairs and streamlining turnaround logistics, operators can significantly reduce costly downtime. This digital transformation, featuring the industrial internet of things and predictive maintenance models, allows for real-time monitoring of asset health.
- This proactive approach helps mitigate risks associated with mechanical stress and metallurgical degradation, ensuring higher facility uptime and adherence to stringent safety and environmental regulations.
What will be the Size of the Oil And Gas Refinery Maintenance Services Market during the forecast period?
Get Key Insights on Market Forecast (PDF) Get Free Sample
How is the Oil And Gas Refinery Maintenance Services Market Segmented?
The oil and gas refinery maintenance services industry research report provides comprehensive data (region-wise segment analysis), with forecasts and estimates in "USD million" for the period 2026-2030, as well as historical data from 2020-2024 for the following segments.
- End-user
- Small scale refinery
- Medium scale refinery
- Large scale refinery
- Type
- Turnaround
- Maintenance and repair
- Application
- Downstream
- Midstream
- Upstream
- Geography
- APAC
- China
- India
- South Korea
- Europe
- Germany
- Italy
- France
- North America
- US
- Canada
- Mexico
- Middle East and Africa
- Saudi Arabia
- UAE
- South America
- Brazil
- Argentina
- Rest of World (ROW)
- APAC
By End-user Insights
The small scale refinery segment is estimated to witness significant growth during the forecast period.
Small-scale refineries, with capacities under fifty thousand barrels per day, represent a specialized market segment. These facilities rely heavily on third-party providers for asset integrity management and emergency repairs, often lacking extensive in-house engineering teams.
Their maintenance strategies prioritize cost-effectiveness and rapid turnarounds, focusing on essential components like distillation units and storage tanks.
While advanced predictive maintenance models are less common, a growing need for environmental compliance is driving investment in emissions monitoring and non-destructive testing.
The challenge is amplified by a technician shortage, where demand for certified refinery technicians outpaces supply by 20% in some regions, impacting project timelines. Consequently, there is gradual adoption of digital records to enhance operational reliability metrics and streamline audits.
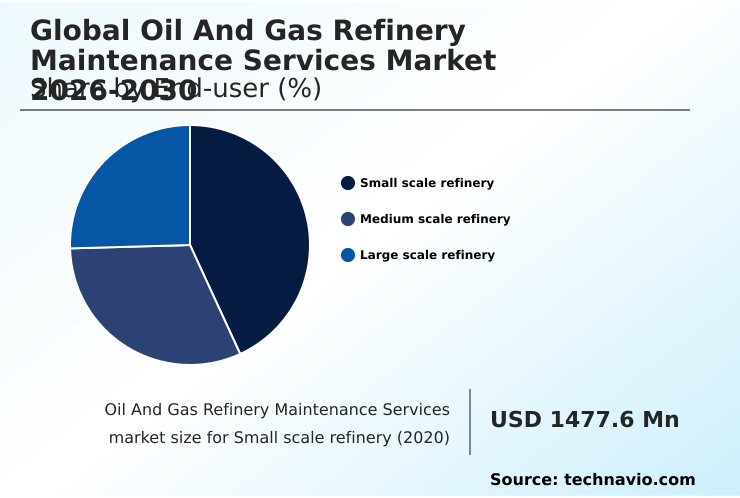
The Small scale refinery segment was valued at USD 1.60 billion in 2024 and showed a gradual increase during the forecast period.
Regional Analysis
APAC is estimated to contribute 42.3% to the growth of the global market during the forecast period.Technavio’s analysts have elaborately explained the regional trends and drivers that shape the market during the forecast period.

See How Oil And Gas Refinery Maintenance Services Market Demand is Rising in APAC Get Free Sample
The geographic landscape is shifting, with the APAC region driving a significant portion of market growth, accounting for over 42% of the incremental growth.
This is fueled by the commissioning of massive new refining complexes in India and China, which require large-scale turnaround projects and advanced services for distillation column overhaul.
In contrast, North America and Europe focus on managing aging assets, prioritizing structural reinforcement and digital upgrades. For instance, recent projects on the US Gulf Coast focus on hardening infrastructure against weather events.
The commissioning of India's Barmer Refinery, adding 180,000 barrels per day of capacity, highlights the demand in APAC for specialized, long-term maintenance frameworks incorporating modular maintenance solutions to ensure the reliability of new, sophisticated units such as heat exchanger maintenance and flare stack inspection.
Market Dynamics
Our researchers analyzed the data with 2025 as the base year, along with the key drivers, trends, and challenges. A holistic analysis of drivers will help companies refine their marketing strategies to gain a competitive advantage.
- Strategic decisions in the oil and gas refinery maintenance services market are increasingly granular, focusing on specific operational challenges. For instance, implementing predictive maintenance for rotating equipment is now a standard practice to preempt failures in pumps and compressors. Similarly, the robotic inspection of storage tanks is enhancing safety while providing more accurate data on structural integrity.
- A critical area of focus is managing corrosion under insulation, which requires specialized techniques to prevent hidden degradation of piping. Turnaround optimization using digital twins allows for virtual rehearsals of complex projects, drastically reducing execution risks. The maintenance strategies for hydrocracking units are also evolving, demanding specialized knowledge of high-pressure, high-temperature environments.
- Advanced non-destructive testing for pressure vessels is crucial for compliance and safety assurance. Firms are enhancing safety with remote inspections, minimizing human exposure to hazardous zones. The core challenge of asset integrity for aging refineries is being addressed through data-driven lifecycle assessments. A key objective is reducing emissions through maintenance by ensuring the optimal performance of environmental control systems.
- However, the skilled labor gap in turnarounds remains a significant constraint. Addressing cybersecurity for refinery control systems has become a top priority to protect against digital threats. Stakeholders are improving uptime with iiotsensors, providing real-time health data on thousands of components. The maintenance of flare gas recovery systems and services for catalyst replacement are specialized niches offering high value.
- Asset performance in petrochemical plants is being maximized through integrated reliability programs. Digital twin for refinery operations and services for leak detection and repair are now fundamental tools. Effective planning for refinery turnaround projects, maintenance of sulfur recovery units, and optimizing heat exchanger cleaning cycles are all critical for maintaining profitability in a competitive market.
- Facilities adopting these integrated approaches report efficiency gains more than twice as effective as those relying on traditional methods.
What are the key market drivers leading to the rise in the adoption of Oil And Gas Refinery Maintenance Services Industry?
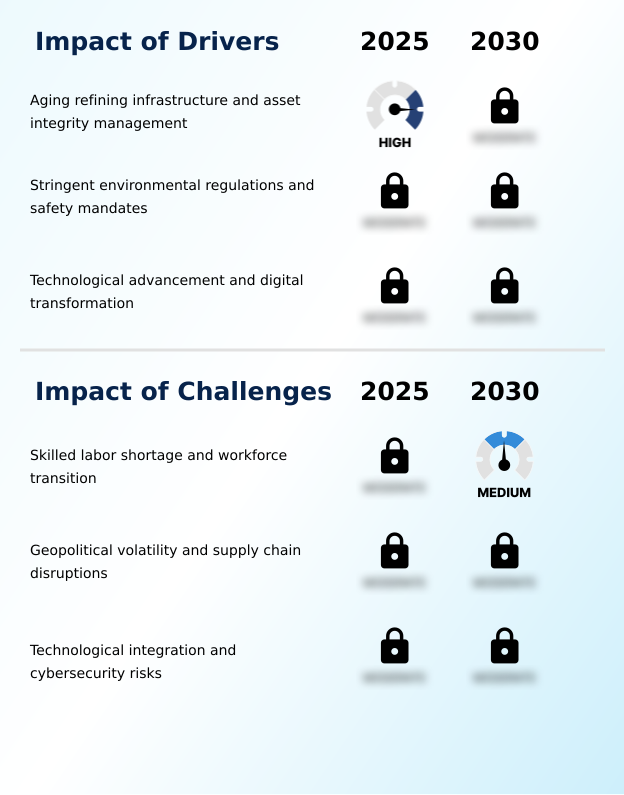
- The aging of existing refining infrastructure, coupled with the critical need for robust asset integrity management, serves as a primary driver for the market.
- The market is primarily driven by the increasing age of refining infrastructure, particularly in mature economies.
- Operators must invest in comprehensive asset integrity programs to manage issues like corrosion under insulation and extend equipment life, which can improve asset longevity programs by over 15%.
- Stringent environmental regulations also propel demand, requiring energy-efficient maintenance of emission control systems to pass environmental compliance audits. Adherence to these mandates is critical, as non-compliance can result in fines that are 50% higher than the cost of proactive maintenance.
- Concurrently, technological advancements in asset performance management and reliability-centered maintenance are revolutionizing service delivery. The integration of maintenance workflow automation and cloud-based asset management platforms offers a clear path toward operational excellence and technical asset stewardship.
What are the market trends shaping the Oil And Gas Refinery Maintenance Services Industry?
- The acceleration of digital transformation is a dominant market trend, involving the large-scale integration of smart refinery concepts to enhance operational efficiency.
- A dominant trend is the rapid adoption of digital transformation, altering how asset integrity is managed. Operators are integrating smart refinery concepts, where industrial IoT sensors provide continuous data on equipment health. This shift from time-based schedules to condition-based maintenance models has been shown to reduce unplanned shutdowns by up to 30%.
- The use of digital twin technology allows maintenance teams to simulate complex repair scenarios, optimizing turnaround logistics and enhancing process safety management. Furthermore, remote inspection technologies and robotic crawlers are increasingly used for pressure vessel inspection and monitoring fugitive emission monitoring, improving diagnostic accuracy by over 25% while enhancing safety by minimizing human entry into hazardous areas.
- This ensures high refinery utilization rates.
What challenges does the Oil And Gas Refinery Maintenance Services Industry face during its growth?
- A significant challenge impacting industry growth is the widening skilled labor gap, which is further complicated by ongoing workforce transition dynamics.
- A formidable challenge is the widening skilled labor gap, with a large portion of the senior technical workforce nearing retirement. Service providers report project delays increasing by up to 20% due to difficulties in staffing large-scale turnaround management projects. This shortage is intensified by the need for proficiency in both mechanical engineering and digital tools for the smart refinery concept.
- Additionally, the integration of the industrial internet of things introduces significant operational technology cybersecurity risks. Recent industry analysis indicates a 40% year-over-year increase in threats targeting industrial control systems.
- Protecting these digital assets adds complexity and cost to lifecycle management services, requiring continuous investment in security protocols and specialized IT-OT teams to safeguard critical refinery operations from potentially catastrophic breaches, which requires advanced diagnostic tools and rotating machinery analysis.
Exclusive Technavio Analysis on Customer Landscape
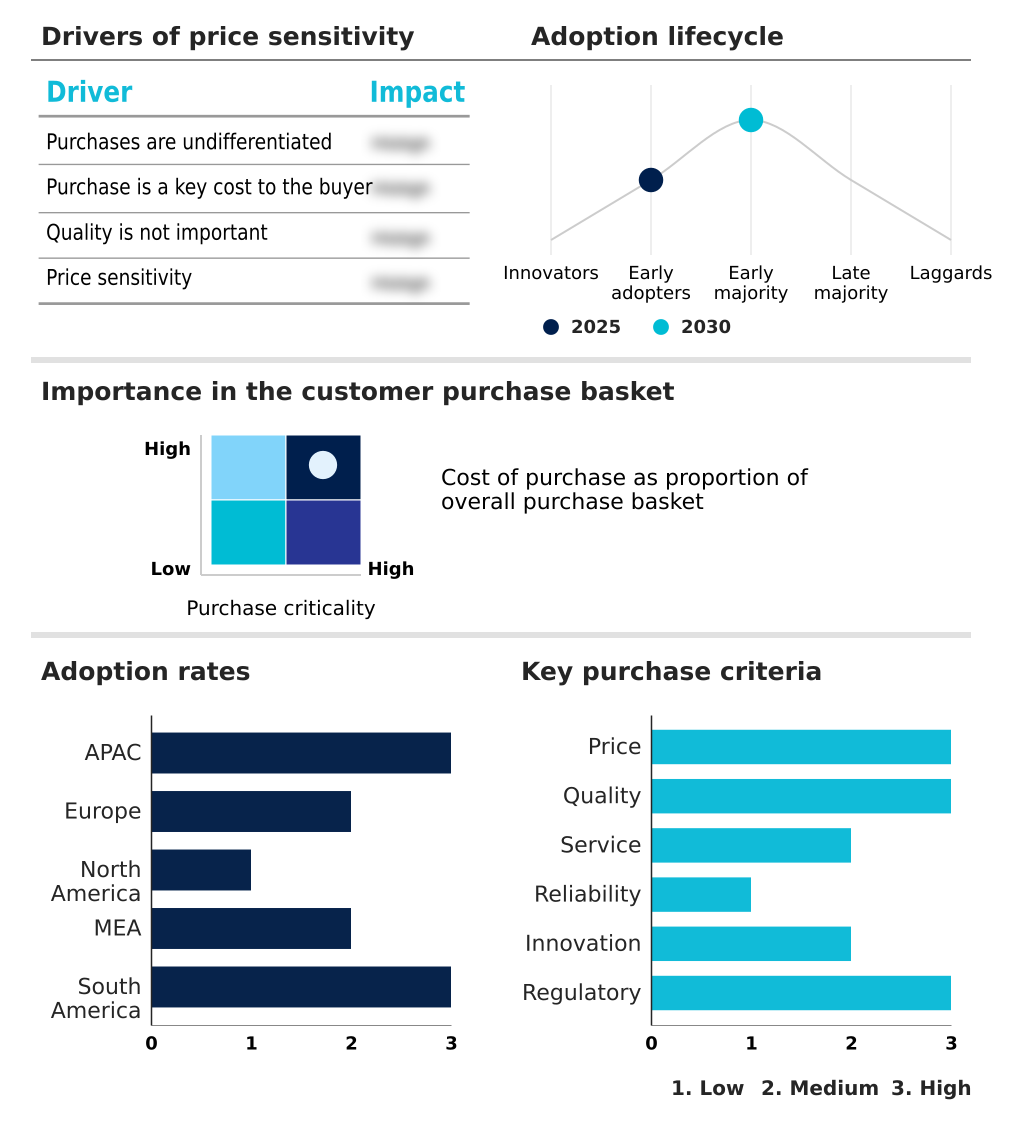
The oil and gas refinery maintenance services market forecasting report includes the adoption lifecycle of the market, covering from the innovator’s stage to the laggard’s stage. It focuses on adoption rates in different regions based on penetration. Furthermore, the oil and gas refinery maintenance services market report also includes key purchase criteria and drivers of price sensitivity to help companies evaluate and develop their market growth analysis strategies.
Customer Landscape of Oil And Gas Refinery Maintenance Services Industry
Competitive Landscape
Companies are implementing various strategies, such as strategic alliances, oil and gas refinery maintenance services market forecast, partnerships, mergers and acquisitions, geographical expansion, and product/service launches, to enhance their presence in the industry.
ABB Ltd. - Specialized services integrate asset performance management with predictive maintenance and automation, enhancing operational integrity and reliability in downstream facilities.
The industry research and growth report includes detailed analyses of the competitive landscape of the market and information about key companies, including:
- ABB Ltd.
- Applus Services Technologies SL
- Baker Hughes Co.
- Bechtel Corp.
- Bilfinger SE
- Emerson Electric Co.
- Fluor Corp.
- Halliburton Co.
- Honeywell International Inc.
- Intertek Group Plc
- KBR Inc.
- McDermott International Ltd.
- ROSEN Swiss AG
- Saipem S.p.A.
- Schlumberger Ltd.
- Schneider Electric SE
- SGS SA
- Siemens Energy AG
- TUV Rheinland Group
- Worley Ltd.
Qualitative and quantitative analysis of companies has been conducted to help clients understand the wider business environment as well as the strengths and weaknesses of key industry players. Data is qualitatively analyzed to categorize companies as pure play, category-focused, industry-focused, and diversified; it is quantitatively analyzed to categorize companies as dominant, leading, strong, tentative, and weak.
Recent Development and News in Oil and gas refinery maintenance services market
- In August, 2025, IndianOil's Panipat Refinery obtained India's first International Sustainability and Carbon Certification (ISCC) CORSIA for Sustainable Aviation Fuel, highlighting the role of precision maintenance in high-spec fuel production.
- In November, 2025, Abu Dhabi's state oil company ADNOC announced a five-year, $150 billion investment plan for 2026-2030 to expand production capacity, signaling significant future maintenance and service contracts.
- In December, 2025, Suncor Energy released its 2026 corporate guidance, projecting refinery utilization rates between 99% and 102%, underscoring the critical role of maintenance in achieving high operational performance.
- In April, 2025, Indian Oil Corp. and Bharat Petroleum Corp. postponed multiple scheduled maintenance turnarounds to ensure domestic fuel supply stability, demonstrating how external factors impact maintenance logistics.
Dive into Technavio’s robust research methodology, blending expert interviews, extensive data synthesis, and validated models for unparalleled Oil And Gas Refinery Maintenance Services Market insights. See full methodology.
| Market Scope | |
|---|---|
| Page number | 302 |
| Base year | 2025 |
| Historic period | 2020-2024 |
| Forecast period | 2026-2030 |
| Growth momentum & CAGR | Accelerate at a CAGR of 4.3% |
| Market growth 2026-2030 | USD 912.4 million |
| Market structure | Fragmented |
| YoY growth 2025-2026(%) | 4.2% |
| Key countries | China, India, South Korea, Japan, Indonesia, Australia, Russia, Germany, Italy, France, UK, Spain, US, Canada, Mexico, Saudi Arabia, Iran, UAE, Kuwait, Nigeria, Brazil, Venezuela and Argentina |
| Competitive landscape | Leading Companies, Market Positioning of Companies, Competitive Strategies, and Industry Risks |
Research Analyst Overview
- The oil and gas refinery maintenance services market is defined by a critical need for advanced asset integrity management. As infrastructure ages, the emphasis on reliability-centered maintenance and comprehensive asset performance management has intensified. Turnaround management is evolving, driven by the smart refinery concept and the industrial internet of things.
- These digital shifts allow for the adoption of predictive maintenance models over traditional reactive approaches. A boardroom-level focus on total cost of ownership has accelerated the use of robotic inspection tools and digital twin technology for complex tasks like heat exchanger maintenance and distillation column overhaul.
- This transition has led to a 30% reduction in diagnostic processing time at some facilities. Service providers now offer specialized capabilities, including non-destructive testing, catalyst handling services, and specialized welding services. Key challenges include managing corrosion under insulation and ensuring the integrity of hydrotreating units and systems for flue gas desulfurization.
- Consequently, services for pressure vessel inspection, piping system maintenance, and rotating machinery analysis are in high demand, supported by modular maintenance solutions and industrial cleaning services to ensure operational readiness and safety through rigorous leak detection and repair programs and inspections of critical components like flare stacks.
What are the Key Data Covered in this Oil And Gas Refinery Maintenance Services Market Research and Growth Report?
-
What is the expected growth of the Oil And Gas Refinery Maintenance Services Market between 2026 and 2030?
-
USD 912.4 million, at a CAGR of 4.3%
-
-
What segmentation does the market report cover?
-
The report is segmented by End-user (Small scale refinery, Medium scale refinery, and Large scale refinery), Type (Turnaround, and Maintenance and repair), Application (Downstream, Midstream, and Upstream) and Geography (APAC, Europe, North America, Middle East and Africa, South America)
-
-
Which regions are analyzed in the report?
-
APAC, Europe, North America, Middle East and Africa and South America
-
-
What are the key growth drivers and market challenges?
-
Aging refining infrastructure and asset integrity management, Skilled labor shortage and workforce transition
-
-
Who are the major players in the Oil And Gas Refinery Maintenance Services Market?
-
ABB Ltd., Applus Services Technologies SL, Baker Hughes Co., Bechtel Corp., Bilfinger SE, Emerson Electric Co., Fluor Corp., Halliburton Co., Honeywell International Inc., Intertek Group Plc, KBR Inc., McDermott International Ltd., ROSEN Swiss AG, Saipem S.p.A., Schlumberger Ltd., Schneider Electric SE, SGS SA, Siemens Energy AG, TUV Rheinland Group and Worley Ltd.
-
Market Research Insights
- The market's dynamics are shaped by a strategic pivot toward proactive technical asset stewardship and lifecycle management services. The adoption of advanced diagnostic tools and remote inspection technologies is driving significant gains, with some operators reporting a 40% improvement in the accuracy of fault detection. This data-centric approach enhances operational reliability metrics and supports facility uptime optimization.
- Furthermore, by leveraging prescriptive maintenance frameworks, refineries can reduce unplanned shutdowns by up to 25%, directly impacting profitability. This transition is essential for managing aging assets and adhering to rigorous process safety management standards.
- As the industry embraces digital asset integrity, maintenance workflow automation is becoming a key enabler of efficiency, ensuring that maintenance schedules are precisely aligned with production goals.
We can help! Our analysts can customize this oil and gas refinery maintenance services market research report to meet your requirements.
 RIA -
RIA - 
