Omega 3 Products Market Analysis North America, APAC, Europe, South America, Middle East and Africa - US, China, Canada, Germany, Japan - Size and Forecast 2024-2028

Omega 3 Products Market Analysis North America, APAC, Europe, South America, Middle East and Africa - US, China, Canada, Germany, Japan - Size and Forecast 2024-2028

Published: Aug 2024 173 Pages SKU: IRTNTR75749

Market Overview at a Glance

$25.52 B
Market Opportunity
8.09%
CAGR
7.32
YoY growth 2023-2024(%)

Omega 3 Products Market Size 2024-2028 

The omega 3 products market size is forecast to increase by USD 25.52 billion at a CAGR of 8.09% between 2023 and 2028.

  • The omega 3 fatty acids market is experiencing significant growth due to increasing consumer awareness of the health benefits associated with these essential nutrients. With a growing focus on preventive healthcare and personalized nutrition, omega 3 supplements have gained popularity as a natural remedy for various health conditions. However, the market is subject to stringent regulations to ensure product safety and quality. Omega-3 fatty acids are found in fish, nuts, seeds, and certain oils, such as flaxseed oil and fish oil. Compliance with these regulations presents a challenge for market players, requiring substantial investment in research and development. Additionally, the market is witnessing a trend towards sustainable sourcing of omega 3 ingredients, as consumers become more conscious of the environmental impact of their consumption choices. Overall, the omega 3 fatty acids market is poised for continued growth, driven by consumer demand for healthier lifestyle options and regulatory compliance.

What will be the Size of the Omega 3 Products Market During the Forecast Period?

Omega 3 Products Market Size

 Request Free Sample

  • The omega-3 product market encompasses a range of health-oriented products, primarily dietary supplements, that provide consumers with essential omega-3 fatty acids. These nutritional supplements have gained significant attention due to their role in supporting various health conditions. The global omega-3 product market has experienced steady growth, driven by increasing consumer awareness of the benefits of omega-3 fatty acids for heart health, inflammation support, eye health, cognitive function, and pregnancy. The severe respiratory symptoms associated with the coronavirus pandemic have further highlighted the importance of maintaining good health, leading to increased demand for omega-3 supplements. Omega-3 fatty acids are naturally found in fish, nuts, seeds, and other foods; however, supplements offer a more convenient and consistent source of these essential nutrients.
  • Moreover, the absorption of omega-3 fatty acids can be influenced by gastric juice and other factors, making supplements a popular choice for those seeking optimal health benefits. The omega-3 product market is expected to continue its growth trajectory as consumers prioritize cardiovascular disease prevention, cognitive function enhancement, and overall wellness.

How is this Omega 3 Products Industry segmented and which is the largest segment?

The omega 3 products industry research report provides comprehensive data (region-wise segment analysis), with forecasts and estimates in "USD billion" for the period 2024-2028, as well as historical data from 2018-2022 for the following segments.

  • Product
    • Functional food and supplements
    • Infant nutrition
    • Pharmaceutical
    • Pet food and feed
  • Type
    • DHA
    • EPA
    • ALA
  • Geography
    • North America
      • Canada
      • US
    • APAC
      • China
      • Japan
    • Europe
      • Germany
    • South America
    • Middle East and Africa

By Product Insights

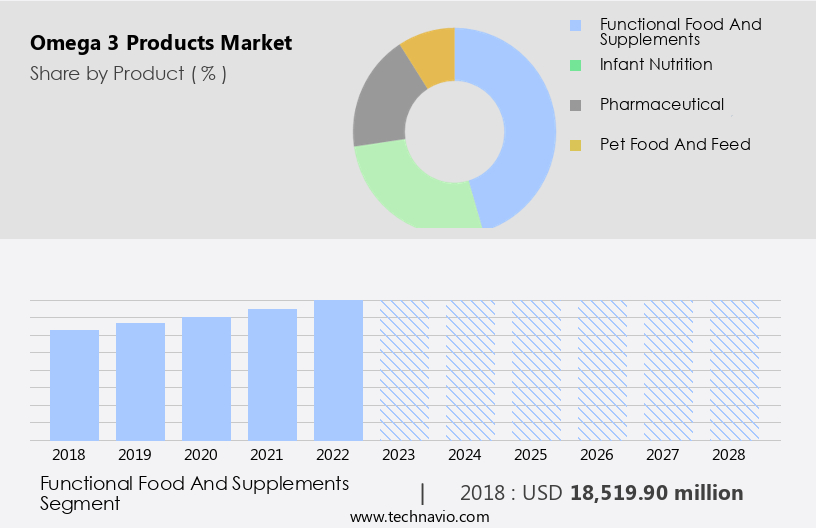
  • The functional food and supplements segment is estimated to witness significant growth during the forecast period.

The omega 3 product market, driven by the functional food segment, has experienced notable growth due to consumers' increasing awareness of the health benefits associated with omega 3 fatty acids. These essential nutrients, found in foods such as fish, nuts, and seeds, contribute to heart health, cognitive function, and overall well-being. Omega 3 supplements have gained popularity as well, particularly In the context of severe respiratory conditions like coronavirus and chronic diseases such as cardiovascular disease, arthritis, strokes, and cancer. Omega-3 ingredients, like DHA oil from algae, are incorporated into various food products, including fortified foods, beverages, cooking oils, and health drinks.

Omega 3 Products Market Size

Get a glance at the  Omega 3 Products Industry report of share of various segments Request Free Sample

The functional food and supplements segment was valued at USD 18.52 billion in 2018 and showed a gradual increase during the forecast period.

Regional Analysis

  • APAC is estimated to contribute 41% to the growth of the global market during the forecast period.

Technavio's analysts have elaborately explained the regional trends and drivers that shape the market during the forecast period.

Omega 3 Products Market Share by Geography

For more insights on the market share of various regions, Request Free Sample

The North American market holds a substantial share In the global omega 3 product industry. The region's market growth is driven by increasing consumer awareness regarding health and wellness, and the proven benefits of omega-3 fatty acids. The US dominates the North American market due to the rising prevalence of chronic diseases, including cancer, heart disease, stroke, diabetes, and arthritis. Consumers are turning to omega-3 products to support heart health, inflammation, eye health, cognitive function, pregnancy, and child development. Omega-3 ingredients are incorporated into various applications, such as dietary supplements, fortified foods, and beverages, cooking oils, eggs, health drinks, and pet products.

Market Dynamics

Our omega 3 products market researchers analyzed the data with 2023 as the base year, along with the key drivers, trends, and challenges. A holistic analysis of drivers will help companies refine their marketing strategies to gain a competitive advantage.

What are the key market drivers leading to the rise In the adoption of Omega 3 Products Industry?

Growing awareness of health benefits associated with omega 3 fatty acids is the key driver of the market.

  • Omega 3, a vital type of fatty acid, plays a crucial role in promoting good health and preventing chronic diseases. These essential fatty acids, primarily found in fish, nuts, seeds, and certain oils, have gained significant attention due to their health benefits. One of the most notable benefits is their ability to reduce inflammation, a key contributor to conditions like arthritis, diabetes, and cardiovascular disease. Omega 3 fatty acids, specifically EPA and DHA, have been shown to decrease inflammation levels and reduce the risk of developing these diseases. Furthermore, omega 3 is essential for heart health. It helps maintain a healthy heart rhythm, reduces triglyceride levels, and lowers blood pressure.
  • Furthermore, consumers increasingly recognize the importance of omega 3 In their diets, leading to the growth of the omega 3 product market. This market includes various forms of omega 3 supplements and fortified foods, such as fish oil, algal DHA oil, fortified beverages, cooking oils, eggs, and health drinks. Several health conditions, including severe respiratory issues related to coronavirus, have highlighted the importance of maintaining good health. Omega 3 supplements have been suggested as potential support for immune function and reducing inflammation In these cases. Senior citizens, pregnant women, and children also benefit from omega 3 for eye health, cognitive function, and cardiovascular disease risk reduction.

What are the market trends shaping the Omega 3 Products Industry?

Increasing focus on preventive healthcare and personalized nutrition is the upcoming market trend.

  • The Omega 3 product market is witnessing significant growth due to the increasing consumer preference for health-oriented products, particularly dietary supplements. Omega-3 fatty acids, found in fish, nuts, seeds, and certain oils, have gained popularity for their numerous health benefits. These benefits include reducing inflammation, supporting heart health, and promoting cognitive function, eye health, and immune function. The rise in chronic diseases such as cardiovascular disease, diabetes, arthritis, strokes, and cancer has fueled the demand for omega-3 supplements and foods. According to the Centers for Disease Control and Prevention (CDC), approximately 14 million people In the US have cardiovascular disease.
  • Moreover, to cater to this growing market, various innovations have emerged, such as odoriferous oils, micro-emulsified formulations, and fortified foods and beverages. These products aim to improve absorption and overcome the challenge of gastric juice In the human diet. Omega-3 ingredients, such as fish oil, algal DHA oil, and fortified foods, are increasingly being used In the dietary supplements sector. Senior citizens and pet owners are also significant consumers of omega-3 products, with companies like Eukanuba offering pet products. Regional and privately labeled local brands are also gaining popularity. Research and development, product innovation, mergers, and distribution networks are key drivers of growth In the omega-3 product market. Manufacturing expertise is also crucial to ensure the quality and consistency of these products.

What challenges does the Omega 3 Products Industry face during its growth?

Stringent regulations on omega 3 products is a key challenge affecting the industry growth.

  • Omega 3 products, including dietary supplements and health-oriented foods, have gained significant attention due to their potential benefits for various chronic diseases, such as cardiovascular disease, arthritis, strokes, and cancer. According to the American Heart Association, approximately 14 million people In the US take omega-3 supplements to support heart health. The omega-3 product market has seen growth in recent years, driven by consumer preference for nutritional supplements and the increasing awareness of the importance of good health and wellness. However, not all consumers have access to these foods or prefer to consume them regularly.
  • As a result, the dietary supplements sector has emerged as a popular alternative. Omega-3 supplements come in various forms, including capsules, soft gels, and odoriferous oils, as well as micro-emulsified formulations designed to improve absorption In the human diet. Strict regulations are essential to ensure the safety and efficacy of omega-3 products. Regulatory agencies such as the FDA and the European Food Safety Authority (EFSA) have established guidelines for labeling accuracy, maximum daily intake levels, and safety evaluations of novel ingredients. These regulations aim to protect consumers from harmful contaminants and misleading claims. Innovation In the omega-3 product market continues to drive growth, with new product offerings such as algal DHA oil, fortified foods, beverages, cooking oils, eggs, and health drinks.

Exclusive Customer Landscape

The omega 3 products market forecasting report includes the adoption lifecycle of the market, covering from the innovator's stage to the laggard's stage. It focuses on adoption rates in different regions based on penetration. Furthermore, the omega 3 products market report also includes key purchase criteria and drivers of price sensitivity to help companies evaluate and develop their market growth analysis strategies.

Omega 3 Products Market Share by Geography

 Customer Landscape

Key Companies & Market Insights

Companies are implementing various strategies, such as strategic alliances, omega 3 products market forecast, partnerships, mergers and acquisitions, geographical expansion, and product/service launches, to enhance their presence In the industry.

The industry research and growth report includes detailed analyses of the competitive landscape of the market and information about key companies, including:

  • Aker BioMarine ASA
  • Amway Corp.
  • Archer Daniels Midland Co.
  • BASF SE
  • Cargill Inc.
  • China Mengniu Dairy Co. Ltd.
  • Cooke Aquaculture Inc.
  • Croda International Plc
  • GC Rieber AS
  • Golden Omega S.A.
  • Herbalife International of America Inc.
  • Koninklijke DSM NV
  • Lonza Group Ltd.
  • Natures Crops International
  • Nestle SA
  • Orkla ASA
  • Pelagia AS
  • Quadra Chemicals Ltd.
  • Reckitt Benckiser Group Plc
  • Unilever PLC

Qualitative and quantitative analysis of companies has been conducted to help clients understand the wider business environment as well as the strengths and weaknesses of key industry players. Data is qualitatively analyzed to categorize companies as pure play, category-focused, industry-focused, and diversified; it is quantitatively analyzed to categorize companies as dominant, leading, strong, tentative, and weak.

Research Analyst Overview

The Omega-3 product market encompasses a wide range of health-oriented products, with dietary supplements being a significant segment. These supplements, derived from Omega-3 fatty acids, have gained popularity due to their numerous health benefits. Consumers seek out Omega-3 supplements as a means to support various aspects of their health, including cardiovascular health, inflammation, cognitive function, and eye health. The global population's increasing awareness of the importance of good health and wellness has fueled the growth of the Omega-3 product market. The prevalence of chronic diseases such as heart disease, arthritis, strokes, and cancer has further prioritized the role of Omega-3 fatty acids in maintaining overall health.

Furthermore, the Omega-3 market caters to diverse consumer preferences, offering various forms of supplements and Omega-3-rich foods. These include fish, nuts, seeds, and fortified foods and beverages. Fish oil, in particular, is a popular source of Omega-3 fatty acids due to its high concentration of these essential nutrients. The dietary supplements sector has witnessed significant innovation in recent years, with the introduction of advanced formulations like micro-emulsified Omega-3 supplements. These formulations enhance the absorption of Omega-3 fatty acids by neutralizing the effects of gastric juice, ensuring optimal utilization by the human body. The Omega-3 product market is not limited to human consumption; it also caters to the health needs of pets.

In addition, pet owners seek out Omega-3 supplements and pet products to support their pets' heart health, inflammation, and cognitive function. The market for Omega-3 products is vast and diverse, with regional variations and private-labeled local brands contributing to its growth. Research and development efforts continue to drive product innovation, with mergers and distribution network expansions shaping the competitive landscape. Manufacturing expertise plays a crucial role In the production of high-quality Omega-3 products. Companies invest in advanced technologies and processes to ensure the purity and potency of their offerings. The Omega-3 product market's future growth is driven by consumer demand for natural, health-promoting ingredients and the increasing prevalence of chronic diseases.

Furthermore, as public initiatives continue to prioritize the importance of a healthy diet, the market for Omega-3 products is poised for continued expansion. In the realm of food and beverages, Omega-3 fatty acids are increasingly being fortified to cater to consumer demand. Cooking oils, eggs, health drinks, and beverages are among the food categories that are being fortified with Omega-3 ingredients. The Indian market is a significant player In the global Omega-3 product market, with a growing consumer base seeking out natural health solutions. The market for Omega-3 products in India is expected to witness strong growth due to increasing awareness and affordability.

Omega 3 Products Market Scope

Report Coverage

Details

Page number

173

Base year

2023

Historic period

2018-2022

Forecast period

2024-2028

Growth momentum & CAGR

Accelerate at a CAGR of 8.09%

Market growth 2024-2028

USD 25.52 billion

Market structure

Fragmented

YoY growth 2023-2024(%)

7.32

Key countries

US, China, Canada, Germany, and Japan

Competitive landscape

Leading Companies, Market Positioning of Companies, Competitive Strategies, and Industry Risks

Request Free Sample

What are the Key Data Covered in this Omega 3 Products Market Research and Growth Report?

  • CAGR of the Omega 3 Products industry during the forecast period
  • Detailed information on factors that will drive the Omega 3 Products growth and forecasting between 2024 and 2028
  • Precise estimation of the size of the market and its contribution of the industry in focus to the parent market
  • Accurate predictions about upcoming growth and trends and changes in consumer behaviour
  • Growth of the market across North America, APAC, Europe, South America, and Middle East and Africa
  • Thorough analysis of the market's competitive landscape and detailed information about companies
  • Comprehensive analysis of factors that will challenge the omega 3 products market growth of industry companies

We can help! Our analysts can customize this omega 3 products market research report to meet your requirements.

Get in touch

1 Executive Summary

  • 1.1 Market overview
    • Executive Summary - Chart on Market Overview
    • Executive Summary - Data Table on Market Overview
    • Executive Summary - Chart on Global Market Characteristics
    • Executive Summary - Chart on Market by Geography
    • Executive Summary - Chart on Market Segmentation by Product
    • Executive Summary - Chart on Market Segmentation by Type
    • Executive Summary - Chart on Incremental Growth
    • Executive Summary - Data Table on Incremental Growth
    • Executive Summary - Chart on Company Market Positioning

2 Market Landscape

  • 2.1 Market ecosystem
    • Parent Market
    • Data Table on - Parent Market
  • 2.2 Market characteristics
    • Market characteristics analysis
  • 2.3 Value chain analysis
    • Value Chain Analysis

3 Market Sizing

  • 3.1 Market definition
    • Offerings of companies included in the market definition
  • 3.2 Market segment analysis
    • Market segments
  • 3.3 Market size 2023
    • 3.4 Market outlook: Forecast for 2023-2028
      • Chart on Global - Market size and forecast 2023-2028 ($ million)
      • Data Table on Global - Market size and forecast 2023-2028 ($ million)
      • Chart on Global Market: Year-over-year growth 2023-2028 (%)
      • Data Table on Global Market: Year-over-year growth 2023-2028 (%)

    4 Historic Market Size

    • 4.1 Global Omega 3 Products Market 2018 - 2022
      • Historic Market Size - Data Table on Global Omega 3 Products Market 2018 - 2022 ($ million)
    • 4.2 Product segment analysis 2018 - 2022
      • Historic Market Size - Product Segment 2018 - 2022 ($ million)
    • 4.3 Type segment analysis 2018 - 2022
      • Historic Market Size - Type Segment 2018 - 2022 ($ million)
    • 4.4 Geography segment analysis 2018 - 2022
      • Historic Market Size - Geography Segment 2018 - 2022 ($ million)
    • 4.5 Country segment analysis 2018 - 2022
      • Historic Market Size - Country Segment 2018 - 2022 ($ million)

    5 Five Forces Analysis

    • 5.1 Five forces summary
      • Five forces analysis - Comparison between 2023 and 2028
    • 5.2 Bargaining power of buyers
      • Bargaining power of buyers - Impact of key factors 2023 and 2028
    • 5.3 Bargaining power of suppliers
      • Bargaining power of suppliers - Impact of key factors in 2023 and 2028
    • 5.4 Threat of new entrants
      • Threat of new entrants - Impact of key factors in 2023 and 2028
    • 5.5 Threat of substitutes
      • Threat of substitutes - Impact of key factors in 2023 and 2028
    • 5.6 Threat of rivalry
      • Threat of rivalry - Impact of key factors in 2023 and 2028
    • 5.7 Market condition
      • Chart on Market condition - Five forces 2023 and 2028

    6 Market Segmentation by Product

    • 6.1 Market segments
      • Chart on Product - Market share 2023-2028 (%)
      • Data Table on Product - Market share 2023-2028 (%)
    • 6.2 Comparison by Product
      • Chart on Comparison by Product
      • Data Table on Comparison by Product
    • 6.3 Functional food and supplements - Market size and forecast 2023-2028
      • Chart on Functional food and supplements - Market size and forecast 2023-2028 ($ million)
      • Data Table on Functional food and supplements - Market size and forecast 2023-2028 ($ million)
      • Chart on Functional food and supplements - Year-over-year growth 2023-2028 (%)
      • Data Table on Functional food and supplements - Year-over-year growth 2023-2028 (%)
    • 6.4 Infant nutrition - Market size and forecast 2023-2028
      • Chart on Infant nutrition - Market size and forecast 2023-2028 ($ million)
      • Data Table on Infant nutrition - Market size and forecast 2023-2028 ($ million)
      • Chart on Infant nutrition - Year-over-year growth 2023-2028 (%)
      • Data Table on Infant nutrition - Year-over-year growth 2023-2028 (%)
    • 6.5 Pharmaceutical - Market size and forecast 2023-2028
      • Chart on Pharmaceutical - Market size and forecast 2023-2028 ($ million)
      • Data Table on Pharmaceutical - Market size and forecast 2023-2028 ($ million)
      • Chart on Pharmaceutical - Year-over-year growth 2023-2028 (%)
      • Data Table on Pharmaceutical - Year-over-year growth 2023-2028 (%)
    • 6.6 Pet food and feed - Market size and forecast 2023-2028
      • Chart on Pet food and feed - Market size and forecast 2023-2028 ($ million)
      • Data Table on Pet food and feed - Market size and forecast 2023-2028 ($ million)
      • Chart on Pet food and feed - Year-over-year growth 2023-2028 (%)
      • Data Table on Pet food and feed - Year-over-year growth 2023-2028 (%)
    • 6.7 Market opportunity by Product
      • Market opportunity by Product ($ million)
      • Data Table on Market opportunity by Product ($ million)

    7 Market Segmentation by Type

    • 7.1 Market segments
      • Chart on Type - Market share 2023-2028 (%)
      • Data Table on Type - Market share 2023-2028 (%)
    • 7.2 Comparison by Type
      • Chart on Comparison by Type
      • Data Table on Comparison by Type
    • 7.3 DHA - Market size and forecast 2023-2028
      • Chart on DHA - Market size and forecast 2023-2028 ($ million)
      • Data Table on DHA - Market size and forecast 2023-2028 ($ million)
      • Chart on DHA - Year-over-year growth 2023-2028 (%)
      • Data Table on DHA - Year-over-year growth 2023-2028 (%)
    • 7.4 EPA - Market size and forecast 2023-2028
      • Chart on EPA - Market size and forecast 2023-2028 ($ million)
      • Data Table on EPA - Market size and forecast 2023-2028 ($ million)
      • Chart on EPA - Year-over-year growth 2023-2028 (%)
      • Data Table on EPA - Year-over-year growth 2023-2028 (%)
    • 7.5 ALA - Market size and forecast 2023-2028
      • Chart on ALA - Market size and forecast 2023-2028 ($ million)
      • Data Table on ALA - Market size and forecast 2023-2028 ($ million)
      • Chart on ALA - Year-over-year growth 2023-2028 (%)
      • Data Table on ALA - Year-over-year growth 2023-2028 (%)
    • 7.6 Market opportunity by Type
      • Market opportunity by Type ($ million)
      • Data Table on Market opportunity by Type ($ million)

    8 Customer Landscape

    • 8.1 Customer landscape overview
      • Analysis of price sensitivity, lifecycle, customer purchase basket, adoption rates, and purchase criteria

    9 Geographic Landscape

    • 9.1 Geographic segmentation
      • Chart on Market share by geography 2023-2028 (%)
      • Data Table on Market share by geography 2023-2028 (%)
    • 9.2 Geographic comparison
      • Chart on Geographic comparison
      • Data Table on Geographic comparison
    • 9.3 North America - Market size and forecast 2023-2028
      • Chart on North America - Market size and forecast 2023-2028 ($ million)
      • Data Table on North America - Market size and forecast 2023-2028 ($ million)
      • Chart on North America - Year-over-year growth 2023-2028 (%)
      • Data Table on North America - Year-over-year growth 2023-2028 (%)
    • 9.4 APAC - Market size and forecast 2023-2028
      • Chart on APAC - Market size and forecast 2023-2028 ($ million)
      • Data Table on APAC - Market size and forecast 2023-2028 ($ million)
      • Chart on APAC - Year-over-year growth 2023-2028 (%)
      • Data Table on APAC - Year-over-year growth 2023-2028 (%)
    • 9.5 Europe - Market size and forecast 2023-2028
      • Chart on Europe - Market size and forecast 2023-2028 ($ million)
      • Data Table on Europe - Market size and forecast 2023-2028 ($ million)
      • Chart on Europe - Year-over-year growth 2023-2028 (%)
      • Data Table on Europe - Year-over-year growth 2023-2028 (%)
    • 9.6 South America - Market size and forecast 2023-2028
      • Chart on South America - Market size and forecast 2023-2028 ($ million)
      • Data Table on South America - Market size and forecast 2023-2028 ($ million)
      • Chart on South America - Year-over-year growth 2023-2028 (%)
      • Data Table on South America - Year-over-year growth 2023-2028 (%)
    • 9.7 Middle East and Africa - Market size and forecast 2023-2028
      • Chart on Middle East and Africa - Market size and forecast 2023-2028 ($ million)
      • Data Table on Middle East and Africa - Market size and forecast 2023-2028 ($ million)
      • Chart on Middle East and Africa - Year-over-year growth 2023-2028 (%)
      • Data Table on Middle East and Africa - Year-over-year growth 2023-2028 (%)
    • 9.8 US - Market size and forecast 2023-2028
      • Chart on US - Market size and forecast 2023-2028 ($ million)
      • Data Table on US - Market size and forecast 2023-2028 ($ million)
      • Chart on US - Year-over-year growth 2023-2028 (%)
      • Data Table on US - Year-over-year growth 2023-2028 (%)
    • 9.9 China - Market size and forecast 2023-2028
      • Chart on China - Market size and forecast 2023-2028 ($ million)
      • Data Table on China - Market size and forecast 2023-2028 ($ million)
      • Chart on China - Year-over-year growth 2023-2028 (%)
      • Data Table on China - Year-over-year growth 2023-2028 (%)
    • 9.10 Canada - Market size and forecast 2023-2028
      • Chart on Canada - Market size and forecast 2023-2028 ($ million)
      • Data Table on Canada - Market size and forecast 2023-2028 ($ million)
      • Chart on Canada - Year-over-year growth 2023-2028 (%)
      • Data Table on Canada - Year-over-year growth 2023-2028 (%)
    • 9.11 Germany - Market size and forecast 2023-2028
      • Chart on Germany - Market size and forecast 2023-2028 ($ million)
      • Data Table on Germany - Market size and forecast 2023-2028 ($ million)
      • Chart on Germany - Year-over-year growth 2023-2028 (%)
      • Data Table on Germany - Year-over-year growth 2023-2028 (%)
    • 9.12 Japan - Market size and forecast 2023-2028
      • Chart on Japan - Market size and forecast 2023-2028 ($ million)
      • Data Table on Japan - Market size and forecast 2023-2028 ($ million)
      • Chart on Japan - Year-over-year growth 2023-2028 (%)
      • Data Table on Japan - Year-over-year growth 2023-2028 (%)
    • 9.13 Market opportunity by geography
      • Market opportunity by geography ($ million)
      • Data Tables on Market opportunity by geography ($ million)

    10 Drivers, Challenges, and Opportunity/Restraints

    • 10.1 Market drivers
      • 10.2 Market challenges
        • 10.3 Impact of drivers and challenges
          • Impact of drivers and challenges in 2023 and 2028
        • 10.4 Market opportunities/restraints

          11 Competitive Landscape

          • 11.1 Overview
            • 11.2 Competitive Landscape
              • Overview on criticality of inputs and factors of differentiation
            • 11.3 Landscape disruption
              • Overview on factors of disruption
            • 11.4 Industry risks
              • Impact of key risks on business

            12 Competitive Analysis

            • 12.1 Companies profiled
              • Companies covered
            • 12.2 Market positioning of companies
              • Matrix on companies position and classification
            • 12.3 Aker BioMarine ASA
              • Aker BioMarine ASA - Overview
              • Aker BioMarine ASA - Business segments
              • Aker BioMarine ASA - Key offerings
              • Aker BioMarine ASA - Segment focus
            • 12.4 Archer Daniels Midland Co.
              • Archer Daniels Midland Co. - Overview
              • Archer Daniels Midland Co. - Business segments
              • Archer Daniels Midland Co. - Key news
              • Archer Daniels Midland Co. - Key offerings
              • Archer Daniels Midland Co. - Segment focus
            • 12.5 BASF SE
              • BASF SE - Overview
              • BASF SE - Business segments
              • BASF SE - Key news
              • BASF SE - Key offerings
              • BASF SE - Segment focus
            • 12.6 Cargill Inc.
              • Cargill Inc. - Overview
              • Cargill Inc. - Product / Service
              • Cargill Inc. - Key news
              • Cargill Inc. - Key offerings
            • 12.7 China Mengniu Dairy Co. Ltd.
              • China Mengniu Dairy Co. Ltd. - Overview
              • China Mengniu Dairy Co. Ltd. - Business segments
              • China Mengniu Dairy Co. Ltd. - Key offerings
              • China Mengniu Dairy Co. Ltd. - Segment focus
            • 12.8 Cooke Aquaculture Inc.
              • Cooke Aquaculture Inc. - Overview
              • Cooke Aquaculture Inc. - Product / Service
              • Cooke Aquaculture Inc. - Key offerings
            • 12.9 Croda International Plc
              • Croda International Plc - Overview
              • Croda International Plc - Business segments
              • Croda International Plc - Key news
              • Croda International Plc - Key offerings
              • Croda International Plc - Segment focus
            • 12.10 GC Rieber AS
              • GC Rieber AS - Overview
              • GC Rieber AS - Product / Service
              • GC Rieber AS - Key offerings
            • 12.11 Koninklijke DSM NV
              • Koninklijke DSM NV - Overview
              • Koninklijke DSM NV - Business segments
              • Koninklijke DSM NV - Key news
              • Koninklijke DSM NV - Key offerings
              • Koninklijke DSM NV - Segment focus
            • 12.12 Lonza Group Ltd.
              • Lonza Group Ltd. - Overview
              • Lonza Group Ltd. - Business segments
              • Lonza Group Ltd. - Key news
              • Lonza Group Ltd. - Key offerings
              • Lonza Group Ltd. - Segment focus
            • 12.13 Nestle SA
              • Nestle SA - Overview
              • Nestle SA - Business segments
              • Nestle SA - Key news
              • Nestle SA - Key offerings
              • Nestle SA - Segment focus
            • 12.14 Orkla ASA
              • Orkla ASA - Overview
              • Orkla ASA - Business segments
              • Orkla ASA - Key news
              • Orkla ASA - Key offerings
              • Orkla ASA - Segment focus
            • 12.15 Pelagia AS
              • Pelagia AS - Overview
              • Pelagia AS - Product / Service
              • Pelagia AS - Key offerings
            • 12.16 Reckitt Benckiser Group Plc
              • Reckitt Benckiser Group Plc - Overview
              • Reckitt Benckiser Group Plc - Business segments
              • Reckitt Benckiser Group Plc - Key news
              • Reckitt Benckiser Group Plc - Key offerings
              • Reckitt Benckiser Group Plc - Segment focus
            • 12.17 Unilever PLC
              • Unilever PLC - Overview
              • Unilever PLC - Business segments
              • Unilever PLC - Key news
              • Unilever PLC - Key offerings
              • Unilever PLC - Segment focus

            13 Appendix

            • 13.1 Scope of the report
              • 13.2 Inclusions and exclusions checklist
                • Inclusions checklist
                • Exclusions checklist
              • 13.3 Currency conversion rates for US$
                • Currency conversion rates for US$
              • 13.4 Research methodology
                • Research methodology
              • 13.5 Data procurement
                • Information sources
              • 13.6 Data validation
                • Data validation
              • 13.7 Validation techniques employed for market sizing
                • Validation techniques employed for market sizing
              • 13.8 Data synthesis
                • Data synthesis
              • 13.9 360 degree market analysis
                • 360 degree market analysis
              • 13.10 List of abbreviations
                • List of abbreviations

              Research Methodology

              Technavio presents a detailed picture of the market by way of study, synthesis, and summation of data from multiple sources. The analysts have presented the various facets of the market with a particular focus on identifying the key industry influencers. The data thus presented is comprehensive, reliable, and the result of extensive research, both primary and secondary.

              INFORMATION SOURCES

              Primary sources

              • Manufacturers and suppliers
              • Channel partners
              • Industry experts
              • Strategic decision makers

              Secondary sources

              • Industry journals and periodicals
              • Government data
              • Financial reports of key industry players
              • Historical data
              • Press releases

              DATA ANALYSIS

              Data Synthesis

              • Collation of data
              • Estimation of key figures
              • Analysis of derived insights

              Data Validation

              • Triangulation with data models
              • Reference against proprietary databases
              • Corroboration with industry experts

              REPORT WRITING

              Qualitative

              • Market drivers
              • Market challenges
              • Market trends
              • Five forces analysis

              Quantitative

              • Market size and forecast
              • Market segmentation
              • Geographical insights
              • Competitive landscape

              Interested in this report?

              Get your sample now to see our research methodology and insights!

              Download Now

              Frequently Asked Questions

              Omega 3 Products market growth will increase by $ 25520.2 mn during 2024-2028.

              The Omega 3 Products market is expected to grow at a CAGR of 8.09% during 2024-2028.

              Omega 3 Products market is segmented by Product( Functional food and supplements, Infant nutrition, Pharmaceutical, Pet food and feed) Type( DHA, EPA, ALA)

              Aker BioMarine ASA, Amway Corp., Archer Daniels Midland Co., BASF SE, Cargill Inc., China Mengniu Dairy Co. Ltd., Cooke Aquaculture Inc., Croda International Plc, GC Rieber AS, Golden Omega S.A., Herbalife International of America Inc., Koninklijke DSM NV, Lonza Group Ltd., Natures Crops International, Nestle SA, Orkla ASA, Pelagia AS, Quadra Chemicals Ltd., Reckitt Benckiser Group Plc, Unilever PLC are a few of the key vendors in the Omega 3 Products market.

              APAC will register the highest growth rate of 41% among the other regions. Therefore, the Omega 3 Products market in APAC is expected to garner significant business opportunities for the vendors during the forecast period.

              US, China, Canada, Germany, Japan

              • Growing awareness of health benefits associated with omega 3 fatty acidsOmega 3 is a type of fatty acid essential for maintaining good health. It has been found to have several health benefits is the driving factor this market.
              • such as reducing inflammation is the driving factor this market.
              • improving heart health is the driving factor this market.
              • and boosting brain function. One of the most widely recognized health benefits of omega 3 is its ability to reduce inflammation in the body. Chronic inflammation has been linked to several diseases is the driving factor this market.
              • including arthritis is the driving factor this market.
              • diabetes is the driving factor this market.
              • and heart disease. Consuming omega 3 on a regular basis has been found to reduce inflammation levels and reduce the risk of developing these diseases. Another significant health benefit of omega 3 is its ability to improve heart health. Studies have shown that consuming omega 3 can lower blood pressure is the driving factor this market.
              • reduce triglycerides is the driving factor this market.
              • and decrease the risk of heart attacks and strokes. This is because omega 3 helps reduce inflammation is the driving factor this market.
              • which is a leading cause of heart disease.Omega 3 is also known to boost brain function is the driving factor this market.
              • and consuming it regularly can improve memory is the driving factor this market.
              • concentration is the driving factor this market.
              • and overall cognitive function. This is because omega 3 is a building block for brain cells and helps improve the structure of brain cells is the driving factor this market.
              • making them more efficient. Examples of omega 3 products that can provide these health benefits include fatty fish like salmon is the driving factor this market.
              • sardines is the driving factor this market.
              • and tuna. Other sources of omega 3 include nuts is the driving factor this market.
              • seeds is the driving factor this market.
              • and plant-based oils like flaxseed and chia seed oils. Supplements like fish oil capsules and krill oil are also popular options for individuals looking to increase their omega 3 intake. Thus is the driving factor this market.
              • the above-mentioned factors are expected to increase the demand for omega 3 products is the driving factor this market.
              • which will fuel the growth of the global omega 3 products market during the forecast period. is the driving factor this market.

              The Omega 3 Products market vendors should focus on grabbing business opportunities from the Functional food and supplements segment as it accounted for the largest market share in the base year.
              RIA - Research AI Assistant
              Ask RIA