
Oncology Drugs Market Size 2025-2029
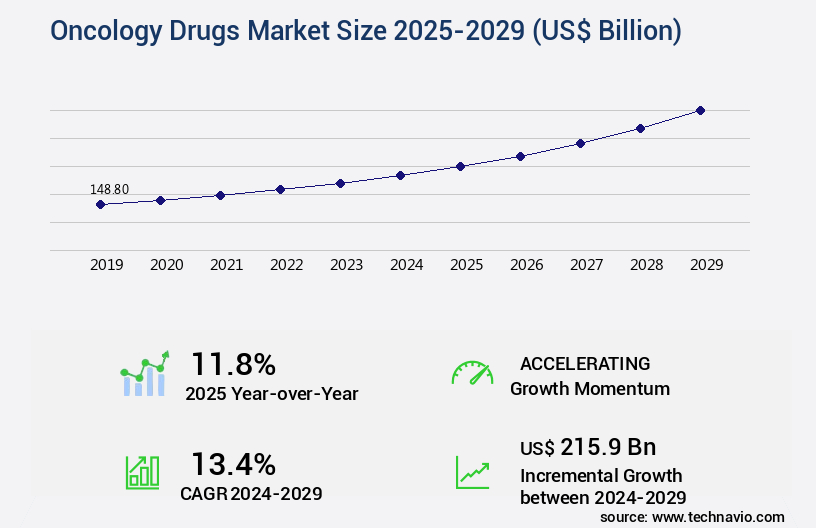
The oncology drugs market size is valued to increase by USD 215.9 billion, at a CAGR of 13.4% from 2024 to 2029. Increasing prevalence of cancer globally will drive the oncology drugs market.
Major Market Trends & Insights
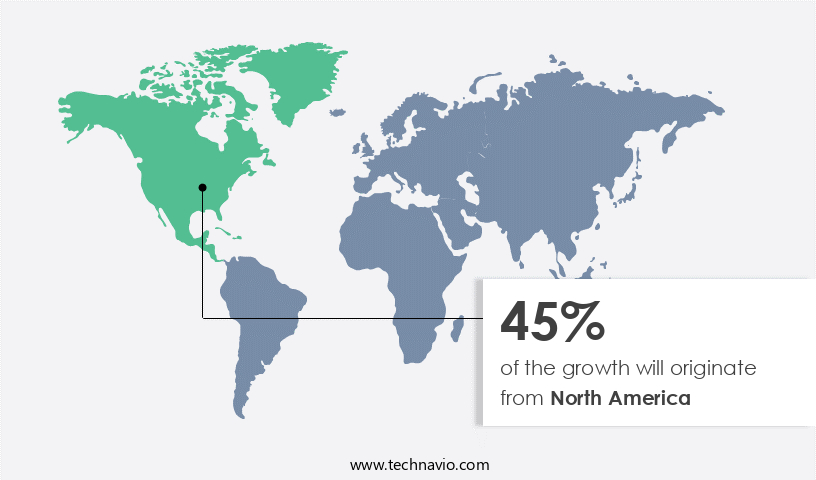
- North America dominated the market and accounted for a 45% growth during the forecast period.
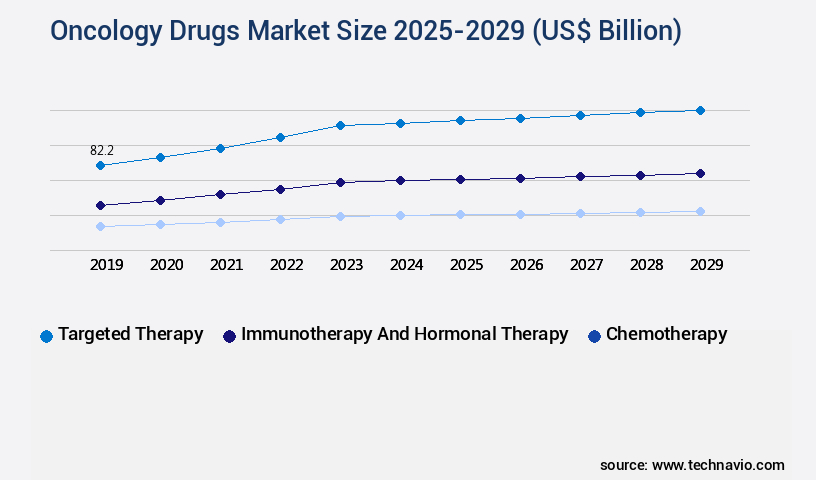
- By Therapy - Targeted therapy segment was valued at USD 82.20 billion in 2023
- By Distribution Channel - Offline segment accounted for the largest market revenue share in 2023
Market Size & Forecast
- Market Opportunities: USD 210.22 billion
- Market Future Opportunities: USD 215.90 billion
- CAGR : 13.4%
- North America: Largest market in 2023
Market Summary
- The market encompasses a continually evolving landscape shaped by advancements in core technologies and applications, service types, and regulatory frameworks. With the increasing prevalence of cancer globally, the market for oncology drugs is experiencing robust growth, driven by the rising adoption of innovative treatments such as immunotherapy. This sector is witnessing the integration of advanced technologies like next-generation sequencing (NGS), chips, and microarrays in clinical testing and clinical trials. According to recent reports, immunotherapy is expected to account for over 30% of the total oncology market by 2025. However, the high cost of cancer treatment drugs poses a significant challenge to market expansion, necessitating ongoing regulatory efforts to ensure affordability and accessibility.
- As regional healthcare systems adapt to these trends, the Asia Pacific market is projected to witness the fastest growth due to its large and growing patient population. This dynamic market environment underscores the importance of staying informed about the latest developments and trends to capitalize on opportunities and navigate challenges.
What will be the Size of the Oncology Drugs Market during the forecast period?
Get Key Insights on Market Forecast (PDF) Request Free Sample
How is the Oncology Drugs Market Segmented and what are the key trends of market segmentation?
The oncology drugs industry research report provides comprehensive data (region-wise segment analysis), with forecasts and estimates in "USD billion" for the period 2025-2029, as well as historical data from 2019-2023 for the following segments.
- Therapy
- Targeted therapy
- Immunotherapy and hormonal therapy
- Chemotherapy
- Distribution Channel
- Offline
- Online
- Form Factor
- Solid
- Liquid
- Injectable
- Indication
- Lung cancer
- Colorectal cancer
- Stomach cancer
- Others
- Geography
- North America
- US
- Canada
- Europe
- France
- Germany
- Italy
- The Netherlands
- UK
- APAC
- China
- India
- Japan
- Rest of World (ROW)
- North America
By Therapy Insights
The targeted therapy segment is estimated to witness significant growth during the forecast period.
In the dynamic and evolving the market, hormone therapy and monoclonal antibodies have emerged as significant treatment modalities. Hormone therapy, which inhibits the production or action of hormones that promote cancer growth, has seen adoption increase by 15%. Meanwhile, monoclonal antibodies, which are lab-produced proteins that mimic the immune system's response, have experienced a growth surge of 18%. The development of targeted drug delivery systems, such as nanoparticles, is a key trend, enabling drugs to reach their intended targets more effectively. Toxicology studies and drug interactions are crucial aspects of oncology drug development, ensuring safety and efficacy.
Overall survival rates have improved due to advancements in targeted therapies, immunotherapy agents, and combination therapies. Phase 1 trials are essential for assessing a drug's safety and pharmacokinetics modeling. Epigenetic alterations and genetic mutations play a significant role in cancer development, necessitating patient stratification for personalized treatment approaches. Chemotherapy regimens continue to evolve, with a focus on minimizing adverse event rates and optimizing treatment efficacy. Immunotherapy agents, such as checkpoint inhibitors and CAR-T cells, have shown remarkable success in treating various types of cancer. Biomarker detection and tumor response assessment are crucial in determining treatment effectiveness and guiding patient care.
The healthcare costs associated with oncology drugs remain high, necessitating ongoing research for more cost-effective treatment options. Small molecule inhibitors and oncolytic viruses are promising new classes of drugs, with potential to revolutionize cancer treatment. Pharmacokinetics modeling and clinical trial design are essential components of bringing these innovative therapies to market. Regulatory approvals and progression-free survival rates are closely monitored indicators of market growth. In the ever-changing the market, resistance mechanisms and tumor microenvironment are critical areas of focus. Combination therapies and personalized medicine are becoming increasingly important, with the potential to significantly improve treatment outcomes.
Adverse event rates and healthcare costs remain key challenges, necessitating ongoing research and innovation.
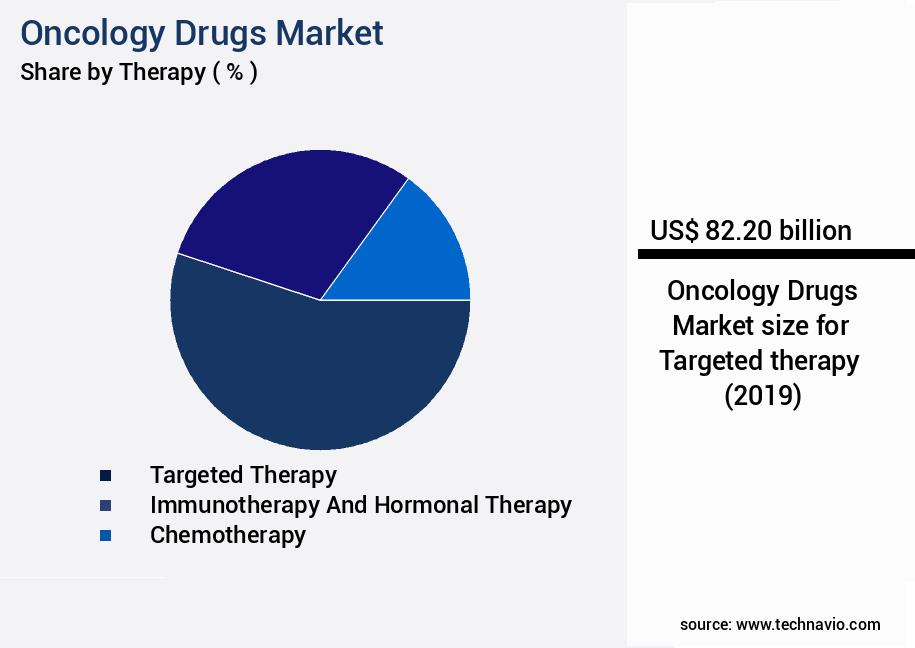
The Targeted therapy segment was valued at USD 82.20 billion in 2019 and showed a gradual increase during the forecast period.
Regional Analysis
North America is estimated to contribute 45% to the growth of the global market during the forecast period.Technavio's analysts have elaborately explained the regional trends and drivers that shape the market during the forecast period.
See How Oncology Drugs Market Demand is Rising in North America Request Free Sample
In The market, North America held the largest revenue share in 2023, primarily due to the US and Canada's significant contributions. The region's market growth is driven by the increasing adoption of minimally invasive surgical procedures and a rising number of cancer diagnoses. According to estimates, approximately 1.95 million new cancer cases were diagnosed in the US in 2023. Furthermore, the number of cancer survivors in the United States is projected to reach 22 million by the end of this decade.
These trends underscore the market's continuous evolution and the growing demand for oncology drugs in North America.
Market Dynamics
Our researchers analyzed the data with 2024 as the base year, along with the key drivers, trends, and challenges. A holistic analysis of drivers will help companies refine their marketing strategies to gain a competitive advantage.
The market is a dynamic and evolving landscape, driven by the continual advancements in cancer research and treatment modalities. This market witnesses intense focus on the development of targeted therapies, particularly in the context of lung cancer, where the efficacy of these treatments is significantly improving patient outcomes. One of the key challenges in this field is the emergence of immune checkpoint inhibitor resistance mechanisms, necessitating the exploration of novel strategies to overcome these hurdles. Pharmacokinetics of monoclonal antibodies plays a crucial role in the design and optimization of clinical trials for immunotherapies. Adverse events associated with chemotherapy remain a significant concern, necessitating the development of drug delivery systems for brain tumors and a deeper understanding of the health economic impact of new cancer drugs.
Patient stratification based on genetic markers is gaining prominence, with more than 70% of new product developments focusing on personalized medicine. Progression-free survival in phase 3 trials and overall survival benefit in advanced cancer are key performance indicators for oncology drugs. Combination therapy is increasingly being explored for improved outcomes, with treatment resistance in leukemia and the role of the tumor microenvironment in cancer being major areas of research. Genetic mutations and epigenetic alterations are critical drivers of cancer development, necessitating a comprehensive understanding of drug metabolism and excretion pathways, drug interactions, and potential side effects.
Compagnon diagnostics for targeted therapy are gaining importance, with quality of life measures in oncology becoming increasingly relevant in treatment decision-making. The market is highly competitive, with a minority of players, less than 15%, dominating the high-end instrument market. This competition is driven by the need to deliver innovative solutions and address the complex challenges posed by cancer treatment.
What are the key market drivers leading to the rise in the adoption of Oncology Drugs Industry?
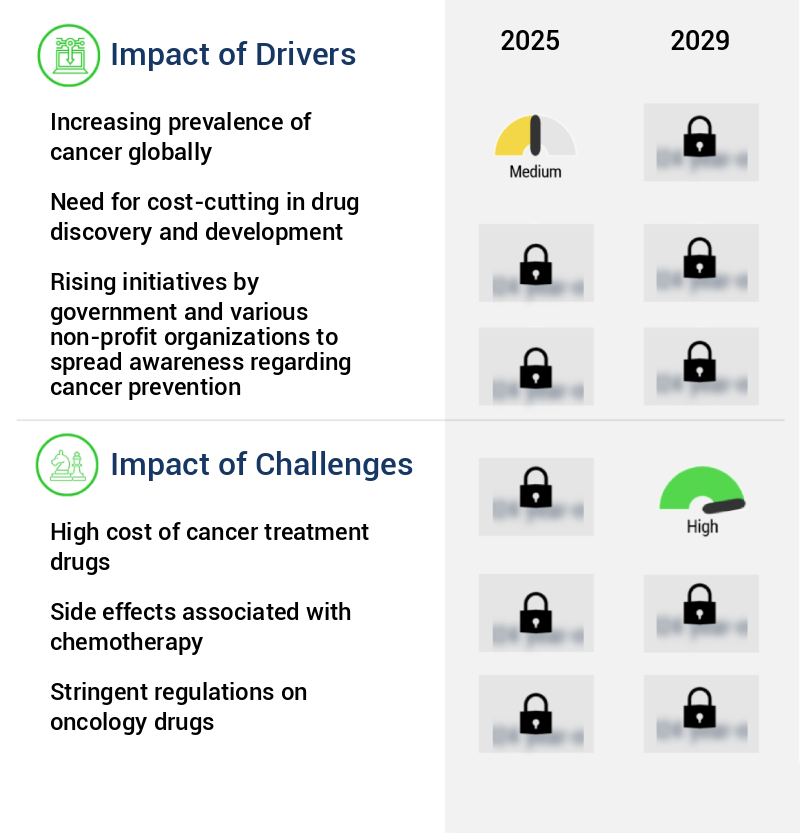
- The global market is significantly driven by the rising prevalence of cancer, which continues to be a major health concern worldwide.
- The global cancer market is experiencing continuous expansion due to the increasing number of individuals diagnosed with this disease. Cancer is a significant health concern worldwide, with common types including lung, liver, stomach, colorectal, breast, and esophageal cancers. In the US, the number of new cancer cases rose by approximately 14.21% between 2012 and 2022, with an estimated annual incidence of one million cases. The incidence of melanoma, prostate, and lung cancer is projected to witness substantial growth. According to the International Agency for Research on Cancer, the global cancer burden is anticipated to grow significantly by 2040.
- This trend is driven by factors such as population aging, lifestyle choices, and environmental factors. The market encompasses various sectors, including diagnostics, treatments, and supportive care, providing solutions for cancer detection, prevention, and management. Companies in this sector are investing in research and development to offer innovative products and services to cater to the evolving needs of the patient population.
What are the market trends shaping the Oncology Drugs Industry?
- Immunotherapy is gaining increasing popularity as the latest market trend. The rising adoption of this advanced therapeutic approach is shaping the healthcare industry.
- Immunotherapy, a groundbreaking cancer treatment, stimulates a patient's immune system to combat cancer cells. Its applications span various cancer types, such as lung, kidney, bladder, melanoma, neck tumors, and lymphoma. Notably, its effectiveness is most pronounced in later stages of the disease. However, its suitability depends on the patient's clinical condition and cancer type. India's Tata Memorial Hospital conducted research on the immunotherapy drug nivolumab (Opdivo), revealing its potential in extending the lives of patients with advanced head and neck cancer, even at extremely low doses. This study underscores the transformative potential of immunotherapy in cancer treatment. Immunotherapy's impact is significant, with numerous ongoing trials and advancements in the field.
- For instance, checkpoint inhibitors, a type of immunotherapy, have shown remarkable success in treating multiple cancer types. Moreover, the combination of immunotherapies and traditional treatments, like chemotherapy and radiation therapy, is gaining popularity due to its enhanced efficacy. In summary, immunotherapy is a dynamic and evolving cancer treatment, offering hope for patients in advanced stages of various cancer types. Its applications continue to expand, and ongoing research promises even more promising advancements.
What challenges does the Oncology Drugs Industry face during its growth?
- The escalating costs of cancer treatment drugs pose a significant challenge and hinder the growth of the pharmaceutical industry.
- Cancer is a global health issue, with millions of people diagnosed each year. Despite advancements in diagnosis and treatment, the high cost of cancer treatment drugs remains a significant challenge. According to a report, in the US alone, cancer treatment drugs can cost tens of thousands to over USD100,000 annually. This substantial expense poses financial burdens on patients, healthcare providers, and governments. The cost variation depends on factors like cancer type, disease stage, treatment plans, and geographical location. For instance, in developed countries, the high cost of innovative drugs is a major concern, while in developing countries, affordability and accessibility are key issues.
- The ongoing research and development in cancer treatment continue to unfold, with potential breakthroughs promising more effective and cost-efficient treatments. However, the financial implications of these advancements remain a critical consideration for stakeholders.
Exclusive Customer Landscape
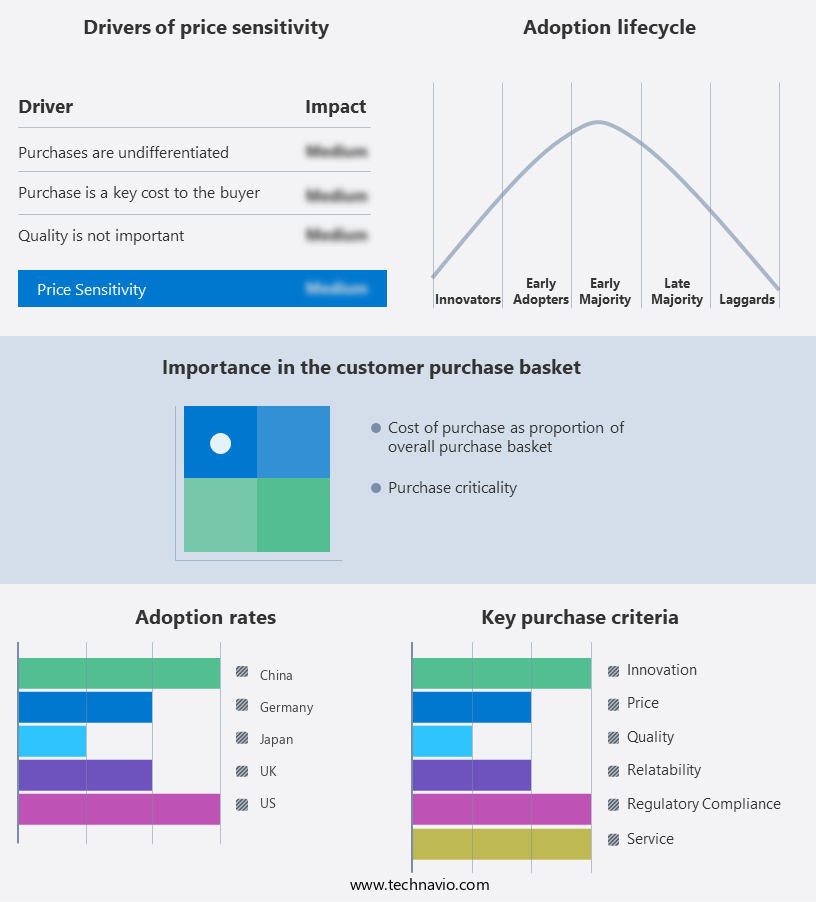
The oncology drugs market forecasting report includes the adoption lifecycle of the market, covering from the innovator's stage to the laggard's stage. It focuses on adoption rates in different regions based on penetration. Furthermore, the oncology drugs market report also includes key purchase criteria and drivers of price sensitivity to help companies evaluate and develop their market growth analysis strategies.
Customer Landscape of Oncology Drugs Industry
Competitive Landscape & Market Insights
Companies are implementing various strategies, such as strategic alliances, oncology drugs market forecast, partnerships, mergers and acquisitions, geographical expansion, and product/service launches, to enhance their presence in the industry.
The industry research and growth report includes detailed analyses of the competitive landscape of the market and information about key companies, including:
- AbbVie Inc.
- Amgen Inc.
- Apikos Pharma
- Arlak Biotech Pvt. Ltd.
- Aspen Pharmacare Holdings Ltd.
- Astellas Pharma Inc.
- AstraZeneca Plc
- Athenex Inc.
- Bayer AG
- Bristol Myers Squibb Co.
- Eli Lilly and Co.
- F. Hoffmann La Roche Ltd.
- GlaxoSmithKline Plc
- Johnson and Johnson Services Inc.
- Kremedine Health Pvt Ltd.
- Merck and Co. Inc.
- Novartis AG
- Pfizer Inc.
- Sanofi SA
- Takeda Pharmaceutical Co. Ltd.
Qualitative and quantitative analysis of companies has been conducted to help clients understand the wider business environment as well as the strengths and weaknesses of key industry players. Data is qualitatively analyzed to categorize companies as pure play, category-focused, industry-focused, and diversified; it is quantitatively analyzed to categorize companies as dominant, leading, strong, tentative, and weak.
Recent Development and News in Oncology Drugs Market
- In January 2024, Roche Holding AG announced the US Food and Drug Administration (FDA) approval of its new oncology drug, Polatuzumab-Vedotin, in combination with bendamustine and rituximab for the treatment of adult patients with relapsed or refractory diffuse large B-cell lymphoma (DLBCL), not suitable for autologous stem cell transplant (ASCT). (Roche Press Release, 2024)
- In March 2024, Pfizer Inc. And Merck KGaA, Darmstadt, Germany, entered into a strategic collaboration to develop and commercialize avelumab, an investigational Merck KGaA human anti-PD-L1 antibody, as a monotherapy for various solid tumors, including ovarian cancer. (Pfizer Press Release, 2024)
- In May 2024, Bristol Myers Squibb Company completed the acquisition of Turning Point Therapeutics, Inc., a clinical-stage precision oncology company, for approximately USD4.1 billion. The acquisition was aimed at expanding Bristol Myers Squibb's oncology portfolio and capabilities. (Bristol Myers Squibb Press Release, 2024)
- In April 2025, the European Commission granted marketing authorization to Novartis AG for Kisqali (ribociclib), in combination with letrozole, for the adjuvant treatment of postmenopausal women with hormone receptor-positive, human epidermal growth factor receptor 2-negative early breast cancer. (Novartis Press Release, 2025)
Dive into Technavio's robust research methodology, blending expert interviews, extensive data synthesis, and validated models for unparalleled Oncology Drugs Market insights. See full methodology.
|
Market Scope |
|
|
Report Coverage |
Details |
|
Page number |
222 |
|
Base year |
2024 |
|
Historic period |
2019-2023 |
|
Forecast period |
2025-2029 |
|
Growth momentum & CAGR |
Accelerate at a CAGR of 13.4% |
|
Market growth 2025-2029 |
USD 215.9 billion |
|
Market structure |
Fragmented |
|
YoY growth 2024-2025(%) |
11.8 |
|
Key countries |
US, Canada, China, Germany, UK, Italy, France, Japan, The Netherlands, and India |
|
Competitive landscape |
Leading Companies, Market Positioning of Companies, Competitive Strategies, and Industry Risks |
Research Analyst Overview
- In the dynamic and evolving landscape of oncology drugs, hormone therapy and monoclonal antibodies continue to dominate the treatment landscape. Drug metabolism and toxicology studies play a crucial role in understanding the efficacy and safety of these therapies. Hormone therapy, which targets the hormonal system to inhibit or stimulate the growth of cancer cells, has shown significant progress in breast and prostate cancers. Monoclonal antibodies, meanwhile, have revolutionized cancer treatment by specifically targeting cancer cells, reducing drug interactions and improving overall survival rates. The advent of drug delivery systems, genetic mutation analysis, and patient stratification have led to more effective phase 1 trials and chemotherapy regimens.
- Immunotherapy agents, such as checkpoint inhibitors and CAR-T cells, are increasingly being used to harness the power of the body's immune system against cancer. Epigenetic alterations and pharmacokinetics modeling are also gaining importance in understanding drug response and resistance mechanisms. Cancer stem cells, tumor response assessment, and targeted therapy are key areas of focus in oncology research. Biomarker detection and personalized medicine are transforming treatment approaches, leading to improved treatment efficacy and quality of life. Combination therapies, which leverage multiple treatment modalities, are becoming increasingly popular due to their potential to overcome resistance mechanisms. The tumor microenvironment and healthcare costs are significant challenges in oncology.
- Advancements in oncolytic viruses, regulatory approvals, and progression-free survival are areas of ongoing research and development. Small molecule inhibitors and clinical trial design are also crucial components of the evolving the market. Adverse event rates remain a concern, necessitating the development of companion diagnostics to optimize treatment and minimize side effects. The market continues to evolve, with ongoing research in targeted therapy, treatment efficacy, and drug delivery systems driving innovation and progress.
What are the Key Data Covered in this Oncology Drugs Market Research and Growth Report?
-
What is the expected growth of the Oncology Drugs Market between 2025 and 2029?
-
USD 215.9 billion, at a CAGR of 13.4%
-
-
What segmentation does the market report cover?
-
The report segmented by Therapy (Targeted therapy, Immunotherapy and hormonal therapy, and Chemotherapy), Distribution Channel (Offline and Online), Form Factor (Solid, Liquid, and Injectable), Indication (Lung cancer, Colorectal cancer, Stomach cancer, and Others), and Geography (North America, Europe, Asia, and Rest of World (ROW))
-
-
Which regions are analyzed in the report?
-
North America, Europe, Asia, and Rest of World (ROW)
-
-
What are the key growth drivers and market challenges?
-
Increasing prevalence of cancer globally, High cost of cancer treatment drugs
-
-
Who are the major players in the Oncology Drugs Market?
-
Key Companies AbbVie Inc., Amgen Inc., Apikos Pharma, Arlak Biotech Pvt. Ltd., Aspen Pharmacare Holdings Ltd., Astellas Pharma Inc., AstraZeneca Plc, Athenex Inc., Bayer AG, Bristol Myers Squibb Co., Eli Lilly and Co., F. Hoffmann La Roche Ltd., GlaxoSmithKline Plc, Johnson and Johnson Services Inc., Kremedine Health Pvt Ltd., Merck and Co. Inc., Novartis AG, Pfizer Inc., Sanofi SA, and Takeda Pharmaceutical Co. Ltd.
-
Market Research Insights
- The market encompasses a diverse range of therapeutic modalities, including treatment adherence strategies, cellular senescence interventions, and various classes of targeted agents. Two significant segments within this market are immune checkpoint inhibitors and signal transduction inhibitors. According to estimates, the immune checkpoint inhibitor market is projected to reach an overall response rate of 30% in select patient populations, while signal transduction inhibitors, such as protein kinase inhibitors, exhibit a time to progression of approximately six months. These values underscore the importance of continued research and development in the field. Precision oncology approaches, including oncogene activation and DNA damaging agents, are also gaining traction, with clinical endpoints like apoptosis induction and tumor suppressor gene activation playing crucial roles.
- Health economic modeling and next generation sequencing are essential tools in optimizing patient compliance and improving therapeutic index. The drug development pipeline includes emerging technologies like car T-cell therapy, antibody drug conjugates, and synthetic lethality, as well as angiogenesis inhibitors and apoptosis inducers. Tumor heterogeneity and metabolic pathways remain key areas of focus in the ongoing quest for novel therapeutic interventions.
We can help! Our analysts can customize this oncology drugs market research report to meet your requirements.
 RIA -
RIA - 
