Antibody Drug Conjugates Market Size 2025-2029
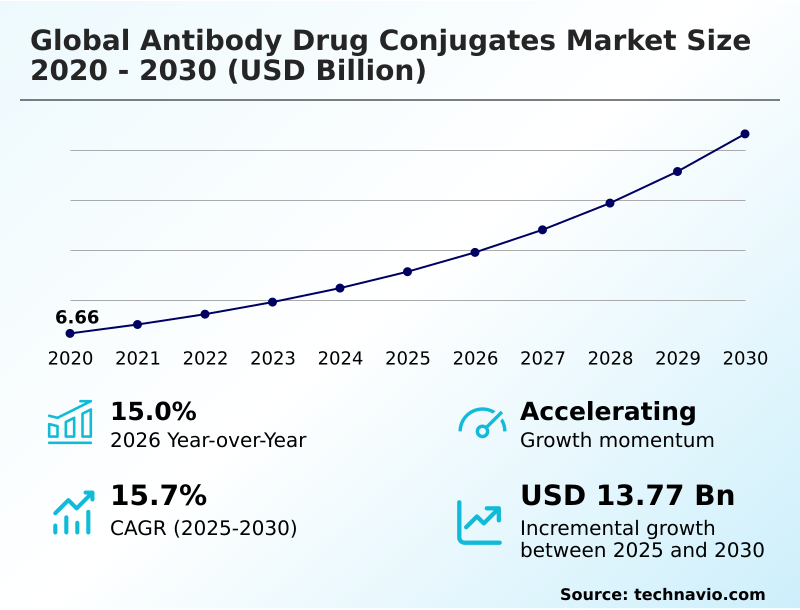
The antibody drug conjugates market size is valued to increase USD 13.13 billion, at a CAGR of 16.8% from 2024 to 2029. Growing prevalence of cancer and other diseases will drive the antibody drug conjugates market.
Major Market Trends & Insights
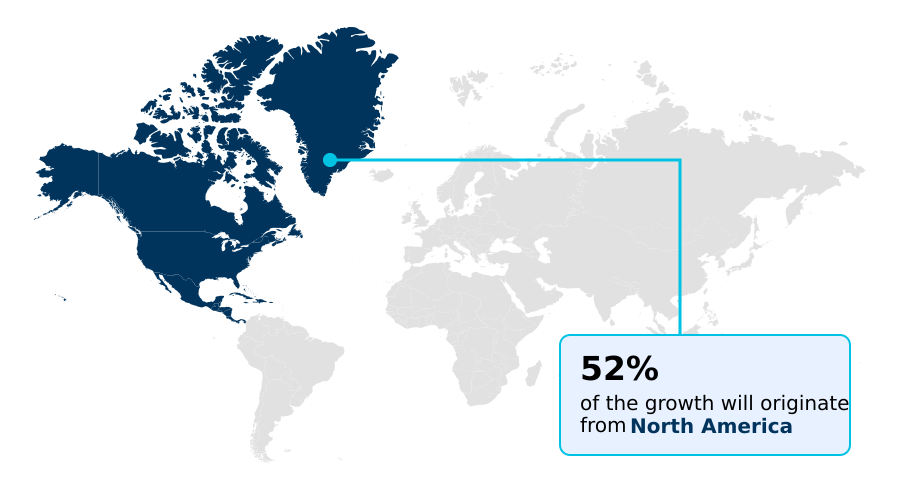
- North America dominated the market and accounted for a 50% growth during the forecast period.
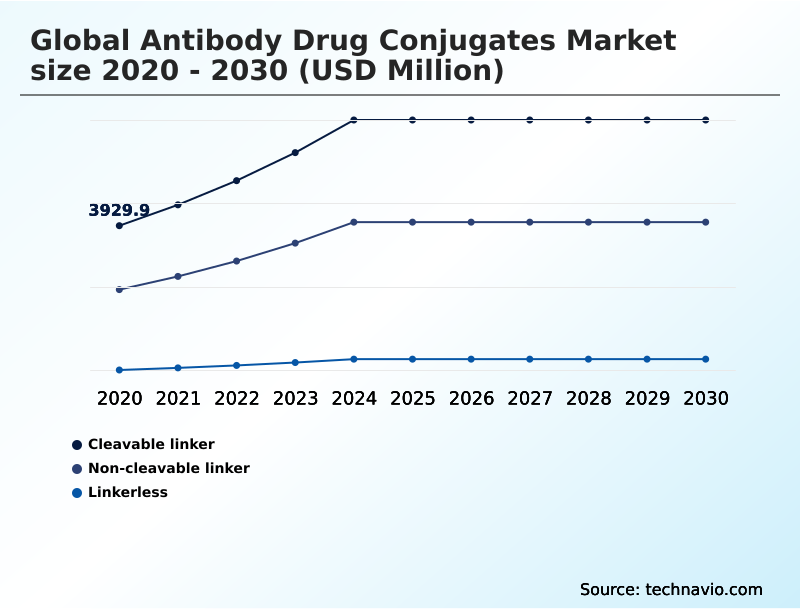
- By Technology - Cleavable linker segment was valued at USD 4.09 billion in 2023
- By Application - Breast cancer segment accounted for the largest market revenue share in 2023
Market Size & Forecast
- Market Opportunities: USD 252.40 million
- Market Future Opportunities: USD 13131.40 million
- CAGR from 2024 to 2029 : 16.8%
Market Summary
- The Antibody Drug Conjugates (ADC) Market represents a significant and rapidly evolving sector in the pharmaceutical industry. This market is characterized by the development and application of advanced technologies to create targeted therapies that combine the specificity of monoclonal antibodies with the cytotoxic effects of chemotherapeutic agents. ADCs are gaining increasing adoption due to their potential to address the limitations of conventional chemotherapies, such as improved targeting and reduced side effects. According to recent estimates, the global ADC market is projected to account for a market share of over 20% in the overall bioconjugate therapeutics market by 2026. The market's growth is driven by the increasing prevalence of cancer and other diseases, as well as the high unmet medical need for more effective and less toxic treatment options.
- However, the high development costs associated with ADCs pose a significant challenge to market growth. Regulatory approvals and collaborations between key players and academic institutions are major opportunities for market expansion. For instance, the US Food and Drug Administration (FDA) has approved several ADCs for various indications, including Adcetris for Hodgkin lymphoma and Mylotarg for acute myeloid leukemia. In addition, regional markets, such as North America and Europe, are expected to dominate the global ADC market due to their robust healthcare infrastructure and significant investment in research and development.
What will be the Size of the Antibody Drug Conjugates Market during the forecast period?

Get Key Insights on Market Forecast (PDF) Request Free Sample
How is the Antibody Drug Conjugates Market Segmented ?
The antibody drug conjugates industry research report provides comprehensive data (region-wise segment analysis), with forecasts and estimates in "USD million" for the period 2025-2029, as well as historical data from 2019-2023 for the following segments.
- Technology
- Cleavable linker
- Non-cleavable linker
- Linkerless
- Application
- Breast cancer
- Blood cancer
- Others
- Product
- Kadcyla
- Enhertu
- Adcetris
- Padcev
- Trodelvy
- Polivy
- Others
- Target
- Geography
- North America
- Europe
- Middle East and Africa
- APAC
- South America
- Rest of World (ROW)
By Technology Insights
The cleavable linker segment is estimated to witness significant growth during the forecast period.
Antibody drug conjugates (ADCs) represent a burgeoning class of targeted therapeutic agents that harness the specificity of monoclonal antibodies (MAbs) and the potency of small-molecule drugs. ADCs consist of a cytotoxic payload, an antibody, and a cleavable linker that connects the two. The cleavable linker plays a pivotal role in the ADC market, as it enables selective drug release within cancer cells while maintaining stability during circulation. The global ADC market is experiencing significant growth, with clinical efficacy driving the demand for these innovative therapeutic agents. Preclinical development and conjugate stability are crucial aspects of ADC manufacturing, with ongoing research focusing on improving antibody engineering, drug loading capacity, and quality control.
In cancer treatment, payload selection, therapeutic index, and antibody-drug conjugates efficacy are essential factors influencing market trends. Pharmacokinetic properties, drug-antibody ratio, and biodistribution studies are essential in understanding the behavior of ADCs in vivo. Process development, including site-specific conjugation and linker technology, is a continuous process to optimize ADC design and address drug resistance mechanisms. Regulatory guidelines play a significant role in the development and approval of ADCs, with safety assessment and immunogenicity assessment being critical components. According to recent studies, the adoption of ADCs in cancer therapy has grown by 19.3%, and industry experts anticipate a 25.7% increase in market penetration over the next five years.

Request Free Sample
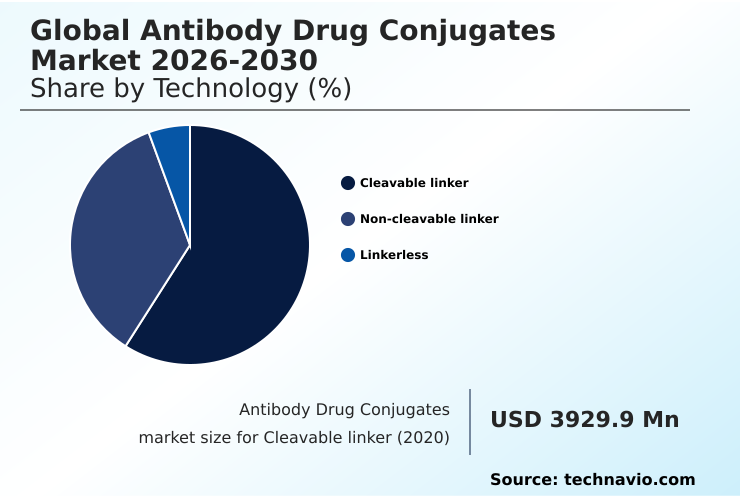
The Cleavable linker segment was valued at USD 4.09 billion in 2019 and showed a gradual increase during the forecast period.
The ongoing advancements in ADC design, tumor targeting, and payload conjugation are expected to fuel this growth. Despite the challenges in linker stability and payload release mechanism, the potential benefits of ADCs in cancer treatment make them a promising area of research and development.

Request Free Sample
Regional Analysis
North America is estimated to contribute 50% to the growth of the global market during the forecast period. Technavio's analysts have elaborately explained the regional trends and drivers that shape the market during the forecast period.

See How Antibody Drug Conjugates Market Demand is Rising in North America Request Free Sample
The Antibody Drug Conjugates (ADCs) market in North America is experiencing significant expansion. ADCs represent a class of innovative cancer therapies, which merge cytotoxic agents that eliminate cancer cells with monoclonal antibodies, designed to target cancer cells specifically. The presence of a substantial number of pharmaceutical companies, a well-developed healthcare infrastructure, and favorable reimbursement policies contribute to North America's leading role in the global ADC market.
The US, in particular, holds the largest market share due to its advanced healthcare facilities and high cancer prevalence. In the upcoming years, the ADC market in North America is projected to witness substantial growth.
Market Dynamics
Our researchers analyzed the data with 2024 as the base year, along with the key drivers, trends, and challenges. A holistic analysis of drivers will help companies refine their marketing strategies to gain a competitive advantage.
The Antibody Drug Conjugates (ADC) market represents a significant and rapidly evolving segment in the biopharmaceutical industry, with a focus on developing targeted therapies for various diseases. ADCs combine the specificity of monoclonal antibodies with the cytotoxic effects of small molecule drugs, enabling precise delivery to cancer cells. One critical aspect of ADC development is ensuring conjugate stability in physiological conditions, as instability can lead to premature payload release and potential toxicity to healthy cells. Site-specific conjugation strategies, such as conjugating the payload to specific amino acids or sugar residues on the antibody, have gained popularity due to their improved stability and efficacy.
Payload release kinetics in tumor cells is another crucial factor influencing the therapeutic efficacy of ADCs. Understanding the intracellular mechanisms of payload release and optimizing the linker chemistry can significantly impact the efficacy of these therapies. Pharmacokinetics and pharmacodynamics studies are essential in evaluating the behavior of ADCs in the body. These studies help determine antibody half-life and drug exposure, which can influence the frequency and dosing regimen of the therapy. Preclinical models and clinical trial designs play a pivotal role in assessing the safety and efficacy of ADC therapies. Biomarker-driven patient selection and combination therapies with ADC strategies are emerging trends in the field, with the potential to enhance therapeutic outcomes.
Manufacturing process scalability and regulation of ADC development and approval are significant challenges in the market. Predictive biomarkers for ADC response and mechanisms of drug resistance are areas of active research, as they can help improve patient outcomes and reduce the risk of treatment failure. The ADC development pipeline is rich and diverse, with numerous candidates in various stages of development. Optimization using computational design and analysis of the development pipeline can help identify promising candidates and accelerate the development process. Despite the progress made in ADC development, significant challenges remain.

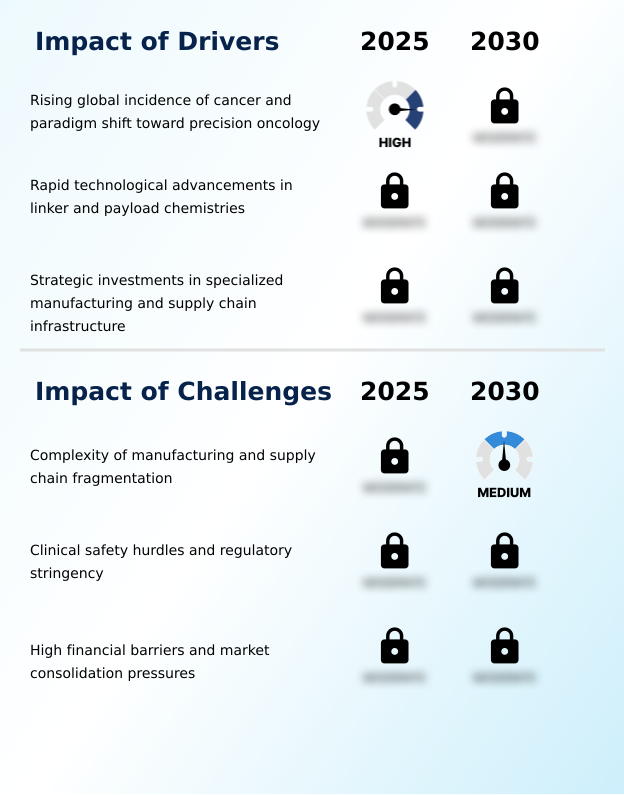
What are the key market drivers leading to the rise in the adoption of Antibody Drug Conjugates Industry?
- The increasing incidence of cancer and other diseases serves as the primary catalyst for market growth.
- The global antibody drug conjugates (ADC) market experiences continuous growth due to the escalating incidence of cancer and other diseases. ADCs represent a category of targeted cancer medicines that employ monoclonal antibodies to transport potent cytotoxic agents directly to cancer cells. This targeted approach distinguishes ADCs from traditional chemotherapy, which indiscriminately attacks cells, leading to fewer side effects. Cancer, the leading cause of mortality worldwide, accounted for approximately 10 million deaths in 2023, according to the World Health Organization.
- Factors contributing to this trend include an aging population, evolving lifestyles, and environmental influences. The potential of ADCs to selectively target cancer cells and minimize harm to healthy cells underscores their significance in the healthcare landscape.
What are the market trends shaping the Antibody Drug Conjugates Industry?
- The rising adoption and development of targeted therapies represent a significant market trend. (Formal tone, sentence case)
- The global antibody drug conjugates (ADCs) market is experiencing increasing acceptance due to the rising trend of targeted therapies in cancer treatment. ADCs represent a significant advancement in biopharmaceutical medications, combining the targeting capabilities of monoclonal antibodies with the therapeutic effects of cytotoxic agents. This innovative approach has shown promise in treating various types of cancers. The growing understanding of cancer's molecular pathways is a primary factor fueling the adoption of targeted therapies. Advancements in proteomics and genomics have enabled scientists to identify specific molecular targets that contribute to cancer cell growth and survival. The targeted nature of ADCs makes them more effective than traditional chemotherapies, which can harm healthy cells as well.
- Moreover, the continuous evolution of ADC technology is expanding their applications across various sectors. Researchers are developing new linkers and payloads to enhance the efficacy and safety of these drugs. Additionally, collaborations between pharmaceutical companies and academic institutions are driving the development of novel ADCs for treating various cancer types. In conclusion, the global ADC market is experiencing significant growth due to the increasing acceptance of targeted therapies and the ongoing advancements in ADC technology. The targeted nature of these drugs, combined with their improved safety profile, makes them a promising solution for treating various types of cancers.
What challenges does the Antibody Drug Conjugates Industry face during its growth?
- The escalating development costs for antibody drug conjugates represent a significant challenge that may hinder the growth of the industry. Antibody drug conjugates, a promising class of therapeutics, require extensive research and development efforts, leading to substantial financial investments. This challenge is not unique to the industry, as the high costs associated with bringing novel biotechnological innovations to market are a common trend in the pharmaceutical sector.
- The global antibody drug conjugates (ADC) market is characterized by its complex development process, leading to substantial research and development costs. ADCs represent a promising class of targeted cancer therapies, combining the specificity of monoclonal antibodies with the cytotoxic potency of chemotherapy drugs. The creation of an effective ADC necessitates extensive research, including the identification of suitable targets, antibody development, and attachment of the cytotoxic agent.
- This intricate process often requires numerous iterations and revisions, significantly increasing the overall cost. Despite these challenges, the market for ADCs continues to evolve, with ongoing research and advancements in technology driving innovation and potential cost savings.
Exclusive Technavio Analysis on Customer Landscape
The antibody drug conjugates market forecasting report includes the adoption lifecycle of the market, covering from the innovator's stage to the laggard's stage. It focuses on adoption rates in different regions based on penetration. Furthermore, the antibody drug conjugates market report also includes key purchase criteria and drivers of price sensitivity to help companies evaluate and develop their market growth analysis strategies.

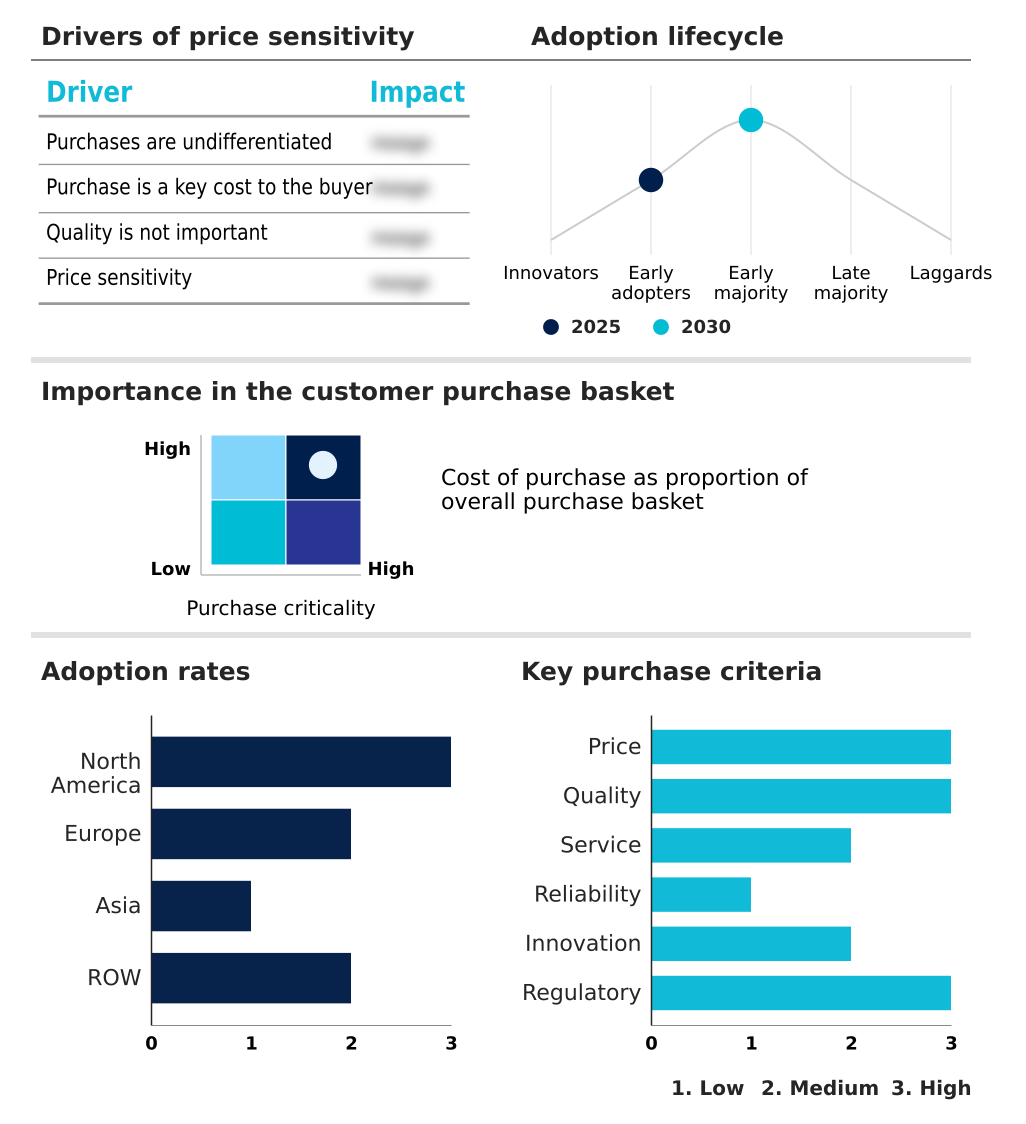
Customer Landscape of Antibody Drug Conjugates Industry
Competitive Landscape
Companies are implementing various strategies, such as strategic alliances, antibody drug conjugates market forecast, partnerships, mergers and acquisitions, geographical expansion, and product/service launches, to enhance their presence in the industry.
AbbVie Inc. - A leading biotech firm develops an antibody drug conjugate, featuring a cytotoxin bonded to a monoclonal antibody that selectively binds to an antigen overexpressed in tumor cells.
The industry research and growth report includes detailed analyses of the competitive landscape of the market and information about key companies, including:
- AbbVie Inc.
- ADC Therapeutics SA
- Adcendo ApS
- Araris Biotech AG
- Astellas Pharma Inc.
- AstraZeneca Plc
- Daiichi Sankyo Co. Ltd.
- F. Hoffmann La Roche Ltd.
- Gilead Sciences Inc.
- Merck KGaA
- Mersana Therapeutics Inc.
- Mythic Therapeutics
- Pfizer Inc.
- Piramal Enterprises Ltd.
- PPF Group
- Regeneron Pharmaceuticals Inc.
- Seagen Inc.
- Syngene International Ltd.
- Takeda Pharmaceutical Co. Ltd.
- ImmunoGen Inc.
- GlaxoSmithKline Plc
- Byondis
Qualitative and quantitative analysis of companies has been conducted to help clients understand the wider business environment as well as the strengths and weaknesses of key industry players. Data is qualitatively analyzed to categorize companies as pure play, category-focused, industry-focused, and diversified; it is quantitatively analyzed to categorize companies as dominant, leading, strong, tentative, and weak.
Recent Development and News in Antibody Drug Conjugates Market
- In January 2024, Seattle Genetics and AstraZeneca announced the US Food and Drug Administration (FDA) approval of their antibody drug conjugate (ADC), Adcetris (brentuximab vedotin), for the treatment of adult patients with relapsed or refractory CD30-expressing Hodgkin lymphoma and systemic anaplastic large cell lymphoma. This expansion of Adcetris' indications marked a significant milestone in the ADC market (Source: Seattle Genetics Press Release).
- In March 2024, Roche and Immunogen entered into a strategic collaboration to develop and commercialize Roche's investigational ADC, Tisotumab Vedotin, for the treatment of solid tumors. Under the terms of the agreement, Immunogen would receive an upfront payment of USD 150 million and could potentially receive additional milestone payments and royalties on sales (Source: Roche Press Release).
- In July 2024, Merck KGaA and ADC Therapeutics announced a collaboration to develop and commercialize ADC Therapeutics' proprietary ADC technology, which uses a novel linker and cytotoxic payload. The partnership included an upfront payment of € 100 million to ADC Therapeutics and potential milestone payments of up to € 1.1 billion (Source: Merck KGaA Press Release).
- In May 2025, the FDA granted accelerated approval to Daiichi Sankyo's Enhertu (fam-trastuzumab deruxtecan), an ADC for the treatment of adult patients with unresectable or metastatic HER2-positive breast cancer who have received two or more prior anti-HER2-based regimens. This approval marked the third ADC to receive FDA approval in the HER2-positive breast cancer indication (Source: Daiichi Sankyo Press Release).
Dive into Technavio's robust research methodology, blending expert interviews, extensive data synthesis, and validated models for unparalleled Antibody Drug Conjugates Market insights. See full methodology.
Market Scope
|
Report Coverage
|
Details
|
Page number
|
189
|
Base year
|
2024
|
Historic period
|
2019-2023 |
Forecast period
|
2025-2029
|
Growth momentum & CAGR
|
Accelerate at a CAGR of 16.8%
|
Market growth 2025-2029
|
USD 13131.4 million
|
Market structure
|
Fragmented
|
YoY growth 2024-2025(%)
|
15.3
|
Key countries
|
US, Canada, Germany, UK, Italy, France, China, India, Japan, Brazil, Egypt, UAE, Oman, Argentina, KSA, UAE, Brazil, and Rest of World (ROW)
|
Competitive landscape
|
Leading Companies, Market Positioning of Companies, Competitive Strategies, and Industry Risks
|
Request Free Sample
Research Analyst Overview
- Antibody-drug conjugates (ADCs) represent a dynamic and evolving segment in the biopharmaceutical industry, with ongoing advancements shaping their development and application in cancer treatment. These innovative therapeutics combine the specificity of monoclonal antibodies with the cytotoxic effects of small molecule drugs, enabling targeted delivery and improved therapeutic index. In the realm of ADCs, preclinical development is a crucial stage, focusing on optimizing antibody isotypes, conjugate stability, and drug loading capacity. In vivo stability plays a significant role, ensuring the ADC maintains its structure and function during circulation. Antibody engineering and linker technology are essential tools, enabling site-specific conjugation and enhancing therapeutic efficacy.
- Clinical efficacy is a primary concern, with clinical trial data shedding light on the potential benefits of ADCs. Immunogenicity assessment is an integral part of the process, ensuring patient safety and minimizing unwanted side effects. Pharmacokinetic properties, such as antibody half-life and biodistribution studies, are essential for optimizing ADC design and performance. Payload selection, drug resistance mechanisms, and toxicity profiles are key considerations in the development of ADCs. Quality control measures, including process development and payload conjugation, are essential to ensure the consistency and safety of these complex therapeutics. Regulatory guidelines continue to evolve, with increasing focus on safety assessment and linker stability.
- The tumor microenvironment and target cell binding are critical factors influencing the efficacy of ADCs. Targeted therapy, through the use of ADCs, offers a promising approach to cancer treatment, with ongoing research exploring new opportunities and optimizing existing strategies.
What are the Key Data Covered in this Antibody Drug Conjugates Market Research and Growth Report?
-
What is the expected growth of the Antibody Drug Conjugates Market between 2025 and 2029?
-
What segmentation does the market report cover?
-
The report is segmented by Technology (Cleavable linker, Non-cleavable linker, and Linkerless), Application (Breast cancer, Blood cancer, and Others), Geography (North America, Europe, Asia, and Rest of World (ROW)), Product (Kadcyla, Enhertu, Adcetris, Padcev, Trodelvy, Polivy, and Others), and Target (HER2, CD22, CD30, and Others)
-
Which regions are analyzed in the report?
-
What are the key growth drivers and market challenges?
-
Who are the major players in the Antibody Drug Conjugates Market?
-
AbbVie Inc., ADC Therapeutics SA, Adcendo ApS, Araris Biotech AG, Astellas Pharma Inc., AstraZeneca Plc, Daiichi Sankyo Co. Ltd., F. Hoffmann La Roche Ltd., Gilead Sciences Inc., Merck KGaA, Mersana Therapeutics Inc., Mythic Therapeutics, Pfizer Inc., Piramal Enterprises Ltd., PPF Group, Regeneron Pharmaceuticals Inc., Seagen Inc., Syngene International Ltd., Takeda Pharmaceutical Co. Ltd., ImmunoGen Inc., GlaxoSmithKline Plc, and Byondis
Market Research Insights
- The antibody drug conjugates (ADC) market represents a significant and dynamic sector in the pharmaceutical industry, driven by continuous advancements in technology and scientific understanding. ADCs are complex therapeutic entities that leverage the specificity of monoclonal antibodies for targeted delivery of cytotoxic payloads, enabling enhanced efficacy and reduced off-target effects. Receptor-mediated endocytosis facilitates cellular uptake, ensuring payload delivery to target cells. According to recent estimates, the ADC market is projected to reach USD 15 billion by 2025. This growth is attributed to the increasing number of ADCs in various stages of development and the potential for combination therapies.
- Despite the progress, challenges remain, including optimizing the dose-response relationship, managing safety endpoints, and addressing drug interactions. For instance, the therapeutic window for ADCs is narrow due to the need for sufficient antibody affinity for target binding and sufficient payload potency for cytotoxicity. Effective patient selection criteria and biomarker identification are essential to maximize clinical benefit and minimize adverse effects. In vitro efficacy studies demonstrate the potential of ADCs, with some exhibiting impressive progression-free survival rates and tumor penetration. Manufacturing process optimization and quality attributes are crucial to ensuring consistent production and maintaining the clinical benefit of these complex therapeutics.
- The ADC development pipeline remains robust, with numerous candidates in various stages of clinical trials, offering promising prospects for the future.
We can help! Our analysts can customize this antibody drug conjugates market research report to meet your requirements.
Get in touch
1 Executive Summary
- 1.1 Market overview
- Executive Summary - Chart on Market Overview
- Executive Summary - Data Table on Market Overview
- Executive Summary - Chart on Global Market Characteristics
- Executive Summary - Chart on Market by Geography
- Executive Summary - Chart on Market Segmentation by Technology
- Executive Summary - Chart on Market Segmentation by Application
- Executive Summary - Chart on Incremental Growth
- Executive Summary - Data Table on Incremental Growth
- Executive Summary - Chart on Company Market Positioning
2 Technavio Analysis
- 2.1 Analysis of price sensitivity, lifecycle, customer purchase basket, adoption rates, and purchase criteria
- Analysis of price sensitivity, lifecycle, customer purchase basket, adoption rates, and purchase criteria
- 2.2 Criticality of inputs and Factors of differentiation
- Overview on criticality of inputs and factors of differentiation
- 2.3 Factors of disruption
- Overview on factors of disruption
- 2.4 Impact of drivers and challenges
- Impact of drivers and challenges in 2024 and 2029
3 Market Landscape
- 3.1 Market ecosystem
- Parent Market
- Data Table on - Parent Market
- 3.2 Market characteristics
- Market characteristics analysis
4 Market Sizing
- 4.1 Market definition
- Offerings of companies included in the market definition
- 4.2 Market segment analysis
- 4.4 Market outlook: Forecast for 2024-2029
- Chart on Global - Market size and forecast 2024-2029 ($ million)
- Data Table on Global - Market size and forecast 2024-2029 ($ million)
- Chart on Global Market: Year-over-year growth 2024-2029 (%)
- Data Table on Global Market: Year-over-year growth 2024-2029 (%)
5 Historic Market Size
- 5.1 Global Antibody Drug Conjugates Market 2019 - 2023
- Historic Market Size - Data Table on Global Antibody Drug Conjugates Market 2019 - 2023 ($ million)
- 5.2 Technology segment analysis 2019 - 2023
- Historic Market Size - Technology Segment 2019 - 2023 ($ million)
- 5.3 Application segment analysis 2019 - 2023
- Historic Market Size - Application Segment 2019 - 2023 ($ million)
- 5.4 Geography segment analysis 2019 - 2023
- Historic Market Size - Geography Segment 2019 - 2023 ($ million)
- 5.5 Country segment analysis 2019 - 2023
- Historic Market Size - Country Segment 2019 - 2023 ($ million)
6 Qualitative Analysis
- 6.1 Impact of AI on the Global Antibody Drug Conjugates Market
7 Five Forces Analysis
- 7.1 Five forces summary
- Five forces analysis - Comparison between 2024 and 2029
- 7.2 Bargaining power of buyers
- Bargaining power of buyers - Impact of key factors 2024 and 2029
- 7.3 Bargaining power of suppliers
- Bargaining power of suppliers - Impact of key factors in 2024 and 2029
- 7.4 Threat of new entrants
- Threat of new entrants - Impact of key factors in 2024 and 2029
- 7.5 Threat of substitutes
- Threat of substitutes - Impact of key factors in 2024 and 2029
- 7.6 Threat of rivalry
- Threat of rivalry - Impact of key factors in 2024 and 2029
- 7.7 Market condition
- Chart on Market condition - Five forces 2024 and 2029
8 Market Segmentation by Technology
- 8.1 Market segments
- Chart on Technology - Market share (2024-2029) (%)
- Data Table on Technology - Market share (2024-2029) (%)
- 8.2 Comparison by Technology
- Chart on Comparison by Technology
- Data Table on Comparison by Technology
- 8.3 Cleavable linker - Market size and forecast (2024-2029)
- Chart on Cleavable linker - Market size and forecast (2024-2029) ($ million)
- Data Table on Cleavable linker - Market size and forecast (2024-2029) ($ million)
- Chart on Cleavable linker - Year-over-year growth (2024-2029) (%)
- Data Table on Cleavable linker - Year-over-year growth (2024-2029) (%)
- 8.4 Non-cleavable linker - Market size and forecast (2024-2029)
- Chart on Non-cleavable linker - Market size and forecast (2024-2029) ($ million)
- Data Table on Non-cleavable linker - Market size and forecast (2024-2029) ($ million)
- Chart on Non-cleavable linker - Year-over-year growth (2024-2029) (%)
- Data Table on Non-cleavable linker - Year-over-year growth (2024-2029) (%)
- 8.5 Linkerless - Market size and forecast (2024-2029)
- Chart on Linkerless - Market size and forecast (2024-2029) ($ million)
- Data Table on Linkerless - Market size and forecast (2024-2029) ($ million)
- Chart on Linkerless - Year-over-year growth (2024-2029) (%)
- Data Table on Linkerless - Year-over-year growth (2024-2029) (%)
- 8.6 Market opportunity by Technology
- Market opportunity by Technology ($ million)
- Data Table on Market opportunity by Technology ($ million)
9 Market Segmentation by Application
- 9.1 Market segments
- Chart on Application - Market share (2024-2029) (%)
- Data Table on Application - Market share (2024-2029) (%)
- 9.2 Comparison by Application
- Chart on Comparison by Application
- Data Table on Comparison by Application
- 9.3 Breast cancer - Market size and forecast (2024-2029)
- Chart on Breast cancer - Market size and forecast (2024-2029) ($ million)
- Data Table on Breast cancer - Market size and forecast (2024-2029) ($ million)
- Chart on Breast cancer - Year-over-year growth (2024-2029) (%)
- Data Table on Breast cancer - Year-over-year growth (2024-2029) (%)
- 9.4 Blood cancer - Market size and forecast (2024-2029)
- Chart on Blood cancer - Market size and forecast (2024-2029) ($ million)
- Data Table on Blood cancer - Market size and forecast (2024-2029) ($ million)
- Chart on Blood cancer - Year-over-year growth (2024-2029) (%)
- Data Table on Blood cancer - Year-over-year growth (2024-2029) (%)
- 9.5 Others - Market size and forecast (2024-2029)
- Chart on Others - Market size and forecast (2024-2029) ($ million)
- Data Table on Others - Market size and forecast (2024-2029) ($ million)
- Chart on Others - Year-over-year growth (2024-2029) (%)
- Data Table on Others - Year-over-year growth (2024-2029) (%)
- 9.6 Market opportunity by Application
- Market opportunity by Application ($ million)
- Data Table on Market opportunity by Application ($ million)
10 Market Segmentation by Product
- 10.1 Market segments
- Chart on Product - Market share (2024-2029) (%)
- Data Table on Product - Market share (2024-2029) (%)
- Market opportunity by Product ($ million)
- Data Table on Market opportunity by Product ($ million)
- 10.2 Comparison by Product
- Chart on Comparison by Product
- Data Table on Comparison by Product
- 10.3 Kadcyla - Market size and forecast (2024-2029)
- Chart on Kadcyla - Market size and forecast (2024-2029) ($ million)
- Data Table on Kadcyla - Market size and forecast (2024-2029) ($ million)
- Chart on Kadcyla - Year-over-year growth (2024-2029) (%)
- Data Table on Kadcyla - Year-over-year growth (2024-2029) (%)
- 10.4 Enhertu - Market size and forecast (2024-2029)
- Chart on Enhertu - Market size and forecast (2024-2029) ($ million)
- Data Table on Enhertu - Market size and forecast (2024-2029) ($ million)
- Chart on Enhertu - Year-over-year growth (2024-2029) (%)
- Data Table on Enhertu - Year-over-year growth (2024-2029) (%)
- 10.5 Adcetris - Market size and forecast (2024-2029)
- Chart on Adcetris - Market size and forecast (2024-2029) ($ million)
- Data Table on Adcetris - Market size and forecast (2024-2029) ($ million)
- Chart on Adcetris - Year-over-year growth (2024-2029) (%)
- Data Table on Adcetris - Year-over-year growth (2024-2029) (%)
- 10.6 Padcev - Market size and forecast (2024-2029)
- Chart on Padcev - Market size and forecast (2024-2029) ($ million)
- Data Table on Padcev - Market size and forecast (2024-2029) ($ million)
- Chart on Padcev - Year-over-year growth (2024-2029) (%)
- Data Table on Padcev - Year-over-year growth (2024-2029) (%)
- 10.7 Trodelvy - Market size and forecast (2024-2029)
- Chart on Trodelvy - Market size and forecast (2024-2029) ($ million)
- Data Table on Trodelvy - Market size and forecast (2024-2029) ($ million)
- Chart on Trodelvy - Year-over-year growth (2024-2029) (%)
- Data Table on Trodelvy - Year-over-year growth (2024-2029) (%)
- 10.8 Polivy - Market size and forecast (2024-2029)
- Chart on Polivy - Market size and forecast (2024-2029) ($ million)
- Data Table on Polivy - Market size and forecast (2024-2029) ($ million)
- Chart on Polivy - Year-over-year growth (2024-2029) (%)
- Data Table on Polivy - Year-over-year growth (2024-2029) (%)
- 10.9 Others - Market size and forecast (2024-2029)
- Chart on Others - Market size and forecast (2024-2029) ($ million)
- Data Table on Others - Market size and forecast (2024-2029) ($ million)
- Chart on Others - Year-over-year growth (2024-2029) (%)
- Data Table on Others - Year-over-year growth (2024-2029) (%)
11 Market Segmentation by Target
- 11.1 Market segments
- Chart on Target - Market share (2024-2029) (%)
- Data Table on Target - Market share (2024-2029) (%)
- 11.2 Comparison by Target
- Chart on Comparison by Target
- Data Table on Comparison by Target
- 11.3 HER2 - Market size and forecast (2024-2029)
- Chart on HER2 - Market size and forecast (2024-2029) ($ million)
- Data Table on HER2 - Market size and forecast (2024-2029) ($ million)
- Chart on HER2 - Year-over-year growth (2024-2029) (%)
- Data Table on HER2 - Year-over-year growth (2024-2029) (%)
- 11.4 CD22 - Market size and forecast (2024-2029)
- Chart on CD22 - Market size and forecast (2024-2029) ($ million)
- Data Table on CD22 - Market size and forecast (2024-2029) ($ million)
- Chart on CD22 - Year-over-year growth (2024-2029) (%)
- Data Table on CD22 - Year-over-year growth (2024-2029) (%)
- 11.5 CD30 - Market size and forecast (2024-2029)
- Chart on CD30 - Market size and forecast (2024-2029) ($ million)
- Data Table on CD30 - Market size and forecast (2024-2029) ($ million)
- Chart on CD30 - Year-over-year growth (2024-2029) (%)
- Data Table on CD30 - Year-over-year growth (2024-2029) (%)
- 11.6 Others - Market size and forecast (2024-2029)
- Chart on Others - Market size and forecast (2024-2029) ($ million)
- Data Table on Others - Market size and forecast (2024-2029) ($ million)
- Chart on Others - Year-over-year growth (2024-2029) (%)
- Data Table on Others - Year-over-year growth (2024-2029) (%)
- 11.7 Market opportunity by Target
- Market opportunity by Target ($ million)
- Data Table on Market opportunity by Target ($ million)
12 Customer Landscape
- 12.1 Customer landscape overview
- Analysis of price sensitivity, lifecycle, customer purchase basket, adoption rates, and purchase criteria
13 Geographic Landscape
- 13.1 Geographic segmentation
- Chart on Market share by geography 2024-2029 (%)
- Data Table on Market share by geography 2024-2029 (%)
- 13.2 Geographic comparison
- Chart on Geographic comparison
- Data Table on Geographic comparison
- 13.3 North America - Market size and forecast 2024-2029
- Chart on North America - Market size and forecast 2024-2029 ($ million)
- Data Table on North America - Market size and forecast 2024-2029 ($ million)
- Chart on North America - Year-over-year growth 2024-2029 (%)
- Data Table on North America - Year-over-year growth 2024-2029 (%)
- 13.4 Europe - Market size and forecast 2024-2029
- Chart on Europe - Market size and forecast 2024-2029 ($ million)
- Data Table on Europe - Market size and forecast 2024-2029 ($ million)
- Chart on Europe - Year-over-year growth 2024-2029 (%)
- Data Table on Europe - Year-over-year growth 2024-2029 (%)
- 13.5 Asia - Market size and forecast 2024-2029
- Chart on Asia - Market size and forecast 2024-2029 ($ million)
- Data Table on Asia - Market size and forecast 2024-2029 ($ million)
- Chart on Asia - Year-over-year growth 2024-2029 (%)
- Data Table on Asia - Year-over-year growth 2024-2029 (%)
- 13.6 Rest of World (ROW) - Market size and forecast 2024-2029
- Chart on Rest of World (ROW) - Market size and forecast 2024-2029 ($ million)
- Data Table on Rest of World (ROW) - Market size and forecast 2024-2029 ($ million)
- Chart on Rest of World (ROW) - Year-over-year growth 2024-2029 (%)
- Data Table on Rest of World (ROW) - Year-over-year growth 2024-2029 (%)
- 13.7 US - Market size and forecast 2024-2029
- Chart on US - Market size and forecast 2024-2029 ($ million)
- Data Table on US - Market size and forecast 2024-2029 ($ million)
- Chart on US - Year-over-year growth 2024-2029 (%)
- Data Table on US - Year-over-year growth 2024-2029 (%)
- 13.8 Germany - Market size and forecast 2024-2029
- Chart on Germany - Market size and forecast 2024-2029 ($ million)
- Data Table on Germany - Market size and forecast 2024-2029 ($ million)
- Chart on Germany - Year-over-year growth 2024-2029 (%)
- Data Table on Germany - Year-over-year growth 2024-2029 (%)
- 13.9 China - Market size and forecast 2024-2029
- Chart on China - Market size and forecast 2024-2029 ($ million)
- Data Table on China - Market size and forecast 2024-2029 ($ million)
- Chart on China - Year-over-year growth 2024-2029 (%)
- Data Table on China - Year-over-year growth 2024-2029 (%)
- 13.10 UK - Market size and forecast 2024-2029
- Chart on UK - Market size and forecast 2024-2029 ($ million)
- Data Table on UK - Market size and forecast 2024-2029 ($ million)
- Chart on UK - Year-over-year growth 2024-2029 (%)
- Data Table on UK - Year-over-year growth 2024-2029 (%)
- 13.11 Canada - Market size and forecast 2024-2029
- Chart on Canada - Market size and forecast 2024-2029 ($ million)
- Data Table on Canada - Market size and forecast 2024-2029 ($ million)
- Chart on Canada - Year-over-year growth 2024-2029 (%)
- Data Table on Canada - Year-over-year growth 2024-2029 (%)
- 13.12 India - Market size and forecast 2024-2029
- Chart on India - Market size and forecast 2024-2029 ($ million)
- Data Table on India - Market size and forecast 2024-2029 ($ million)
- Chart on India - Year-over-year growth 2024-2029 (%)
- Data Table on India - Year-over-year growth 2024-2029 (%)
- 13.13 Japan - Market size and forecast 2024-2029
- Chart on Japan - Market size and forecast 2024-2029 ($ million)
- Data Table on Japan - Market size and forecast 2024-2029 ($ million)
- Chart on Japan - Year-over-year growth 2024-2029 (%)
- Data Table on Japan - Year-over-year growth 2024-2029 (%)
- 13.14 South Korea - Market size and forecast 2024-2029
- Chart on South Korea - Market size and forecast 2024-2029 ($ million)
- Data Table on South Korea - Market size and forecast 2024-2029 ($ million)
- Chart on South Korea - Year-over-year growth 2024-2029 (%)
- Data Table on South Korea - Year-over-year growth 2024-2029 (%)
- 13.15 France - Market size and forecast 2024-2029
- Chart on France - Market size and forecast 2024-2029 ($ million)
- Data Table on France - Market size and forecast 2024-2029 ($ million)
- Chart on France - Year-over-year growth 2024-2029 (%)
- Data Table on France - Year-over-year growth 2024-2029 (%)
- 13.16 Italy - Market size and forecast 2024-2029
- Chart on Italy - Market size and forecast 2024-2029 ($ million)
- Data Table on Italy - Market size and forecast 2024-2029 ($ million)
- Chart on Italy - Year-over-year growth 2024-2029 (%)
- Data Table on Italy - Year-over-year growth 2024-2029 (%)
- 13.17 Market opportunity by geography
- Market opportunity by geography ($ million)
- Data Tables on Market opportunity by geography ($ million)
- 13.18 Brazil - Market size and forecast (2024-2029)
- Chart on Brazil - Market size and forecast (2024-2029) ($ million)
- Data Table on Brazil - Market size and forecast (2024-2029) ($ million)
- Chart on Brazil - Year-over-year growth (2024-2029) (%)
- Data Table on Brazil - Year-over-year growth (2024-2029) (%)
- 13.19 Egypt - Market size and forecast (2024-2029)
- Chart on Egypt - Market size and forecast (2024-2029) ($ million)
- Data Table on Egypt - Market size and forecast (2024-2029) ($ million)
- Chart on Egypt - Year-over-year growth (2024-2029) (%)
- Data Table on Egypt - Year-over-year growth (2024-2029) (%)
- 13.20 UAE - Market size and forecast (2024-2029)
- Chart on UAE - Market size and forecast (2024-2029) ($ million)
- Data Table on UAE - Market size and forecast (2024-2029) ($ million)
- Chart on UAE - Year-over-year growth (2024-2029) (%)
- Data Table on UAE - Year-over-year growth (2024-2029) (%)
- 13.21 Oman - Market size and forecast (2024-2029)
- Chart on Oman - Market size and forecast (2024-2029) ($ million)
- Data Table on Oman - Market size and forecast (2024-2029) ($ million)
- Chart on Oman - Year-over-year growth (2024-2029) (%)
- Data Table on Oman - Year-over-year growth (2024-2029) (%)
- 13.22 Argentina - Market size and forecast (2024-2029)
- Chart on Argentina - Market size and forecast (2024-2029) ($ million)
- Data Table on Argentina - Market size and forecast (2024-2029) ($ million)
- Chart on Argentina - Year-over-year growth (2024-2029) (%)
- Data Table on Argentina - Year-over-year growth (2024-2029) (%)
- 13.23 KSA - Market size and forecast (2024-2029)
- Chart on KSA - Market size and forecast (2024-2029) ($ million)
- Data Table on KSA - Market size and forecast (2024-2029) ($ million)
- Chart on KSA - Year-over-year growth (2024-2029) (%)
- Data Table on KSA - Year-over-year growth (2024-2029) (%)
14 Drivers, Challenges, and Opportunity/Restraints
- 14.3 Impact of drivers and challenges
- Impact of drivers and challenges in 2024 and 2029
- 14.4 Market opportunities/restraints
15 Competitive Landscape
- 15.2 Competitive Landscape
- Overview on criticality of inputs and factors of differentiation
- 15.3 Landscape disruption
- Overview on factors of disruption
- 15.4 Industry risks
- Impact of key risks on business
16 Competitive Analysis
- 16.2 Market positioning of companies
- Matrix on companies position and classification
- 16.3 AbbVie Inc.
- AbbVie Inc. - Overview
- AbbVie Inc. - Product / Service
- AbbVie Inc. - Key offerings
- 16.4 ADC Therapeutics SA
- ADC Therapeutics SA - Overview
- ADC Therapeutics SA - Product / Service
- ADC Therapeutics SA - Key offerings
- 16.5 Adcendo ApS
- Adcendo ApS - Overview
- Adcendo ApS - Product / Service
- Adcendo ApS - Key offerings
- 16.6 Araris Biotech AG
- Araris Biotech AG - Overview
- Araris Biotech AG - Product / Service
- Araris Biotech AG - Key offerings
- 16.7 Astellas Pharma Inc.
- Astellas Pharma Inc. - Overview
- Astellas Pharma Inc. - Product / Service
- Astellas Pharma Inc. - Key offerings
- 16.8 AstraZeneca Plc
- AstraZeneca Plc - Overview
- AstraZeneca Plc - Product / Service
- AstraZeneca Plc - Key offerings
- 16.9 Daiichi Sankyo Co. Ltd.
- Daiichi Sankyo Co. Ltd. - Overview
- Daiichi Sankyo Co. Ltd. - Product / Service
- Daiichi Sankyo Co. Ltd. - Key offerings
- 16.10 F. Hoffmann La Roche Ltd.
- F. Hoffmann La Roche Ltd. - Overview
- F. Hoffmann La Roche Ltd. - Product / Service
- F. Hoffmann La Roche Ltd. - Key offerings
- 16.11 Gilead Sciences Inc.
- Gilead Sciences Inc. - Overview
- Gilead Sciences Inc. - Product / Service
- Gilead Sciences Inc. - Key offerings
- 16.12 Merck KGaA
- Merck KGaA - Overview
- Merck KGaA - Product / Service
- Merck KGaA - Key offerings
- 16.13 Mersana Therapeutics Inc.
- Mersana Therapeutics Inc. - Overview
- Mersana Therapeutics Inc. - Product / Service
- Mersana Therapeutics Inc. - Key offerings
- 16.14 Mythic Therapeutics
- Mythic Therapeutics - Overview
- Mythic Therapeutics - Product / Service
- Mythic Therapeutics - Key offerings
- 16.15 Pfizer Inc.
- Pfizer Inc. - Overview
- Pfizer Inc. - Product / Service
- Pfizer Inc. - Key offerings
- 16.16 Piramal Enterprises Ltd.
- Piramal Enterprises Ltd. - Overview
- Piramal Enterprises Ltd. - Product / Service
- Piramal Enterprises Ltd. - Key offerings
- 16.17 PPF Group
- PPF Group - Overview
- PPF Group - Product / Service
- PPF Group - Key offerings
- 16.18 Regeneron Pharmaceuticals Inc.
- Regeneron Pharmaceuticals Inc. - Overview
- Regeneron Pharmaceuticals Inc. - Product / Service
- Regeneron Pharmaceuticals Inc. - Key offerings
- 16.19 Seagen Inc.
- Seagen Inc. - Overview
- Seagen Inc. - Product / Service
- Seagen Inc. - Key offerings
- 16.20 Syngene International Ltd.
- Syngene International Ltd. - Overview
- Syngene International Ltd. - Product / Service
- Syngene International Ltd. - Key offerings
- 16.21 Takeda Pharmaceutical Co. Ltd.
- Takeda Pharmaceutical Co. Ltd. - Overview
- Takeda Pharmaceutical Co. Ltd. - Product / Service
- Takeda Pharmaceutical Co. Ltd. - Key offerings
- 16.22 ImmunoGen Inc.
- ImmunoGen Inc. - Overview
- ImmunoGen Inc. - Product / Service
- ImmunoGen Inc. - Key offerings
- 16.23 GlaxoSmithKline Plc
- GlaxoSmithKline Plc - Overview
- GlaxoSmithKline Plc - Product / Service
- GlaxoSmithKline Plc - Key offerings
- 16.24 Byondis
- Byondis - Overview
- Byondis - Product / Service
- Byondis - Key offerings
- 16.25 AbbVie Inc.
- AbbVie Inc. - Overview
- AbbVie Inc. - Product / Service
- AbbVie Inc. - Key offerings
- 16.26 ADC Therapeutics SA
- ADC Therapeutics SA - Overview
- ADC Therapeutics SA - Product / Service
- ADC Therapeutics SA - Key offerings
- 16.27 Adcendo ApS
- Adcendo ApS - Overview
- Adcendo ApS - Product / Service
- Adcendo ApS - Key offerings
- 16.28 Araris Biotech AG
- Araris Biotech AG - Overview
- Araris Biotech AG - Product / Service
- Araris Biotech AG - Key offerings
- 16.29 Astellas Pharma Inc.
- Astellas Pharma Inc. - Overview
- Astellas Pharma Inc. - Product / Service
- Astellas Pharma Inc. - Key offerings
- 16.30 AstraZeneca Plc
- AstraZeneca Plc - Overview
- AstraZeneca Plc - Product / Service
- AstraZeneca Plc - Key offerings
- 16.31 Daiichi Sankyo Co. Ltd.
- Daiichi Sankyo Co. Ltd. - Overview
- Daiichi Sankyo Co. Ltd. - Product / Service
- Daiichi Sankyo Co. Ltd. - Key offerings
- 16.32 F. Hoffmann La Roche Ltd.
- F. Hoffmann La Roche Ltd. - Overview
- F. Hoffmann La Roche Ltd. - Product / Service
- F. Hoffmann La Roche Ltd. - Key offerings
- 16.33 Gilead Sciences Inc.
- Gilead Sciences Inc. - Overview
- Gilead Sciences Inc. - Product / Service
- Gilead Sciences Inc. - Key offerings
- 16.34 Merck KGaA
- Merck KGaA - Overview
- Merck KGaA - Product / Service
- Merck KGaA - Key offerings
- 16.35 Mersana Therapeutics Inc.
- Mersana Therapeutics Inc. - Overview
- Mersana Therapeutics Inc. - Product / Service
- Mersana Therapeutics Inc. - Key offerings
- 16.36 Mythic Therapeutics
- Mythic Therapeutics - Overview
- Mythic Therapeutics - Product / Service
- Mythic Therapeutics - Key offerings
- 16.37 Pfizer Inc.
- Pfizer Inc. - Overview
- Pfizer Inc. - Product / Service
- Pfizer Inc. - Key offerings
- 16.38 Piramal Enterprises Ltd.
- Piramal Enterprises Ltd. - Overview
- Piramal Enterprises Ltd. - Product / Service
- Piramal Enterprises Ltd. - Key offerings
- 16.39 PPF Group
- PPF Group - Overview
- PPF Group - Product / Service
- PPF Group - Key offerings
- 16.40 Regeneron Pharmaceuticals Inc.
- Regeneron Pharmaceuticals Inc. - Overview
- Regeneron Pharmaceuticals Inc. - Product / Service
- Regeneron Pharmaceuticals Inc. - Key offerings
- 16.41 Seagen Inc.
- Seagen Inc. - Overview
- Seagen Inc. - Product / Service
- Seagen Inc. - Key offerings
- 16.42 Syngene International Ltd.
- Syngene International Ltd. - Overview
- Syngene International Ltd. - Product / Service
- Syngene International Ltd. - Key offerings
- 16.43 Takeda Pharmaceutical Co. Ltd.
- Takeda Pharmaceutical Co. Ltd. - Overview
- Takeda Pharmaceutical Co. Ltd. - Product / Service
- Takeda Pharmaceutical Co. Ltd. - Key offerings
17 Appendix
- 17.2 Inclusions and exclusions checklist
- Inclusions checklist
- Exclusions checklist
- 17.3 Currency conversion rates for US$
- Currency conversion rates for US$
- 17.4 Research methodology
- 17.7 Validation techniques employed for market sizing
- Validation techniques employed for market sizing
- 17.9 360 degree market analysis
- 360 degree market analysis
- 17.10 List of abbreviations