
Online Auction Market Size 2026-2030
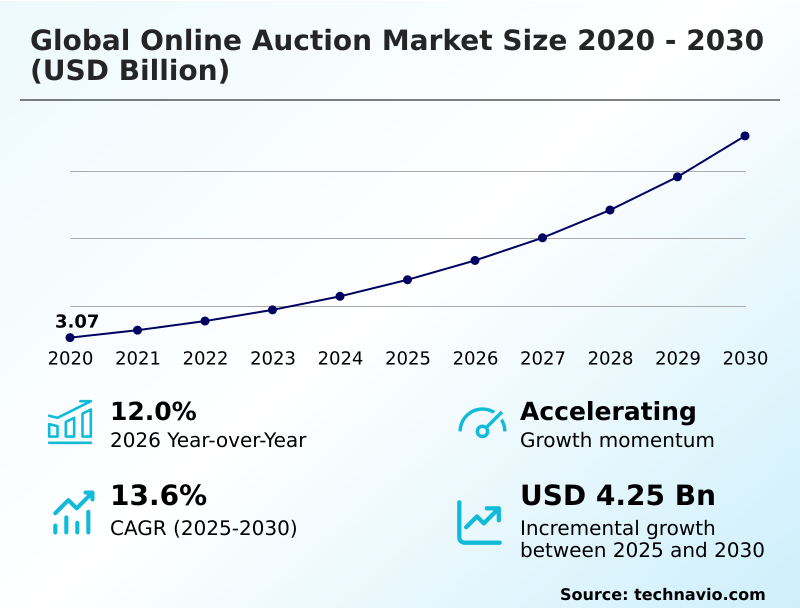
The online auction market size is valued to increase by USD 4.25 billion, at a CAGR of 13.6% from 2025 to 2030. Strategic integration of AI and ML in auction ecosystems will drive the online auction market.
Major Market Trends & Insights
- North America dominated the market and accounted for a 40.3% growth during the forecast period.
- By Product - Collectibles segment was valued at USD 1.03 billion in 2024
- By Platform - Web-based segment accounted for the largest market revenue share in 2024
Market Size & Forecast
- Market Opportunities: USD 5.95 billion
- Market Future Opportunities: USD 4.25 billion
- CAGR from 2025 to 2030 : 13.6%
Market Summary
- The online auction market represents a sophisticated digital ecosystem facilitating the sale of goods through competitive bidding. This market is driven by the strategic integration of artificial intelligence and machine learning to optimize price discovery and enhance user engagement. A key trend is the proliferation of live commerce and interactive bidding ecosystems, which create more immersive experiences.
- For instance, a business liquidating industrial machinery can use a live stream shopping platform to reach a global audience, demonstrating equipment functionality in real-time to drive higher bids and improve sell-through rates. However, the market faces significant challenges, including sophisticated cybersecurity threats and the need for robust fraud detection.
- The adoption of blockchain for asset tokenization and digital provenance tracking is emerging as a solution to enhance security and transparency. Platforms are continuously innovating, using predictive analytics and hyper-personalization to tailor user experiences, which has improved conversion probability by over 10% in some segments.
- The focus on sustainable commerce and the circular economy is also expanding the market for pre-owned goods, supported by authenticity guarantee programs.
What will be the Size of the Online Auction Market during the forecast period?
Get Key Insights on Market Forecast (PDF) Get Free Sample
How is the Online Auction Market Segmented?
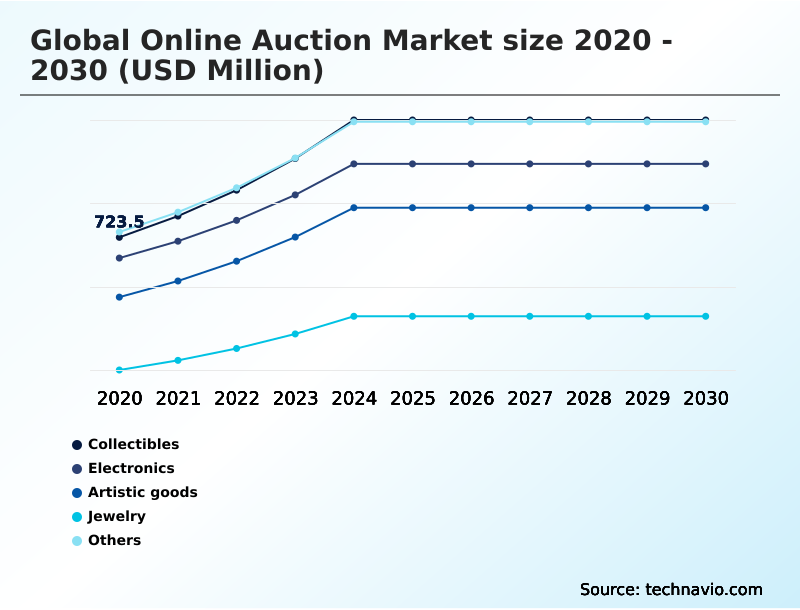
The online auction industry research report provides comprehensive data (region-wise segment analysis), with forecasts and estimates in "USD million" for the period 2026-2030, as well as historical data from 2020-2024 for the following segments.
- Product
- Collectibles
- Electronics
- Artistic goods
- Jewelry
- Others
- Platform
- Web-based
- Application-based
- Pricing scheme
- Commission-based fees
- Flat fees
- Subscription-based fees
- Hybrid pricing models
- Geography
- North America
- US
- Canada
- Mexico
- Europe
- UK
- Germany
- France
- APAC
- China
- India
- Japan
- South America
- Brazil
- Argentina
- Middle East and Africa
- South Africa
- UAE
- Saudi Arabia
- Rest of World (ROW)
- North America
By Product Insights
The collectibles segment is estimated to witness significant growth during the forecast period.
The collectibles segment is shifting toward digital provenance tracking and democratized ownership of assets. This market is characterized by high emotional engagement, with collectors viewing acquisitions as alternative investments.
This is driving platforms to offer robust application programming interface tools and enhanced historical pricing data. The integration of machine learning for condition assessment, which improves vehicle condition scores by over 15%, is reducing friction in remote bidding.
Technologies enabling interactive video demonstrations are essential. As digital payment gateways become integrated, the high-velocity exchange of goods is streamlined, with live stream shopping events now accounting for a significant portion of gross merchandise volume.
Platforms are focusing on data-driven transparency to build trust.
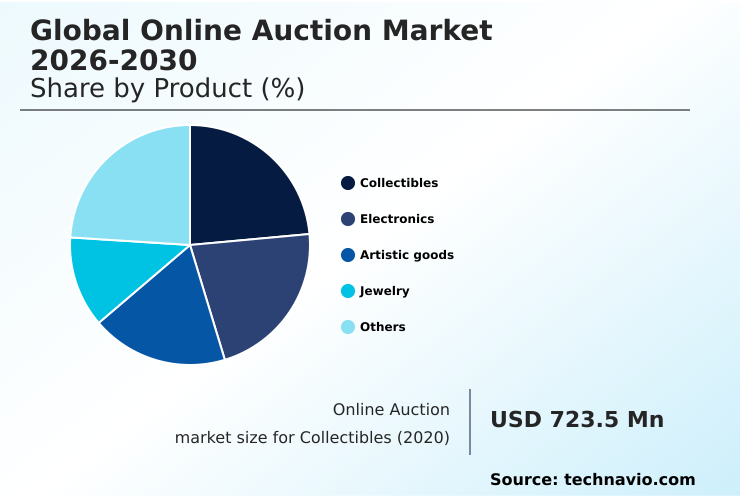
The Collectibles segment was valued at USD 1.03 billion in 2024 and showed a gradual increase during the forecast period.
Regional Analysis
North America is estimated to contribute 40.3% to the growth of the global market during the forecast period.Technavio’s analysts have elaborately explained the regional trends and drivers that shape the market during the forecast period.
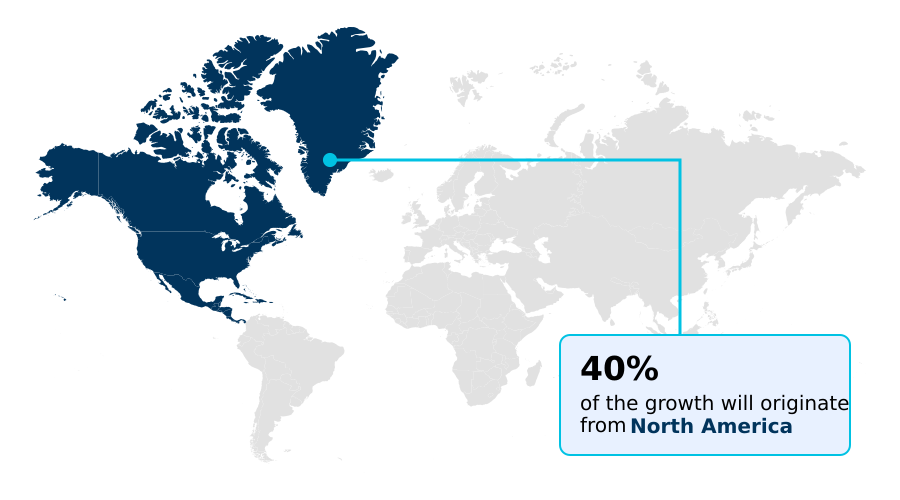
See How Online Auction Market Demand is Rising in North America Get Free Sample
The geographic landscape is marked by technological innovation and high-volume liquidation, particularly in North America and APAC. The adoption of asset tokenization and blockchain is creating new opportunities for fractionalized ownership of high-value fine arts.
In APAC, live stream shopping accounts for over 40% of gross merchandise volume on some platforms. North America leads in sustainable commerce initiatives, with circular economy models driving the market for pre-owned electronics and fashion.
The use of digital vaults and immutable provenance is gaining traction globally, enhancing security. Performance marketing strategies are becoming highly localized, while hybrid pricing models are adapted to regional regulatory environments, especially for industrial machinery.
Market Dynamics
Our researchers analyzed the data with 2025 as the base year, along with the key drivers, trends, and challenges. A holistic analysis of drivers will help companies refine their marketing strategies to gain a competitive advantage.
- The future of the online auction market hinges on specialized technological applications. The use of ai-enabled listing tools for recommerce is already streamlining the seller experience, while blockchain for immutable art provenance is becoming the gold standard in high-value art sales.
- For tangible assets, the focus is on data, with ai for predictive vehicle diagnostic data transforming automotive auctions and ai-driven inspection for automotive condition scores providing unmatched transparency. A core challenge is ensuring cybersecurity for real-time bidding integrity, especially by securing apis against denial of service attacks.
- The growth of live stream auctions for gross merchandise volume shows a shift in user engagement, further enhanced by hyper-personalization in auction notifications. Tokenization of high-value collectible assets and digital provenance for luxury asset tracking are creating new investment avenues.
- The industry is also tackling persistent issues like fraud detection in high-value online auctions and managing cross-border customs in online auctions. Behind the scenes, platforms are focused on optimizing price discovery with machine learning, analyzing the impact of ai on performance marketing conversion, and automating bid increments with predictive analytics.
- The consumer-facing experience is being enriched by using augmented reality for jewelry try-on and catering to application-based bidding for mobile-first users. The role of circular economy in electronics resale and addressing the challenges of counterfeit goods in fashion auctions are shaping sustainable practices.
- Business models are also evolving, with both hybrid pricing models for enterprise sellers and subscription-based fees for data access becoming more common, showing a maturation of the market that outperforms older models by a significant margin.
What are the key market drivers leading to the rise in the adoption of Online Auction Industry?
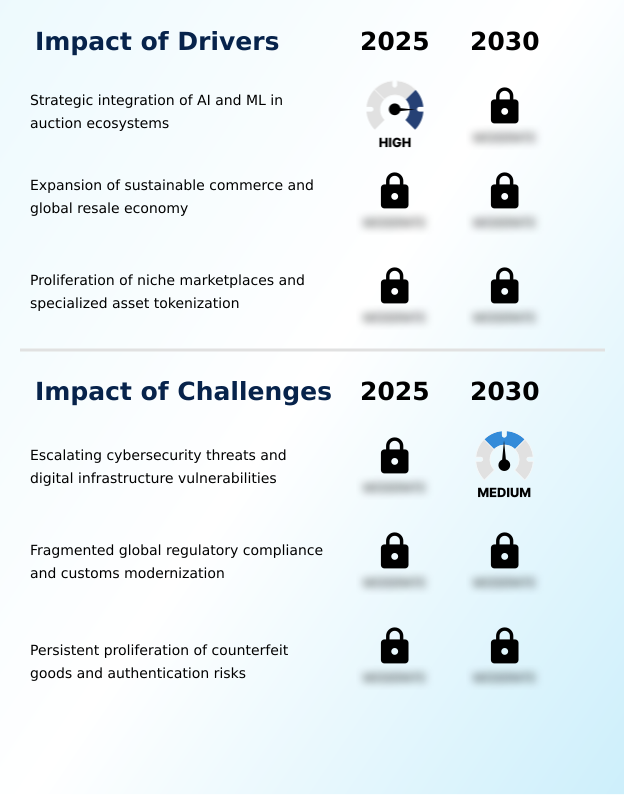
- The strategic integration of AI and machine learning into auction ecosystems serves as a key driver for market innovation and operational efficiency.
- The strategic deployment of artificial intelligence and machine learning is a primary market driver, optimizing price discovery and automating key processes. AI-powered user engagement tools, including hyper-personalization, have improved conversion rates by over 15% in targeted campaigns.
- Automated bidding systems streamline participation for high-frequency traders, while AI-driven inspection protocols for assets like vehicles provide the data-driven transparency bidders demand. This technological integration is crucial for the resale economy, enabling a high-velocity exchange of goods.
- Platforms are also leveraging predictive analytics to guide sellers on pricing, which has proven essential in markets for luxury goods and high-value fine arts, ensuring assets achieve their maximum potential value.
What are the market trends shaping the Online Auction Industry?
- The proliferation of live commerce is redefining the market landscape. This trend fosters more interactive and engaging bidding ecosystems that enhance participant involvement.
- A transformative trend is the convergence of live commerce and interactive bidding, creating immersive digital experiences. The use of AI-powered digital twins allows bidders to inspect assets with unprecedented detail, increasing confidence in remote purchases. This is complemented by AI-driven detection systems that enhance security.
- The adoption of hybrid auction formats is also growing, blending physical events with global online participation, a model that has proven to increase sell-through rates by up to 20%. The focus on recommerce is driving innovation in white-label auction platforms, enabling brands to control their secondary market presence.
- This shift toward engagement-focused technology addresses historical buyer hesitation and expands market reach, with some platforms seeing user interaction double after implementing interactive video demonstrations.
What challenges does the Online Auction Industry face during its growth?
- Escalating cybersecurity threats and vulnerabilities within the digital infrastructure present a significant challenge to the industry's growth and stability.
- The market confronts significant hurdles from sophisticated cybersecurity threats, including AI-powered phishing and large-scale denial of service attacks. Maintaining real-time data synchronization across global servers during these events is a primary operational challenge. Another major issue is the risk of counterfeit goods, which requires robust fraud detection and bidder verification systems supported by authenticity guarantee programs.
- Navigating fragmented cross-border auction models and inconsistent anti-money laundering protocols creates compliance burdens. The digital infrastructure must be resilient enough to handle these threats while ensuring a seamless experience for users engaging with digital assets and participating in non-fungible tokens sales, where security is paramount.
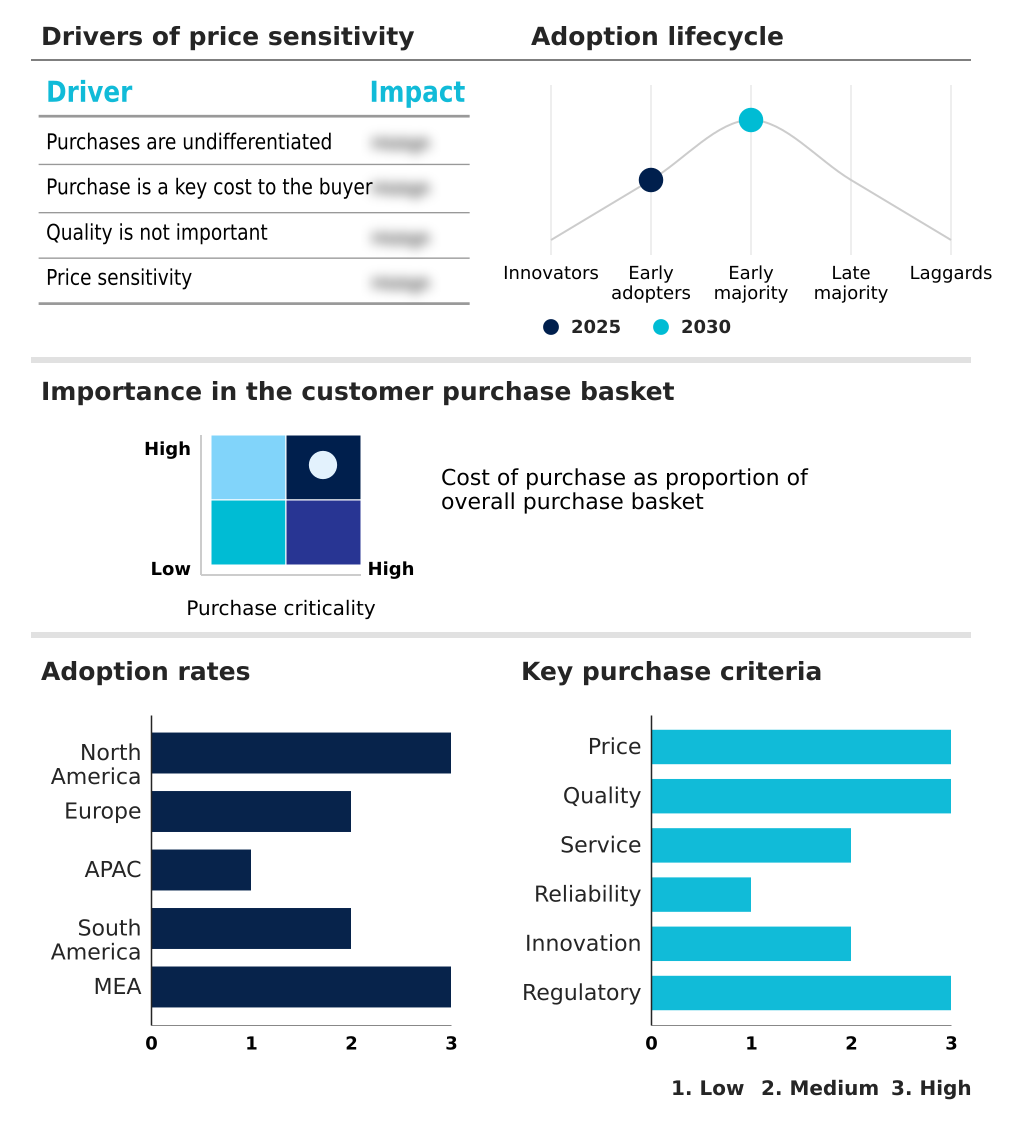
Exclusive Technavio Analysis on Customer Landscape
The online auction market forecasting report includes the adoption lifecycle of the market, covering from the innovator’s stage to the laggard’s stage. It focuses on adoption rates in different regions based on penetration. Furthermore, the online auction market report also includes key purchase criteria and drivers of price sensitivity to help companies evaluate and develop their market growth analysis strategies.
Customer Landscape of Online Auction Industry
Competitive Landscape
Companies are implementing various strategies, such as strategic alliances, online auction market forecast, partnerships, mergers and acquisitions, geographical expansion, and product/service launches, to enhance their presence in the industry.
32auctions - Provides web-based platforms for organizing and hosting silent auctions, designed specifically for businesses and nonprofit fundraising initiatives.
The industry research and growth report includes detailed analyses of the competitive landscape of the market and information about key companies, including:
- 32auctions
- ACV Auctions Inc.
- AirAuctioneer
- Auction Technology Group PLC
- Auctioneer Software
- Auctria
- BiddingOwl.com
- Bidlogix Ltd.
- Bidpath Inc.
- BidWrangler
- Copart Inc.
- GalaBid
- Handbid
- iRostrum
- OneCause Inc.
- ProcurePort
- RainWorx Software
- Ritchie Bros. Auctioneers Inc.
- Silent Auction Pro
- Webtron Online Auction
Qualitative and quantitative analysis of companies has been conducted to help clients understand the wider business environment as well as the strengths and weaknesses of key industry players. Data is qualitatively analyzed to categorize companies as pure play, category-focused, industry-focused, and diversified; it is quantitatively analyzed to categorize companies as dominant, leading, strong, tentative, and weak.
Recent Development and News in Online auction market
- In September, 2024, Christie's celebrated its fortieth anniversary in Asia by inaugurating its new Asia Pacific headquarters in Hong Kong, utilized for high-profile spring auctions featuring integrated online bidding platforms.
- In August, 2025, Auction Technology Group acquired Chairish, a move aimed at broadening its reach into the premium home furnishings and recommerce sectors.
- In October, 2025, OneCause was acquired by Bonterra, a strategic integration designed to combine sophisticated fundraising auction tools with a broader suite of social impact software.
- In November, 2025, the Brazilian federal government finalized the regulations for its inaugural battery energy storage system auction, a major procurement event expected to be managed through competitive digital bidding.
Dive into Technavio’s robust research methodology, blending expert interviews, extensive data synthesis, and validated models for unparalleled Online Auction Market insights. See full methodology.
| Market Scope | |
|---|---|
| Page number | 299 |
| Base year | 2025 |
| Historic period | 2020-2024 |
| Forecast period | 2026-2030 |
| Growth momentum & CAGR | Accelerate at a CAGR of 13.6% |
| Market growth 2026-2030 | USD 4250.5 million |
| Market structure | Fragmented |
| YoY growth 2025-2026(%) | 12.0% |
| Key countries | US, Canada, Mexico, UK, Germany, France, Italy, Spain, The Netherlands, China, India, Japan, South Korea, Indonesia, Australia, Brazil, Argentina, Chile, South Africa, UAE, Saudi Arabia, Egypt and Nigeria |
| Competitive landscape | Leading Companies, Market Positioning of Companies, Competitive Strategies, and Industry Risks |
Research Analyst Overview
- The online auction market is defined by the rapid deployment of artificial intelligence and machine learning to optimize price discovery. This involves AI-driven inspection protocols and predictive analytics to enhance user engagement. A key boardroom decision revolves around investing in cybersecurity to counter AI-powered phishing and denial of service attacks that threaten data synchronization and application programming interface integrity.
- Trends like live commerce, interactive bidding, and live stream shopping are becoming standard, supported by augmented reality tools and AI-powered digital twins. The adoption of blockchain for digital provenance tracking, asset tokenization, and immutable provenance is critical for high-value assets. This technology enables fractionalized ownership and secure digital vaults. Platforms now offer hybrid auction formats and employ sophisticated performance marketing.
- The market is also shaped by sustainable commerce, the circular economy, and the growing resale economy. To ensure trust, authenticity guarantee programs, fraud detection, bidder verification, and AI-driven detection systems are essential. Navigating cross-border auction models requires adherence to anti-money laundering protocols, while hyper-personalization and automated bidding enhance the user experience.
- This complex ecosystem, where interactive video demonstrations are common, shows how digital transformation is fundamentally reshaping asset liquidation.
What are the Key Data Covered in this Online Auction Market Research and Growth Report?
-
What is the expected growth of the Online Auction Market between 2026 and 2030?
-
USD 4.25 billion, at a CAGR of 13.6%
-
-
What segmentation does the market report cover?
-
The report is segmented by Product (Collectibles, Electronics, Artistic goods, Jewelry, and Others), Platform (Web-based, and Application-based), Pricing Scheme (Commission-based fees, Flat fees, Subscription-based fees, and Hybrid pricing models) and Geography (North America, Europe, APAC, South America, Middle East and Africa)
-
-
Which regions are analyzed in the report?
-
North America, Europe, APAC, South America and Middle East and Africa
-
-
What are the key growth drivers and market challenges?
-
Strategic integration of AI and ML in auction ecosystems, Escalating cybersecurity threats and digital infrastructure vulnerabilities
-
-
Who are the major players in the Online Auction Market?
-
32auctions, ACV Auctions Inc., AirAuctioneer, Auction Technology Group PLC, Auctioneer Software, Auctria, BiddingOwl.com, Bidlogix Ltd., Bidpath Inc., BidWrangler, Copart Inc., GalaBid, Handbid, iRostrum, OneCause Inc., ProcurePort, RainWorx Software, Ritchie Bros. Auctioneers Inc., Silent Auction Pro and Webtron Online Auction
-
Market Research Insights
- The market's momentum is fueled by mobile-first consumption patterns, where application-based platforms drive over 60% of user interactions. The shift toward data-driven transparency and digital-first procurement is evident as B2B transactions see a 25% increase in efficiency using online bidding software. The rise of recommerce and peer-to-peer marketplaces has intensified competition, compelling platforms to innovate.
- Integration of digital payment gateways has streamlined transactions, reducing payment failures by 15%. This environment demands a focus on high-velocity exchange and robust social commerce features to retain a competitive edge in a marketplace increasingly defined by real-time engagement and secure, seamless transactions.
We can help! Our analysts can customize this online auction market research report to meet your requirements.
 RIA -
RIA - 
