Payment Gateways Market Analysis APAC, North America, Europe, South America, Middle East and Africa - China, US, Japan, UK, Germany - Size and Forecast 2024-2028

Payment Gateways Market Analysis APAC, North America, Europe, South America, Middle East and Africa - China, US, Japan, UK, Germany - Size and Forecast 2024-2028

Published: May 2024 174 Pages SKU: IRTNTR43177

Market Overview at a Glance

$11.23 B
Market Opportunity
13.42%
CAGR
11.57
YoY growth 2023-2024(%)

Payment Gateways Market Size 2024-2028

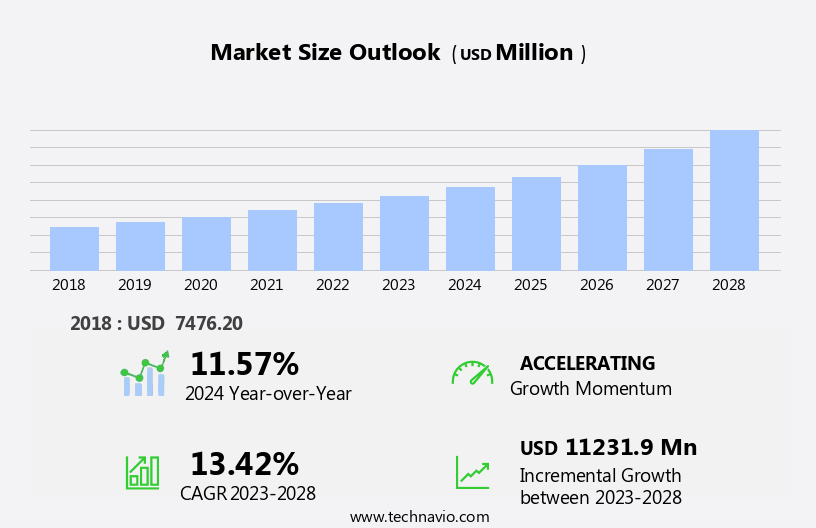
The payment gateways market size is forecast to increase by USD 11.23 billion at a CAGR of 13.42% between 2023 and 2028.

  • The market is witnessing significant growth due to the increasing adoption of virtual cards and digital payments. Contactless payment solutions, such as cardless ATMs and NFC-based technology, are gaining popularity, particularly In the US and North America, as they offer convenience and enhanced security. However, the high operating and maintenance costs of Point of Sale (PoS) terminals remain a challenge for small and medium-sized businesses. Additionally, cybersecurity concerns continue to be a major issue, especially for e-commerce and crypto wallet transactions. The integration of digital payments in vending machines, smartphones, and other everyday transactions further underscores the market's potential for growth.
  • As the market evolves, it is essential to stay informed about the latest trends and challenges to remain competitive.
  • What will be the Size of the Payment Gateways Market During the Forecast Period?

    Payment Gateways Market Size

     Request Free Sample

  • The market continues to experience robust growth as the global economy increasingly embraces digital transactions. With escalating internet penetration and consumer inclination towards cashless payments, online money transfers have become a preferred choice for businesses and individuals alike. Payment gateways, the digital infrastructure facilitating secure online transactions, have become indispensable in this evolving landscape. Merchant acquiring and card payments dominate the market, with small merchants and micro merchants increasingly adopting cost-effective solutions to cater to their clientele. However, the market is not without challenges. Cyberattacks, financial losses, and business interruptions pose significant risks, necessitating stringent security measures. The e-commerce sector has witnessed record highs, with the coronavirus outbreak further accelerating the shift towards online services.
  • Contactless payments and bulk transactions have gained traction, as consumers and businesses seek convenience and safety. The market is poised for continued expansion, driven by the digital payment revolution and the relentless march towards a cashless economy.
  • How is this Payment Gateways Industry segmented and which is the largest segment?

    The payment gateways industry research report provides comprehensive data (region-wise segment analysis), with forecasts and estimates in "USD million" for the period 2024-2028, as well as historical data from 2018-2022 for the following segments.

    • End-user
      • Large enterprises
      • Micro and small enterprises
      • Mid-sized enterprises
    • Type
      • Hosted
      • Non-hosted
    • Geography
      • APAC
        • China
        • Japan
      • North America
        • US
      • Europe
        • Germany
        • UK
      • South America
        • Middle East and Africa

        By End-user Insights

        • The large enterprises segment is estimated to witness significant growth during the forecast period.

        Payment gateways have experienced significant adoption among large enterprises due to the increasing number of transactions, particularly in sectors such as banking, financial services and insurance (BSFI), IT, and manufacturing. Cross-border banking activities and the integration of modern vending machines with contactless and card-based payments are further driving market growth. Large enterprises are more inclined towards advanced payment solutions like payment gateways and digital wallets, contributing the majority of market revenue. The coronavirus pandemic has accelerated the shift towards contactless payments and digitalization in various sectors, including e-commerce, leading to record highs in online transactions. Payment gateways facilitate faster transactions, improve customer relationships, and enable digital channels such as mobile-based apps, internet banking, and e-commerce transactions.

        Security concerns, including phishing, denial of services, and cyberattacks, necessitate robust digital infrastructure to ensure consumer data protection and prevent financial losses and business interruptions. The increasing consumer inclination towards online services and the coronavirus outbreak have propelled the e-commerce sector to new heights, further fueling the demand for payment gateways. Payment gateways support various payment methods, including cards, bank apps, and digital wallets, and enable bulk transactions, onsite payments, and payment processing. In conclusion, the market for payment gateways is poised for growth due to the increasing need for secure and efficient payment processing solutions In the digital economy.

        Payment Gateways Market Size

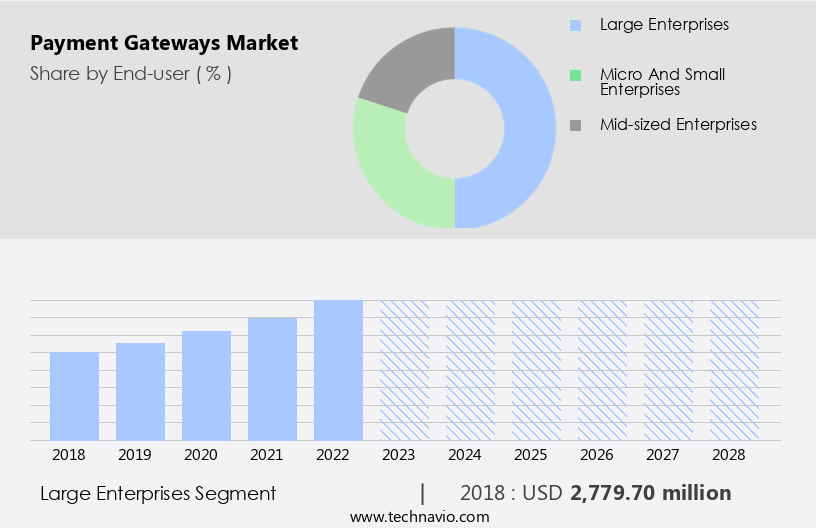
        Get a glance at the Payment Gateways Industry report of share of various segments Request Free Sample

        The Large enterprises segment was valued at USD 2.78 billion in 2018 and showed a gradual increase during the forecast period.

        Regional Analysis

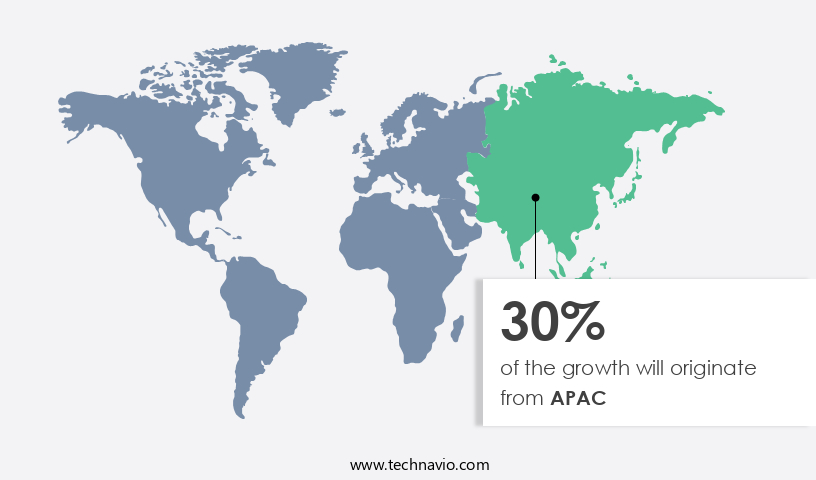
        • APAC is estimated to contribute 30% to the growth of the global market during the forecast period.

        Technavio’s analysts have elaborately explained the regional trends and drivers that shape the market during the forecast period.

        Payment Gateways Market Share by Geography

        For more insights on the market share of various regions, Request Free Sample

        The market in APAC is poised for significant expansion due to the increasing adoption of digital payment solutions. Sectors in India and China are integrating payment gateways with online platforms and hardware devices, such as smartphones and PoS systems, to enhance transaction security. E-commerce and BFSI sectors are particularly adopting online payment gateways to streamline payment processes and improve customer satisfaction. India and Japan lead the UPI industry, driving market growth In the region. Internet penetration and the coronavirus pandemic have accelerated the shift towards contactless, digital payments. Payment gateways facilitate faster transactions, digital wallets, and contactless services, fostering stronger customer relationships.

        Security concerns, including phishing, denial of services, and cyberattacks, necessitate robust digital infrastructure. Payment gateways process bulk transactions, onsite payments, and e-commerce transactions, enabling businesses to operate efficiently and securely In the digital economy.

        Market Dynamics

        Our  researchers analyzed the data with 2023 as the base year, along with the key drivers, trends, and challenges. A holistic analysis of drivers will help companies refine their marketing strategies to gain a competitive advantage.

        What are the key market drivers leading to the rise In the adoption of Payment Gateways Industry?

        High adoption of contactless payment solutions is the key driver of the market.

      • Payment gateways have revolutionized the way money is transferred online, enabling consumers to make transactions through digital channels with ease and convenience. The increasing internet penetration and consumer inclination towards cashless economy have fueled the adoption of digital payments. Merchant acquiring solutions, such as mobile-based apps and internet banking, have become essential for small merchants to process online transactions efficiently and cost-effectively. Digital wallets like PhonePe, Paystack, and others have gained popularity due to their security features and faster transaction processing. The coronavirus pandemic has accelerated the shift towards contactless payments and digitalization, leading to record highs in e-commerce transactions.
      • Payment gateways facilitate these transactions by ensuring secure processing and transfer of funds. However, security concerns, such as phishing, denial of services, and cyberattacks, necessitate robust digital infrastructure to safeguard sensitive data. Hosted payment pages and escrow accounts are popular solutions for merchants to manage transactions securely. Digital wallets offer various features, including interest on savings, mobile-based payments, and contactless services, enhancing customer relationships. Payment gateways support various sectors, including mortgages, retirement planning, and onsite payments, making them an integral part of the digital economy. Bulk transactions, such as mortgage payments or B2B transactions, require efficient payment processing, which payment gateways provide.
      • Faster transactions and the convenience of making payments online have made payment gateways an indispensable tool for businesses. Despite the benefits, it is crucial to address security concerns and ensure compliance with regulatory frameworks to mitigate financial losses and business interruptions.
      • What are the market trends shaping the Payment Gateways Industry?

        Emergence of NFC-based payment technology is the upcoming market trend.

      • Payment gateways facilitate money transactions over the internet, ensuring the secure transfer of sensitive data between consumers and merchants. With increasing internet penetration and consumer inclination towards payments online, digital payments have become a preferred choice for various transactions, including e-commerce, mobile-based apps, internet banking, and onsite payments. Digital wallets and contactless services have gained popularity due to the coronavirus pandemic, leading to record highs in digitalization and faster transactions. Merchant acquiring companies like Worldline, Paystack, and Flipkart-owned PhonePe provide cost-effective solutions for small merchants, enabling them to accept bulk transactions and offer contactless services. However, security concerns remain a significant challenge, with potential threats such as phishing, denial of services, and cyberattacks posing risks of financial losses and business interruptions.
      • To mitigate these risks, payment gateways employ digital infrastructure and security measures, including escrow accounts, interest, and encryption. Consumers and merchants rely on digital channels for online money transfers and various services, including mortgages and retirement planning, making it essential to prioritize security and reliability in payment processing.
      • What challenges does the Payment Gateways Industry face during its growth?

        High operating and maintenance costs of PoS terminals is a key challenge affecting the industry growth.

      • Payment processing for money transactions In the digital economy has gained significant traction among businesses, particularly small merchants and micro merchants, as consumers increasingly prefer payments online. However, the use of payment gateways for processing these transactions involves sensitive data and raises security concerns. The cost of using payment gateways, including setup costs, individual transaction fees, monthly subscriptions, and cancelation fees, varies depending on the size and needs of businesses. Cloud-based payment gateways offer a more cost-effective solution compared to server-based ones due to lower setup costs and monthly maintenance fees. For instance, the annual operating cost for a small business using a cloud-based payment gateway can be under USD500.
      • The coronavirus pandemic has accelerated the digitalization of various sectors, including e-commerce, leading to record-high volumes of digital transactions. Digital wallets, mobile-based payments, and contactless services have become increasingly popular, with platforms like PhonePe, Paystack, and Internet banking offering faster transactions and customer relationship-building opportunities. Despite the benefits, businesses must address security concerns, including phishing, denial of services, and cyberattacks, which can result in financial losses and business interruptions. Ensuring a secure digital infrastructure is crucial for businesses offering online services and money transfers. The use of escrow accounts and interest on digital wallets can help mitigate some of these risks.
      • The shift towards a cashless economy and contactless payments is expected to continue, with payment gateways playing a vital role in facilitating these transactions.
      • Exclusive Customer Landscape

        The payment gateways market forecasting report includes the adoption lifecycle of the market, covering from the innovator’s stage to the laggard’s stage. It focuses on adoption rates in different regions based on penetration. Furthermore, the payment gateways market report also includes key purchase criteria and drivers of price sensitivity to help companies evaluate and develop their market growth analysis strategies.
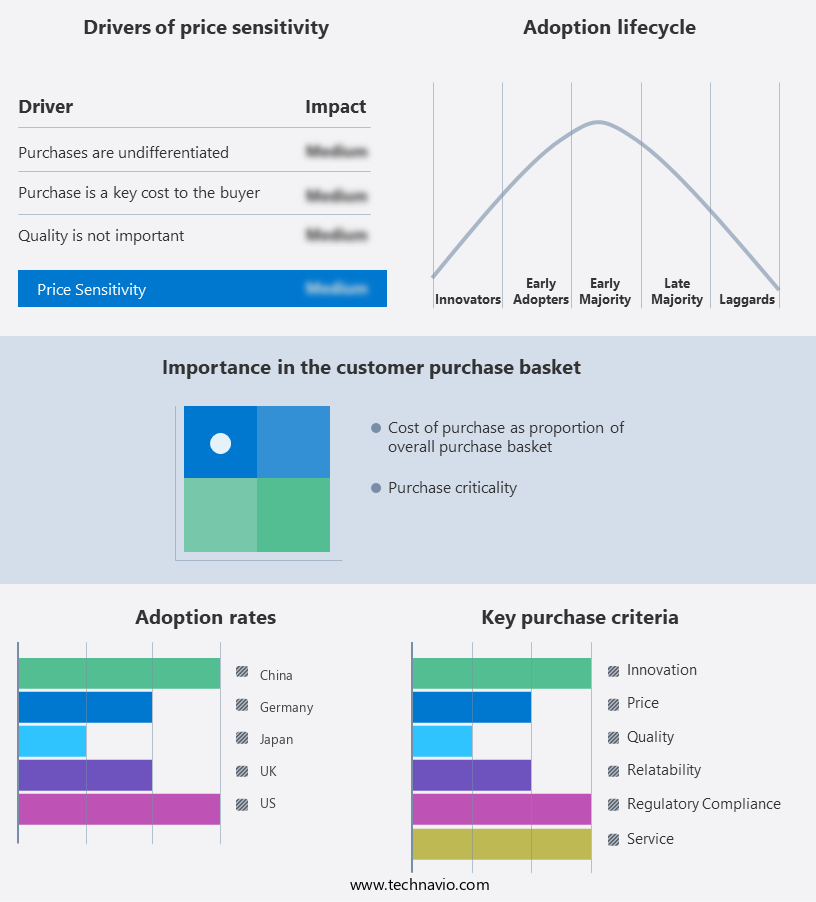
        Payment Gateways Market Share by Geography

         Customer Landscape

        Key Companies & Market Insights

        Companies are implementing various strategies, such as strategic alliances, payment gateways market forecast, partnerships, mergers and acquisitions, geographical expansion, and product/service launches, to enhance their presence In the industry.

        Adyen NV - Payment gateways facilitate secure and efficient online transactions for businesses, enabling them to accept various payment methods from customers worldwide. These systems process authorization and verification of transactions in real-time, ensuring seamless commerce experiences. Key features include fraud prevention tools, encryption technology, and compatibility with multiple currencies and payment types. The market for payment gateways continues to grow, driven by the increasing shift towards e-commerce and digital payments. Companies specializing in this sector offer customizable solutions to cater to diverse business needs.

        The industry research and growth report includes detailed analyses of the competitive landscape of the market and information about key companies, including:

        • Adyen NV
        • Amazon.com Inc.
        • B2Broker Ltd.
        • BitPay Inc.
        • Block Inc.
        • CCBill LLC
        • Fidelity National Information Services Inc.
        • Global Payments Inc.
        • Infibeam Avenues Ltd.
        • Ingenico Group SA
        • JPMorgan Chase and Co.
        • Mastercard Inc.
        • MIH PayU BV
        • One97 Communications Ltd.
        • Payoneer Global Inc.
        • PayPal Holdings Inc.
        • Razorpay Software Pvt. Ltd.
        • Stripe Inc.
        • VeriFone Inc.
        • Visa Inc.

        Qualitative and quantitative analysis of companies has been conducted to help clients understand the wider business environment as well as the strengths and weaknesses of key industry players. Data is qualitatively analyzed to categorize companies as pure play, category-focused, industry-focused, and diversified; it is quantitatively analyzed to categorize companies as dominant, leading, strong, tentative, and weak.

        Research Analyst Overview

        Payment systems have evolved significantly in recent years, with the shift towards digital transactions becoming increasingly prevalent. The convenience and accessibility of making payments online have led to a surge in consumer adoption, particularly in areas with high internet penetration. This trend is not limited to developed economies but is also gaining traction in emerging markets. Consumers' increasing inclination towards cashless transactions has led to the proliferation of various digital payment methods. These include digital wallets, bank apps, and merchant acquiring solutions. Merchants, particularly small ones, are increasingly turning to cost-effective and unified payments solutions to facilitate online transactions.

        The digitalization of payments has brought about numerous benefits, including faster transactions, improved customer relationships, and the ability to process bulk transactions. However, it also presents new challenges, particularly In the areas of security and compliance. Sensitive data transmitted during online transactions is a prime target for cyberattacks, including phishing, denial of service attacks, and data breaches. Payment gateways play a crucial role in facilitating secure and efficient online transactions. These systems enable merchants to accept payments through various digital channels, including e-commerce transactions, mobile-based payments, and internet banking. They offer a range of features, including hosted payment pages, escrow accounts, and interest calculations, to ensure a seamless payment experience for both merchants and consumers.

        The coronavirus pandemic has accelerated the shift towards digital payments, with consumers increasingly relying on contactless services for their day-to-day transactions. The e-commerce sector has seen record highs in sales, with digital wallets and mobile-based apps becoming the preferred mode of payment for many consumers. Despite the benefits of digital payments, there are still concerns around security and consumer trust. Merchants and payment processors must ensure that their digital infrastructure is robust and secure to prevent financial losses and business interruptions. Payment gateways must prioritize security measures, such as encryption and tokenization, to protect sensitive data and mitigate the risk of cyberattacks.

        In conclusion, the market is dynamic and constantly evolving, driven by the increasing adoption of digital payments and the need for secure and efficient transaction processing. Merchants and consumers alike are benefiting from the convenience and accessibility of digital channels, but it is essential that payment processors prioritize security and compliance to build trust and confidence In the digital payments ecosystem.

        Market Scope

        Report Coverage

        Details

        Page number

        174

        Base year

        2023

        Historic period

        2018-2022

        Forecast period

        2024-2028

        Growth momentum & CAGR

        Accelerate at a CAGR of 13.42%

        Market growth 2024-2028

        USD 11231.9 million

        Market structure

        Fragmented

        YoY growth 2023-2024(%)

        11.57

        Key countries

        China, US, Japan, UK, and Germany

        Competitive landscape

        Leading Companies, Market Positioning of Companies, Competitive Strategies, and Industry Risks

        Request Free Sample

        What are the Key Data Covered in this Payment Gateways Market Research and Growth Report?

        • CAGR of the Payment Gateways industry during the forecast period
        • Detailed information on factors that will drive the growth and forecasting between 2024 and 2028
        • Precise estimation of the size of the market and its contribution of the industry in focus to the parent market
        • Accurate predictions about upcoming growth and trends and changes in consumer behaviour
        • Growth of the market across APAC, North America, Europe, South America, and Middle East and Africa
        • Thorough analysis of the market’s competitive landscape and detailed information about companies
        • Comprehensive analysis of factors that will challenge the payment gateways market growth of industry companies

        We can help! Our analysts can customize this payment gateways market research report to meet your requirements.

        Get in touch


        1 Executive Summary

        • 1.1 Market overview
          • Executive Summary - Chart on Market Overview
          • Executive Summary - Data Table on Market Overview
          • Executive Summary - Chart on Global Market Characteristics
          • Executive Summary - Chart on Market by Geography
          • Executive Summary - Chart on Market Segmentation by End-user
          • Executive Summary - Chart on Market Segmentation by Type
          • Executive Summary - Chart on Incremental Growth
          • Executive Summary - Data Table on Incremental Growth
          • Executive Summary - Chart on Company Market Positioning

        2 Market Landscape

        • 2.1 Market ecosystem
          • Parent Market
          • Data Table on - Parent Market
        • 2.2 Market characteristics
          • Market characteristics analysis
        • 2.3 Value chain analysis
          • Value Chain Analysis

        3 Market Sizing

        • 3.1 Market definition
          • Offerings of companies included in the market definition
        • 3.2 Market segment analysis
          • Market segments
        • 3.3 Market size 2023
          • 3.4 Market outlook: Forecast for 2023-2028
            • Chart on Global - Market size and forecast 2023-2028 ($ million)
            • Data Table on Global - Market size and forecast 2023-2028 ($ million)
            • Chart on Global Market: Year-over-year growth 2023-2028 (%)
            • Data Table on Global Market: Year-over-year growth 2023-2028 (%)

          4 Historic Market Size

          • 4.1 Global Payment Gateways Market 2018 - 2022
            • Historic Market Size - Data Table on Global Payment Gateways Market 2018 - 2022 ($ million)
          • 4.2 End-user segment analysis 2018 - 2022
            • Historic Market Size - End-user Segment 2018 - 2022 ($ million)
          • 4.3 Type segment analysis 2018 - 2022
            • Historic Market Size - Type Segment 2018 - 2022 ($ million)
          • 4.4 Geography segment analysis 2018 - 2022
            • Historic Market Size - Geography Segment 2018 - 2022 ($ million)
          • 4.5 Country segment analysis 2018 - 2022
            • Historic Market Size - Country Segment 2018 - 2022 ($ million)

          5 Five Forces Analysis

          • 5.1 Five forces summary
            • Five forces analysis - Comparison between 2023 and 2028
          • 5.2 Bargaining power of buyers
            • Bargaining power of buyers - Impact of key factors 2023 and 2028
          • 5.3 Bargaining power of suppliers
            • Bargaining power of suppliers - Impact of key factors in 2023 and 2028
          • 5.4 Threat of new entrants
            • Threat of new entrants - Impact of key factors in 2023 and 2028
          • 5.5 Threat of substitutes
            • Threat of substitutes - Impact of key factors in 2023 and 2028
          • 5.6 Threat of rivalry
            • Threat of rivalry - Impact of key factors in 2023 and 2028
          • 5.7 Market condition
            • Chart on Market condition - Five forces 2023 and 2028

          6 Market Segmentation by End-user

          • 6.1 Market segments
            • Chart on End-user - Market share 2023-2028 (%)
            • Data Table on End-user - Market share 2023-2028 (%)
          • 6.2 Comparison by End-user
            • Chart on Comparison by End-user
            • Data Table on Comparison by End-user
          • 6.3 Large enterprises - Market size and forecast 2023-2028
            • Chart on Large enterprises - Market size and forecast 2023-2028 ($ million)
            • Data Table on Large enterprises - Market size and forecast 2023-2028 ($ million)
            • Chart on Large enterprises - Year-over-year growth 2023-2028 (%)
            • Data Table on Large enterprises - Year-over-year growth 2023-2028 (%)
          • 6.4 Micro and small enterprises - Market size and forecast 2023-2028
            • Chart on Micro and small enterprises - Market size and forecast 2023-2028 ($ million)
            • Data Table on Micro and small enterprises - Market size and forecast 2023-2028 ($ million)
            • Chart on Micro and small enterprises - Year-over-year growth 2023-2028 (%)
            • Data Table on Micro and small enterprises - Year-over-year growth 2023-2028 (%)
          • 6.5 Mid-sized enterprises - Market size and forecast 2023-2028
            • Chart on Mid-sized enterprises - Market size and forecast 2023-2028 ($ million)
            • Data Table on Mid-sized enterprises - Market size and forecast 2023-2028 ($ million)
            • Chart on Mid-sized enterprises - Year-over-year growth 2023-2028 (%)
            • Data Table on Mid-sized enterprises - Year-over-year growth 2023-2028 (%)
          • 6.6 Market opportunity by End-user
            • Market opportunity by End-user ($ million)
            • Data Table on Market opportunity by End-user ($ million)

          7 Market Segmentation by Type

          • 7.1 Market segments
            • Chart on Type - Market share 2023-2028 (%)
            • Data Table on Type - Market share 2023-2028 (%)
          • 7.2 Comparison by Type
            • Chart on Comparison by Type
            • Data Table on Comparison by Type
          • 7.3 Hosted - Market size and forecast 2023-2028
            • Chart on Hosted - Market size and forecast 2023-2028 ($ million)
            • Data Table on Hosted - Market size and forecast 2023-2028 ($ million)
            • Chart on Hosted - Year-over-year growth 2023-2028 (%)
            • Data Table on Hosted - Year-over-year growth 2023-2028 (%)
          • 7.4 Non-hosted - Market size and forecast 2023-2028
            • Chart on Non-hosted - Market size and forecast 2023-2028 ($ million)
            • Data Table on Non-hosted - Market size and forecast 2023-2028 ($ million)
            • Chart on Non-hosted - Year-over-year growth 2023-2028 (%)
            • Data Table on Non-hosted - Year-over-year growth 2023-2028 (%)
          • 7.5 Market opportunity by Type
            • Market opportunity by Type ($ million)
            • Data Table on Market opportunity by Type ($ million)

          8 Customer Landscape

          • 8.1 Customer landscape overview
            • Analysis of price sensitivity, lifecycle, customer purchase basket, adoption rates, and purchase criteria

          9 Geographic Landscape

          • 9.1 Geographic segmentation
            • Chart on Market share by geography 2023-2028 (%)
            • Data Table on Market share by geography 2023-2028 (%)
          • 9.2 Geographic comparison
            • Chart on Geographic comparison
            • Data Table on Geographic comparison
          • 9.3 APAC - Market size and forecast 2023-2028
            • Chart on APAC - Market size and forecast 2023-2028 ($ million)
            • Data Table on APAC - Market size and forecast 2023-2028 ($ million)
            • Chart on APAC - Year-over-year growth 2023-2028 (%)
            • Data Table on APAC - Year-over-year growth 2023-2028 (%)
          • 9.4 North America - Market size and forecast 2023-2028
            • Chart on North America - Market size and forecast 2023-2028 ($ million)
            • Data Table on North America - Market size and forecast 2023-2028 ($ million)
            • Chart on North America - Year-over-year growth 2023-2028 (%)
            • Data Table on North America - Year-over-year growth 2023-2028 (%)
          • 9.5 Europe - Market size and forecast 2023-2028
            • Chart on Europe - Market size and forecast 2023-2028 ($ million)
            • Data Table on Europe - Market size and forecast 2023-2028 ($ million)
            • Chart on Europe - Year-over-year growth 2023-2028 (%)
            • Data Table on Europe - Year-over-year growth 2023-2028 (%)
          • 9.6 South America - Market size and forecast 2023-2028
            • Chart on South America - Market size and forecast 2023-2028 ($ million)
            • Data Table on South America - Market size and forecast 2023-2028 ($ million)
            • Chart on South America - Year-over-year growth 2023-2028 (%)
            • Data Table on South America - Year-over-year growth 2023-2028 (%)
          • 9.7 Middle East and Africa - Market size and forecast 2023-2028
            • Chart on Middle East and Africa - Market size and forecast 2023-2028 ($ million)
            • Data Table on Middle East and Africa - Market size and forecast 2023-2028 ($ million)
            • Chart on Middle East and Africa - Year-over-year growth 2023-2028 (%)
            • Data Table on Middle East and Africa - Year-over-year growth 2023-2028 (%)
          • 9.8 China - Market size and forecast 2023-2028
            • Chart on China - Market size and forecast 2023-2028 ($ million)
            • Data Table on China - Market size and forecast 2023-2028 ($ million)
            • Chart on China - Year-over-year growth 2023-2028 (%)
            • Data Table on China - Year-over-year growth 2023-2028 (%)
          • 9.9 US - Market size and forecast 2023-2028
            • Chart on US - Market size and forecast 2023-2028 ($ million)
            • Data Table on US - Market size and forecast 2023-2028 ($ million)
            • Chart on US - Year-over-year growth 2023-2028 (%)
            • Data Table on US - Year-over-year growth 2023-2028 (%)
          • 9.10 Japan - Market size and forecast 2023-2028
            • Chart on Japan - Market size and forecast 2023-2028 ($ million)
            • Data Table on Japan - Market size and forecast 2023-2028 ($ million)
            • Chart on Japan - Year-over-year growth 2023-2028 (%)
            • Data Table on Japan - Year-over-year growth 2023-2028 (%)
          • 9.11 UK - Market size and forecast 2023-2028
            • Chart on UK - Market size and forecast 2023-2028 ($ million)
            • Data Table on UK - Market size and forecast 2023-2028 ($ million)
            • Chart on UK - Year-over-year growth 2023-2028 (%)
            • Data Table on UK - Year-over-year growth 2023-2028 (%)
          • 9.12 Germany - Market size and forecast 2023-2028
            • Chart on Germany - Market size and forecast 2023-2028 ($ million)
            • Data Table on Germany - Market size and forecast 2023-2028 ($ million)
            • Chart on Germany - Year-over-year growth 2023-2028 (%)
            • Data Table on Germany - Year-over-year growth 2023-2028 (%)
          • 9.13 Market opportunity by geography
            • Market opportunity by geography ($ million)
            • Data Tables on Market opportunity by geography ($ million)

          10 Drivers, Challenges, and Opportunity/Restraints

          • 10.1 Market drivers
            • 10.2 Market challenges
              • 10.3 Impact of drivers and challenges
                • Impact of drivers and challenges in 2023 and 2028
              • 10.4 Market opportunities/restraints

                11 Competitive Landscape

                • 11.1 Overview
                  • 11.2 Competitive Landscape
                    • Overview on criticality of inputs and factors of differentiation
                  • 11.3 Landscape disruption
                    • Overview on factors of disruption
                  • 11.4 Industry risks
                    • Impact of key risks on business

                  12 Competitive Analysis

                  • 12.1 Companies profiled
                    • Companies covered
                  • 12.2 Market positioning of companies
                    • Matrix on companies position and classification
                  • 12.3 Adyen NV
                    • Adyen NV - Overview
                    • Adyen NV - Product / Service
                    • Adyen NV - Key offerings
                  • 12.4 Amazon.com Inc.
                    • Amazon.com Inc. - Overview
                    • Amazon.com Inc. - Business segments
                    • Amazon.com Inc. - Key news
                    • Amazon.com Inc. - Key offerings
                    • Amazon.com Inc. - Segment focus
                  • 12.5 BitPay Inc.
                    • BitPay Inc. - Overview
                    • BitPay Inc. - Product / Service
                    • BitPay Inc. - Key offerings
                  • 12.6 Block Inc.
                    • Block Inc. - Overview
                    • Block Inc. - Business segments
                    • Block Inc. - Key offerings
                    • Block Inc. - Segment focus
                  • 12.7 CCBill LLC
                    • CCBill LLC - Overview
                    • CCBill LLC - Product / Service
                    • CCBill LLC - Key offerings
                  • 12.8 Fidelity National Information Services Inc.
                    • Fidelity National Information Services Inc. - Overview
                    • Fidelity National Information Services Inc. - Business segments
                    • Fidelity National Information Services Inc. - Key news
                    • Fidelity National Information Services Inc. - Key offerings
                    • Fidelity National Information Services Inc. - Segment focus
                  • 12.9 Global Payments Inc.
                    • Global Payments Inc. - Overview
                    • Global Payments Inc. - Business segments
                    • Global Payments Inc. - Key news
                    • Global Payments Inc. - Key offerings
                    • Global Payments Inc. - Segment focus
                  • 12.10 Ingenico Group SA
                    • Ingenico Group SA - Overview
                    • Ingenico Group SA - Product / Service
                    • Ingenico Group SA - Key offerings
                  • 12.11 JPMorgan Chase and Co.
                    • JPMorgan Chase and Co. - Overview
                    • JPMorgan Chase and Co. - Business segments
                    • JPMorgan Chase and Co. - Key offerings
                    • JPMorgan Chase and Co. - Segment focus
                  • 12.12 Mastercard Inc.
                    • Mastercard Inc. - Overview
                    • Mastercard Inc. - Product / Service
                    • Mastercard Inc. - Key news
                    • Mastercard Inc. - Key offerings
                  • 12.13 One97 Communications Ltd.
                    • One97 Communications Ltd. - Overview
                    • One97 Communications Ltd. - Product / Service
                    • One97 Communications Ltd. - Key offerings
                  • 12.14 PayPal Holdings Inc.
                    • PayPal Holdings Inc. - Overview
                    • PayPal Holdings Inc. - Product / Service
                    • PayPal Holdings Inc. - Key offerings
                  • 12.15 Razorpay Software Pvt. Ltd.
                    • Razorpay Software Pvt. Ltd. - Overview
                    • Razorpay Software Pvt. Ltd. - Product / Service
                    • Razorpay Software Pvt. Ltd. - Key offerings
                  • 12.16 Stripe Inc.
                    • Stripe Inc. - Overview
                    • Stripe Inc. - Product / Service
                    • Stripe Inc. - Key offerings
                  • 12.17 Visa Inc.
                    • Visa Inc. - Overview
                    • Visa Inc. - Product / Service
                    • Visa Inc. - Key offerings

                  13 Appendix

                  • 13.1 Scope of the report
                    • 13.2 Inclusions and exclusions checklist
                      • Inclusions checklist
                      • Exclusions checklist
                    • 13.3 Currency conversion rates for US$
                      • Currency conversion rates for US$
                    • 13.4 Research methodology
                      • Research methodology
                    • 13.5 Data procurement
                      • Information sources
                    • 13.6 Data validation
                      • Data validation
                    • 13.7 Validation techniques employed for market sizing
                      • Validation techniques employed for market sizing
                    • 13.8 Data synthesis
                      • Data synthesis
                    • 13.9 360 degree market analysis
                      • 360 degree market analysis
                    • 13.10 List of abbreviations
                      • List of abbreviations

                    Research Methodology

                    Technavio presents a detailed picture of the market by way of study, synthesis, and summation of data from multiple sources. The analysts have presented the various facets of the market with a particular focus on identifying the key industry influencers. The data thus presented is comprehensive, reliable, and the result of extensive research, both primary and secondary.

                    INFORMATION SOURCES

                    Primary sources

                    • Manufacturers and suppliers
                    • Channel partners
                    • Industry experts
                    • Strategic decision makers

                    Secondary sources

                    • Industry journals and periodicals
                    • Government data
                    • Financial reports of key industry players
                    • Historical data
                    • Press releases

                    DATA ANALYSIS

                    Data Synthesis

                    • Collation of data
                    • Estimation of key figures
                    • Analysis of derived insights

                    Data Validation

                    • Triangulation with data models
                    • Reference against proprietary databases
                    • Corroboration with industry experts

                    REPORT WRITING

                    Qualitative

                    • Market drivers
                    • Market challenges
                    • Market trends
                    • Five forces analysis

                    Quantitative

                    • Market size and forecast
                    • Market segmentation
                    • Geographical insights
                    • Competitive landscape

                    Interested in this report?

                    Get your sample now to see our research methodology and insights!

                    Download Now

                    Frequently Asked Questions

                    Payment Gateways market growth will increase by $ 11231.9 mn during 2024-2028.

                    The Payment Gateways market is expected to grow at a CAGR of 13.42% during 2024-2028.

                    Payment Gateways market is segmented by End-user( Large enterprises, Micro and small enterprises, Mid-sized enterprises) Type( Hosted, Non-hosted, APAC, South America, MEA)

                    Adyen NV, Amazon.com Inc., B2Broker Ltd., BitPay Inc., Block Inc., CCBill LLC, Fidelity National Information Services Inc., Global Payments Inc., Infibeam Avenues Ltd., Ingenico Group SA, JPMorgan Chase and Co., Mastercard Inc., MIH PayU BV, One97 Communications Ltd., Payoneer Global Inc., PayPal Holdings Inc., Razorpay Software Pvt. Ltd., Stripe Inc., VeriFone Inc., Visa Inc. are a few of the key vendors in the Payment Gateways market.

                    APAC will register the highest growth rate of 30% among the other regions. Therefore, the Payment Gateways market in APAC is expected to garner significant business opportunities for the vendors during the forecast period.

                    China, US, Japan, UK, Germany

                    • High adoption of contactless payment solutionsThe introduction of mobile payment gateways is the driving factor this market.
                    • such as Apple Pay is the driving factor this market.
                    • Samsung Pay is the driving factor this market.
                    • and Android Pay is the driving factor this market.
                    • has simplified the process of paying bills. Customers are no longer required to carry credit or debit cards. Several retail outlets make use of PoS terminals for payment of the purchases made by consumers. PoS terminal is a portable device that can accept and process payments over Wi-Fi and printout receipts. One of the main reasons for big players to offer the NFC-based mobile payment option is the security feature is the driving factor this market.
                    • which prevents the consumer and retailer from accessing the card information or security code illegitimately. Users are initially required to save their financial data on their smartphones. They can conduct transactions by bringing the phone closer to the vendor's contactless payment-capable PoS system. Once a connection has been established is the driving factor this market.
                    • users can approve the transaction by scanning their fingerprints or entering a password. The increased adoption of mobile devices and wearables has popularized the use of mobile payments. Many retailers are adopting platforms such as NFC PoS terminals that facilitate mobile payments. NFC PoS terminals also boost the value and effectiveness of the marketing efforts of retailers. The process of streamlining operations helps retailers generate more revenue. Retailers worldwide are realizing the benefits of NFC PoS terminals and are aligning these terminals with their operations and processes to enhance the overall relationship between their respective brands and customers. The high adoption of contactless EMV cards will likely encourage the implementation of NFC PoS terminals. The growing need for faster checkouts at retail outlets is the driving factor this market.
                    • high adoption of EMV cards is the driving factor this market.
                    • effective information management among retailers is the driving factor this market.
                    • and the increased focus on secure payments are factors that contribute to the growth of the global payment gateway market. The growing adoption of NFC-enabled mobile payment solutions is expected to drive the market during the forecast period. The availability of contactless payment PoS terminals and payment options will also contribute to market growth. The evolution of technology and the availability of NFC-based devices have further expanded the consumer base for NFC transactions and payment gateways in retail or brick-and-mortar stores. Hence is the driving factor this market.
                    • the adoption of contactless payment gateways is expected to drive the growth of the market in focus during the forecast period. is the driving factor this market.

                    The Payment Gateways market vendors should focus on grabbing business opportunities from the Large enterprises segment as it accounted for the largest market share in the base year.