Online Footwear Market Analysis APAC, North America, Europe, South America, Middle East and Africa - China, US, India, Germany, Indonesia - Size and Forecast 2024-2028

Online Footwear Market Analysis APAC, North America, Europe, South America, Middle East and Africa - China, US, India, Germany, Indonesia - Size and Forecast 2024-2028

Published: Aug 2024 172 Pages SKU: IRTNTR71768

Market Overview at a Glance

$32.5 B
Market Opportunity
8.08%
CAGR
7.3
YoY growth 2023-2024(%)

Online Footwear Market Size 2024-2028

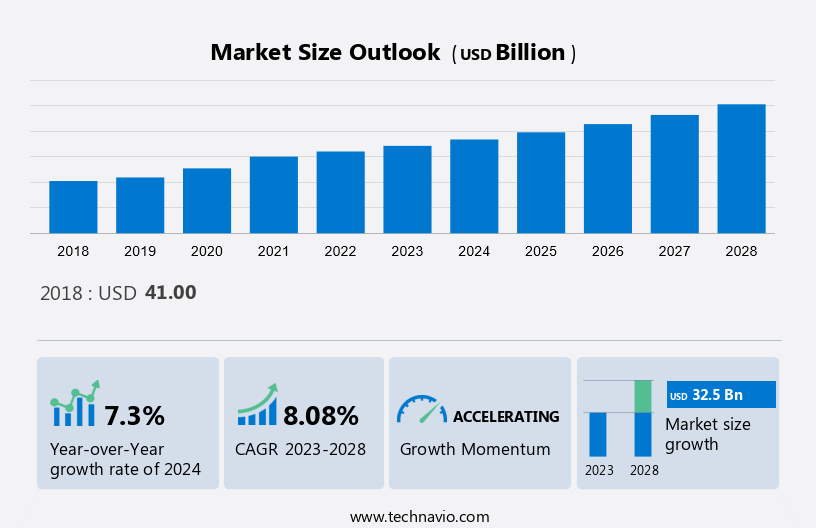
The online footwear market is forecast to increase by USD 32.5 billion and is estimated to grow at a CAGR of 8.08% between 2023 and 2028. The market is experiencing significant growth, driven by several key trends and factors. One major factor is the increasing popularity of digital payment systems, which facilitate seamless transactions and enhance customer convenience. Another trend is the rising adoption of omnichannel retailing, allowing consumers to shop for footwear across multiple channels, both online and offline. However, the market also faces challenges, such as the presence of counterfeit products, which can negatively impact brand reputation and consumer trust. Athletic Footwear is further segmented into running shoes, sports shoes, aerobic shoes, and trekking shoes. To mitigate this issue, market players are investing in advanced technologies like blockchain and AI to ensure authenticity and transparency in their supply chains. Overall, the market is poised for continued growth, fueled by these trends and the increasing preference for online shopping.

What will be the size of the Market During the Forecast Period?

Online Footwear Market Size

To learn more about this report, Download Report Sample

Market Dynamics and Customer Landscape

The Market encompasses a wide range of footwear categories, including Leather Footwear, Athletic Footwear, Casual Shoes, and Vegan Footwear. Recycled materials like Recycled car tires and Recycled carpet padding are increasingly being used in the production of footwear, adding to the market's sustainability quotient. Cotton and Plantdyed leather are popular choices for convenient footwear, catering to both fashion and comfort needs. Online Footwear Market has experienced significant growth due to the convenience it offers. The market includes Private Label Brands, Women's and Men's footwear, and is propelled by the Athletic Shoe Industry and Online Retailing. Credit Card and Online Banking facilitate seamless transactions, further boosting the market. Fast Fashion Trends influence consumer preferences, leading to an increase in demand for various footwear styles. However, the market also faces challenges from Counterfeit Footwear Products. Overall, the  Market continues to evolve, offering diverse choices to consumers. Our researchers analyzed the data with 2023 as the base year, along with the key drivers, trends, and challenges. A holistic analysis of drivers will help companies refine their marketing strategies to gain a competitive advantage.

Key Market Driver

The rising popularity of digital payment systems is a key factor driving the growth of the E-commerce footwear market. The availability of a wide range of merchandise, online payment options, online tracking of shipments, 24/7 customer support, larger Internet reach, and cheaper costs have increased the demand for online shopping. Currently, customers have several payment options, such as credit cards, cash-on-delivery (COD), Internet banking accounts, demand drafts, and cash-on-order. Consumers also rely on payment service providers such as PayPal, which allows them to pay without revealing their personal information.

Moreover, digital payment services allow consumers to make payments at the point of sale through a mobile device. The transactions can be completed in a few steps on the phone.

Significant Market Trend

The advent of smart and customized footwear is the primary trend in the global market growth. Smart and customized shoes are trending in the market. Customization and personalization are key strategies that vendors have been adopting to diversify their product portfolio. The introduction of innovative and technically advanced smart and customizable footwear also attracts and motivates consumers to invest in them. Smart footwear, such as step-counting shoes, is gaining popularity among consumers engaged in athletic and fitness activities.

In January 2018, Under Armour launched UA HOVR Phantom Connected shoes that tracks, analyzes, and store virtual information about running metric. Therefore, the high level of customization and increased demand for innovative footwear will propel the growth of the E-commerce footwear market during the forecast period.

Major Market Challenge

The presence of counterfeit products is a major challenge to the growth of the market. Over the past few years, counterfeits of leading women's footwear brands have flooded the market. These products use original brand names and are priced lower than the original products to attract customers. Therefore, counterfeit products are causing a considerable dent in the market shares of leading popular brands by damaging their reputations. However, these products are not long-lasting because they are made of poor-quality raw materials. Sometimes the low quality of nylon and polyester can affect consumers who have sensitive skin and are prone to allergies.

Moreover, China is a key source of counterfeit products, which are shipped to developed markets such as the US, the UK, Japan, South Korea, and Germany, and to emerging markets such as Brazil and India, where they are primarily sold online. For instance, according to the Organization for Economic Co-operation and Development (OECD), the footwear industry is the second-largest market in the top trade of counterfeit goods. This is expected to hamper the growth of the market during the forecast period.

 Market Customer Landscape

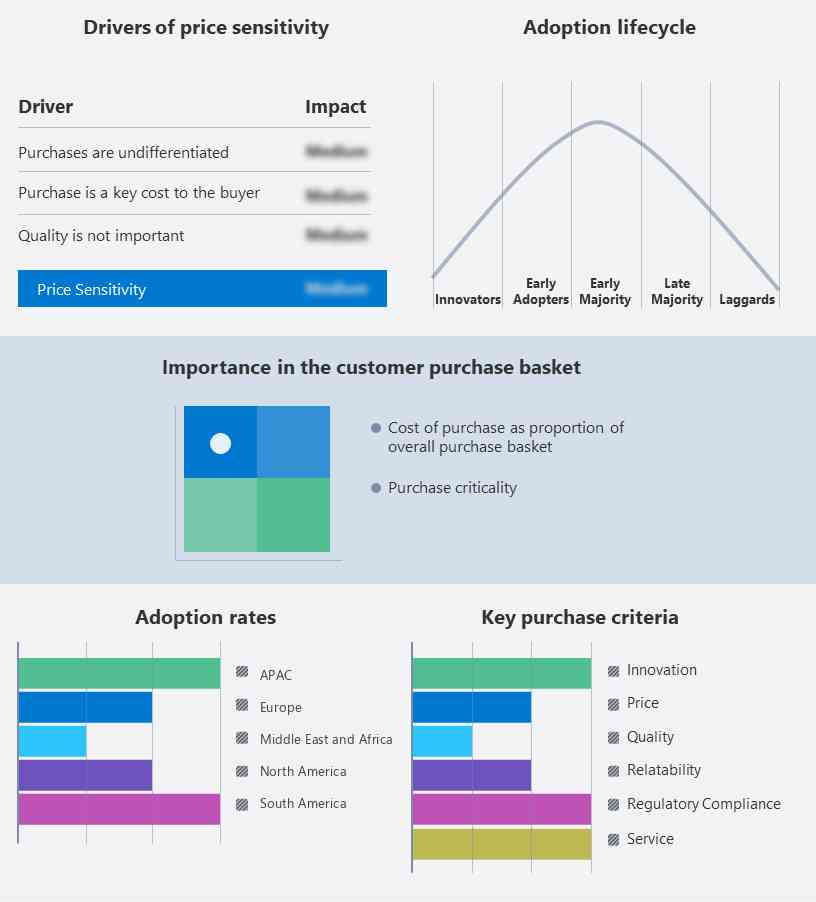
The report includes the adoption lifecycle of the market, covering from the innovator's stage to the laggard's stage. It focuses on adoption rates in different regions based on penetration. Furthermore, the report also includes key purchase criteria and drivers of price sensitivity to help companies evaluate and develop their growth strategies.

Online Footwear Market Share by Geography

Market Customer Landscape

Who are the Major Market Players?

Companies are implementing various strategies, such as strategic alliances, partnerships, mergers and acquisitions, geographical expansion, and product/service launches, to enhance their presence in the market.

Bata - The company offers online footwear under the brand's Power, North Star, and Bubble Gummers. Also, the company offers footwear, bags, and apparel.

The report also includes detailed analyses of the competitive landscape of the market and information about 15 market players, including:

  • adidas AG
  • Alibaba Group Holding Ltd.
  • Amazon.com Inc.
  • Clarks Reliance Footwear Pvt. Ltd.
  • Dolce and Gabbana S.r.l.
  • eBay Inc.
  • Fila Holdings Corp
  • Flipkart Internet Pvt. Ltd.
  • Geox Spa
  • Kohls Corp.
  • Macys Inc.
  • Michael Kors Switzerland GmbH
  • Net Distribution Services Pvt. Ltd.
  • New Balance Athletics Inc.
  • Nike Inc.

Qualitative and quantitative analysis of companies has been conducted to help clients understand the wider business environment as well as the strengths and weaknesses of key market players. Data is qualitatively analyzed to categorize vendors as pure play, category-focused, industry-focused, and diversified; it is quantitatively analyzed to categorize vendors as dominant, leading, strong, tentative, and weak.

What is the Fastest-Growing Segment in the Market?

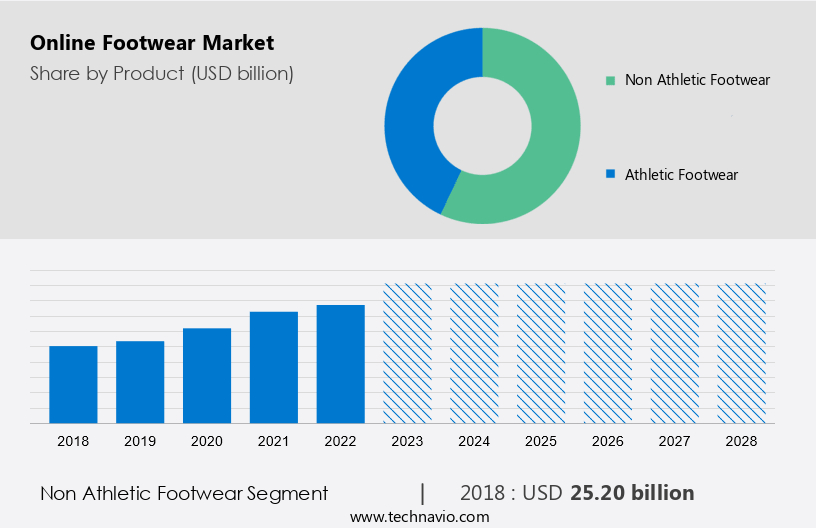
The market share growth by the non athletic footwear segment will be significant during the forecast period. The market segment includes casual, fancy, and formal/office footwear. The growth of the global market by non-athletic footwear is because of the rising demand for products from this category globally.

Online Footwear Market Size

Get a glance at the market contribution of various segments Request a PDF Sample

The non-athletic footwear segment was valued at USD 25.20 billion in 2018 and continued to grow by 2022. The global market for non-athletic footwear is expected to grow during the forecast period. This is mostly because of the high demand for non-athletic footwear compared with athletic footwear. The demand for trendy non-athletic footwear from Generation Z and millennials, backed by the rise of eCommerce companies, will drive the growth of the market segment during the forecast period. The high demand for leather footwear for formal and official purposes is further strengthening the growth of the market. For instance, the size of the leather footwear market in India is expected to double during the forecast period compared with 2020. This is expected to strengthen the growth of the global market by non-athletic footwear during the forecast period.

Which are the Key Regions for the Market?

Online Footwear Market Share by Geography

For more insights on the market share of various regions Request PDF Sample now!

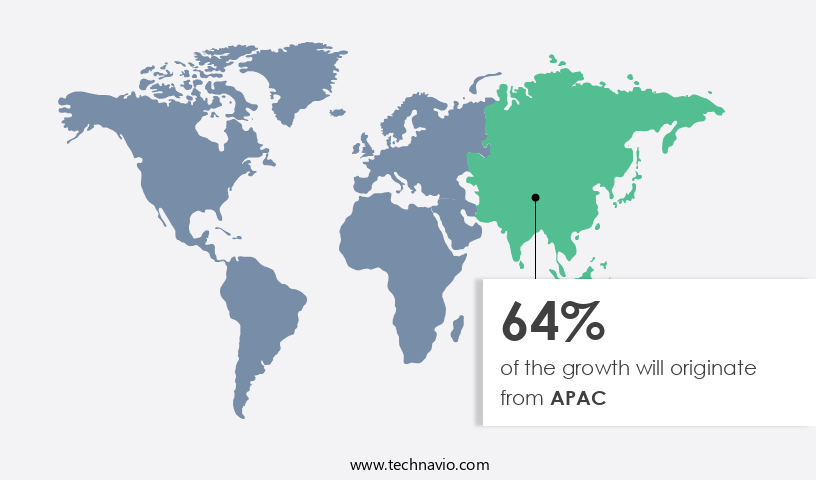
APAC is estimated to contribute 64% to the growth of the global market during the forecast period. Technavio's analysts have elaborately explained the regional trends and drivers that shape the market during the forecast period. APAC is experiencing the fastest CAGR with respect to revenue in the market due to rising urbanization, which has prompted people to adopt different lifestyles and cultures. Steady economic development in countries such as Australia, New Zealand, Japan, China, India, Singapore, Malaysia, Vietnam, and South Korea has improved the purchasing power of consumers who are now willing to spend more on lifestyle products. Furthermore, the rapidly increasing rate of urbanization in APAC is driving the growth of the market; this results in increasing dual household income that enhances the purchasing power of people for recreational activities. Besides, APAC will maintain the highest growth during the forecasted period due to the high population, online retail growth, increased disposable income, a wide array of product offerings, and growth in online retail. China and India are the most populous countries in the world and are expected to be the major markets for the market by volume during the forecast period.

Segment Overview

The market research report provides comprehensive data (region wise segment analysis), with forecasts and estimates in "USD Billion" for the period 2024 to 2028, as well as historical data from 2018 to 2022 for the following segments.
 

  • Product Outlook
    • Non-athletic footwear
    • Athletic footwear
  • End-User Outlook
    • Men
    • Women
    • Children
  • Region Outlook
    • North America
      • The U.S.
      • Canada
    • Europe
      • The U.K.
      • Germany
      • France
      • Rest of Europe
    • APAC
      • China
      • India
    • South America
      • Chile
      • Argentina
    • Middle East & Africa
      • Saudi Arabia
      • South Africa
      • Rest of the Middle East & Africa

Market Analyst Overview

The  Market is witnessing significant growth due to the increasing popularity of convenient footwear shopping online. This market includes various categories such as Leather Footwear, Athletic Footwear, Casual Shoes, and Vegan Footwear. Athletic Footwear, including running shoes, sports shoes, and aerobic shoes, is a major segment due to the Fast Fashion Trend and the Athleisure Footwear craze. Key materials used in the production of footwear are Recycled car tires, Recycled carpet padding, Cotton, Plantdyed leather, and Renewable Materials. Consumers' preference for Sustainable Materials and Fashion Trends is driving the market. Ecommerce platforms like Online Retailing, Credit card, Online banking, and Mobile wallets, smartphone have made purchasing footwear more accessible. Private Label Brands are also gaining popularity in this sector. However, the market faces challenges from Counterfeit Footwear Products. The Athletic Shoe Industry is a significant contributor to the market's growth. Consumer Trends favor Comfortable Footwear and Stylish Footwear, driving demand for High End Brands. The market is expected to continue its growth trajectory, with continuous innovation and consumer preferences shaping its future.

Market Scope

Report Coverage

Details

Page number

172

Base year

2023

Historic period

2018 - 2022

Forecast period

2024-2028

Growth momentum & CAGR

Accelerate at a CAGR of 8.08%

Market growth 2024-2028

USD 32.5 billion

Market structure

Fragmented

YoY growth 2023-2024(%)

7.3

Regional analysis

APAC, North America, Europe, South America, and Middle East and Africa

Performing market contribution

APAC at 64%

Key countries

China, US, India, Germany, and Indonesia

Competitive landscape

Leading Companies, Market Positioning of Companies, Competitive Strategies, and Industry Risks

Key companies profiled

Adidas AG, Alibaba Group Holding Ltd., Amazon.com Inc., Bata, Clarks Reliance Footwear Pvt. Ltd., Dolce and Gabbana S.r.l., eBay Inc., Fila Holdings Corp., Flipkart Internet Pvt. Ltd., Geox S.p.A, Kohls Inc, Macys Inc., Michael Kors Switzerland GmbH, Net Distribution Services Pvt. Ltd., New Balance Athletics Inc., Nike Inc., Pentland Brands Ltd., PUMA SE, VALENTINO Spa, and VF Corp.

Market dynamics

Parent market analysis, market trends, market growth analysis, market research and growth, market forecasting, market forecast, Market growth inducers and obstacles, Fast-growing and slow-growing segment analysis, Market growth and Forecasting, COVID 19 impact and recovery analysis and future consumer dynamics, Market condition analysis for forecast period

Customization purview

If our report has not included the data that you are looking for, you can reach out to our analysts and get segments customized.

Request PDF sample

What are the Key Data Covered in this Market Report?

  • CAGR of the market during the forecast period
  • Detailed information on factors that will drive the growth of the market between 2023 and 2028.
  • Precise estimation of the size of the market size and its contribution to the parent market
  • Accurate predictions about upcoming trends and changes in consumer behavior
  • Growth of the market industry across APAC, North America, Europe, South America, and Middle East and Africa
  • Thorough analysis of the market's competitive landscape and detailed information about vendors
  • Comprehensive analysis of factors that will challenge the growth of market players

We can help! Our analysts can customize this report to meet your requirements. Get in touch

1 Executive Summary

  • 1.1 Market overview
    • Executive Summary - Chart on Market Overview
    • Executive Summary - Data Table on Market Overview
    • Executive Summary - Chart on Global Market Characteristics
    • Executive Summary - Chart on Market by Geography
    • Executive Summary - Chart on Market Segmentation by Product
    • Executive Summary - Chart on Market Segmentation by End-user
    • Executive Summary - Chart on Incremental Growth
    • Executive Summary - Data Table on Incremental Growth
    • Executive Summary - Chart on Company Market Positioning

2 Market Landscape

  • 2.1 Market ecosystem
    • Parent Market
    • Data Table on - Parent Market
  • 2.2 Market characteristics
    • Market characteristics analysis
  • 2.3 Value chain analysis
    • Value Chain Analysis

3 Market Sizing

  • 3.1 Market definition
    • Offerings of companies included in the market definition
  • 3.2 Market segment analysis
    • Market segments
  • 3.3 Market size 2023
    • 3.4 Market outlook: Forecast for 2023-2028
      • Chart on Global - Market size and forecast 2023-2028 ($ billion)
      • Data Table on Global - Market size and forecast 2023-2028 ($ billion)
      • Chart on Global Market: Year-over-year growth 2023-2028 (%)
      • Data Table on Global Market: Year-over-year growth 2023-2028 (%)

    4 Historic Market Size

    • 4.1 Global Online Footwear Market 2018 - 2022
      • Historic Market Size - Data Table on Global Online Footwear Market 2018 - 2022 ($ billion)
    • 4.2 Product segment analysis 2018 - 2022
      • Historic Market Size - Product Segment 2018 - 2022 ($ billion)
    • 4.3 End-user segment analysis 2018 - 2022
      • Historic Market Size - End-user Segment 2018 - 2022 ($ billion)
    • 4.4 Geography segment analysis 2018 - 2022
      • Historic Market Size - Geography Segment 2018 - 2022 ($ billion)
    • 4.5 Country segment analysis 2018 - 2022
      • Historic Market Size - Country Segment 2018 - 2022 ($ billion)

    5 Five Forces Analysis

    • 5.1 Five forces summary
      • Five forces analysis - Comparison between 2023 and 2028
    • 5.2 Bargaining power of buyers
      • Bargaining power of buyers - Impact of key factors 2023 and 2028
    • 5.3 Bargaining power of suppliers
      • Bargaining power of suppliers - Impact of key factors in 2023 and 2028
    • 5.4 Threat of new entrants
      • Threat of new entrants - Impact of key factors in 2023 and 2028
    • 5.5 Threat of substitutes
      • Threat of substitutes - Impact of key factors in 2023 and 2028
    • 5.6 Threat of rivalry
      • Threat of rivalry - Impact of key factors in 2023 and 2028
    • 5.7 Market condition
      • Chart on Market condition - Five forces 2023 and 2028

    6 Market Segmentation by Product

    • 6.1 Market segments
      • Chart on Product - Market share 2023-2028 (%)
      • Data Table on Product - Market share 2023-2028 (%)
    • 6.2 Comparison by Product
      • Chart on Comparison by Product
      • Data Table on Comparison by Product
    • 6.3 Non athletic footwear - Market size and forecast 2023-2028
      • Chart on Non athletic footwear - Market size and forecast 2023-2028 ($ billion)
      • Data Table on Non athletic footwear - Market size and forecast 2023-2028 ($ billion)
      • Chart on Non athletic footwear - Year-over-year growth 2023-2028 (%)
      • Data Table on Non athletic footwear - Year-over-year growth 2023-2028 (%)
    • 6.4 Athletic footwear - Market size and forecast 2023-2028
      • Chart on Athletic footwear - Market size and forecast 2023-2028 ($ billion)
      • Data Table on Athletic footwear - Market size and forecast 2023-2028 ($ billion)
      • Chart on Athletic footwear - Year-over-year growth 2023-2028 (%)
      • Data Table on Athletic footwear - Year-over-year growth 2023-2028 (%)
    • 6.5 Market opportunity by Product
      • Market opportunity by Product ($ billion)
      • Data Table on Market opportunity by Product ($ billion)

    7 Market Segmentation by End-user

    • 7.1 Market segments
      • Chart on End-user - Market share 2023-2028 (%)
      • Data Table on End-user - Market share 2023-2028 (%)
    • 7.2 Comparison by End-user
      • Chart on Comparison by End-user
      • Data Table on Comparison by End-user
    • 7.3 Men - Market size and forecast 2023-2028
      • Chart on Men - Market size and forecast 2023-2028 ($ billion)
      • Data Table on Men - Market size and forecast 2023-2028 ($ billion)
      • Chart on Men - Year-over-year growth 2023-2028 (%)
      • Data Table on Men - Year-over-year growth 2023-2028 (%)
    • 7.4 Women - Market size and forecast 2023-2028
      • Chart on Women - Market size and forecast 2023-2028 ($ billion)
      • Data Table on Women - Market size and forecast 2023-2028 ($ billion)
      • Chart on Women - Year-over-year growth 2023-2028 (%)
      • Data Table on Women - Year-over-year growth 2023-2028 (%)
    • 7.5 Children - Market size and forecast 2023-2028
      • Chart on Children - Market size and forecast 2023-2028 ($ billion)
      • Data Table on Children - Market size and forecast 2023-2028 ($ billion)
      • Chart on Children - Year-over-year growth 2023-2028 (%)
      • Data Table on Children - Year-over-year growth 2023-2028 (%)
    • 7.6 Market opportunity by End-user
      • Market opportunity by End-user ($ billion)
      • Data Table on Market opportunity by End-user ($ billion)

    8 Customer Landscape

    • 8.1 Customer landscape overview
      • Analysis of price sensitivity, lifecycle, customer purchase basket, adoption rates, and purchase criteria

    9 Geographic Landscape

    • 9.1 Geographic segmentation
      • Chart on Market share by geography 2023-2028 (%)
      • Data Table on Market share by geography 2023-2028 (%)
    • 9.2 Geographic comparison
      • Chart on Geographic comparison
      • Data Table on Geographic comparison
    • 9.3 APAC - Market size and forecast 2023-2028
      • Chart on APAC - Market size and forecast 2023-2028 ($ billion)
      • Data Table on APAC - Market size and forecast 2023-2028 ($ billion)
      • Chart on APAC - Year-over-year growth 2023-2028 (%)
      • Data Table on APAC - Year-over-year growth 2023-2028 (%)
    • 9.4 North America - Market size and forecast 2023-2028
      • Chart on North America - Market size and forecast 2023-2028 ($ billion)
      • Data Table on North America - Market size and forecast 2023-2028 ($ billion)
      • Chart on North America - Year-over-year growth 2023-2028 (%)
      • Data Table on North America - Year-over-year growth 2023-2028 (%)
    • 9.5 Europe - Market size and forecast 2023-2028
      • Chart on Europe - Market size and forecast 2023-2028 ($ billion)
      • Data Table on Europe - Market size and forecast 2023-2028 ($ billion)
      • Chart on Europe - Year-over-year growth 2023-2028 (%)
      • Data Table on Europe - Year-over-year growth 2023-2028 (%)
    • 9.6 South America - Market size and forecast 2023-2028
      • Chart on South America - Market size and forecast 2023-2028 ($ billion)
      • Data Table on South America - Market size and forecast 2023-2028 ($ billion)
      • Chart on South America - Year-over-year growth 2023-2028 (%)
      • Data Table on South America - Year-over-year growth 2023-2028 (%)
    • 9.7 Middle East and Africa - Market size and forecast 2023-2028
      • Chart on Middle East and Africa - Market size and forecast 2023-2028 ($ billion)
      • Data Table on Middle East and Africa - Market size and forecast 2023-2028 ($ billion)
      • Chart on Middle East and Africa - Year-over-year growth 2023-2028 (%)
      • Data Table on Middle East and Africa - Year-over-year growth 2023-2028 (%)
    • 9.8 China - Market size and forecast 2023-2028
      • Chart on China - Market size and forecast 2023-2028 ($ billion)
      • Data Table on China - Market size and forecast 2023-2028 ($ billion)
      • Chart on China - Year-over-year growth 2023-2028 (%)
      • Data Table on China - Year-over-year growth 2023-2028 (%)
    • 9.9 US - Market size and forecast 2023-2028
      • Chart on US - Market size and forecast 2023-2028 ($ billion)
      • Data Table on US - Market size and forecast 2023-2028 ($ billion)
      • Chart on US - Year-over-year growth 2023-2028 (%)
      • Data Table on US - Year-over-year growth 2023-2028 (%)
    • 9.10 India - Market size and forecast 2023-2028
      • Chart on India - Market size and forecast 2023-2028 ($ billion)
      • Data Table on India - Market size and forecast 2023-2028 ($ billion)
      • Chart on India - Year-over-year growth 2023-2028 (%)
      • Data Table on India - Year-over-year growth 2023-2028 (%)
    • 9.11 Germany - Market size and forecast 2023-2028
      • Chart on Germany - Market size and forecast 2023-2028 ($ billion)
      • Data Table on Germany - Market size and forecast 2023-2028 ($ billion)
      • Chart on Germany - Year-over-year growth 2023-2028 (%)
      • Data Table on Germany - Year-over-year growth 2023-2028 (%)
    • 9.12 Indonesia - Market size and forecast 2023-2028
      • Chart on Indonesia - Market size and forecast 2023-2028 ($ billion)
      • Data Table on Indonesia - Market size and forecast 2023-2028 ($ billion)
      • Chart on Indonesia - Year-over-year growth 2023-2028 (%)
      • Data Table on Indonesia - Year-over-year growth 2023-2028 (%)
    • 9.13 Market opportunity by geography
      • Market opportunity by geography ($ billion)
      • Data Tables on Market opportunity by geography ($ billion)

    10 Drivers, Challenges, and Opportunity/Restraints

    • 10.1 Market drivers
      • 10.2 Market challenges
        • 10.3 Impact of drivers and challenges
          • Impact of drivers and challenges in 2023 and 2028
        • 10.4 Market opportunities/restraints

          11 Competitive Landscape

          • 11.1 Overview
            • 11.2 Competitive Landscape
              • Overview on criticality of inputs and factors of differentiation
            • 11.3 Landscape disruption
              • Overview on factors of disruption
            • 11.4 Industry risks
              • Impact of key risks on business

            12 Competitive Analysis

            • 12.1 Companies profiled
              • Companies covered
            • 12.2 Market positioning of companies
              • Matrix on companies position and classification
            • 12.3 Adidas AG
              • Adidas AG - Overview
              • Adidas AG - Business segments
              • Adidas AG - Key news
              • Adidas AG - Key offerings
              • Adidas AG - Segment focus
            • 12.4 Alibaba Group Holding Ltd.
              • Alibaba Group Holding Ltd. - Overview
              • Alibaba Group Holding Ltd. - Business segments
              • Alibaba Group Holding Ltd. - Key news
              • Alibaba Group Holding Ltd. - Key offerings
              • Alibaba Group Holding Ltd. - Segment focus
            • 12.5 Amazon.com Inc.
              • Amazon.com Inc. - Overview
              • Amazon.com Inc. - Business segments
              • Amazon.com Inc. - Key news
              • Amazon.com Inc. - Key offerings
              • Amazon.com Inc. - Segment focus
            • 12.6 Bata
              • Bata - Overview
              • Bata - Product / Service
              • Bata - Key offerings
            • 12.7 Clarks Reliance Footwear Pvt. Ltd.
              • Clarks Reliance Footwear Pvt. Ltd. - Overview
              • Clarks Reliance Footwear Pvt. Ltd. - Product / Service
              • Clarks Reliance Footwear Pvt. Ltd. - Key offerings
            • 12.8 eBay Inc.
              • eBay Inc. - Overview
              • eBay Inc. - Product / Service
              • eBay Inc. - Key news
              • eBay Inc. - Key offerings
            • 12.9 Fila Holdings Corp.
              • Fila Holdings Corp. - Overview
              • Fila Holdings Corp. - Product / Service
              • Fila Holdings Corp. - Key offerings
            • 12.10 Flipkart Internet Pvt. Ltd.
              • Flipkart Internet Pvt. Ltd. - Overview
              • Flipkart Internet Pvt. Ltd. - Product / Service
              • Flipkart Internet Pvt. Ltd. - Key offerings
            • 12.11 Geox S.p.A
              • Geox S.p.A - Overview
              • Geox S.p.A - Business segments
              • Geox S.p.A - Key offerings
              • Geox S.p.A - Segment focus
            • 12.12 Kohls Inc
              • Kohls Inc - Overview
              • Kohls Inc - Product / Service
              • Kohls Inc - Key news
              • Kohls Inc - Key offerings
            • 12.13 New Balance Athletics Inc.
              • New Balance Athletics Inc. - Overview
              • New Balance Athletics Inc. - Product / Service
              • New Balance Athletics Inc. - Key news
              • New Balance Athletics Inc. - Key offerings
            • 12.14 Nike Inc.
              • Nike Inc. - Overview
              • Nike Inc. - Business segments
              • Nike Inc. - Key news
              • Nike Inc. - Key offerings
              • Nike Inc. - Segment focus
            • 12.15 PUMA SE
              • PUMA SE - Overview
              • PUMA SE - Business segments
              • PUMA SE - Key news
              • PUMA SE - Key offerings
              • PUMA SE - Segment focus
            • 12.16 VALENTINO Spa
              • VALENTINO Spa - Overview
              • VALENTINO Spa - Product / Service
              • VALENTINO Spa - Key offerings
            • 12.17 VF Corp.
              • VF Corp. - Overview
              • VF Corp. - Business segments
              • VF Corp. - Key news
              • VF Corp. - Key offerings
              • VF Corp. - Segment focus

            13 Appendix

            • 13.1 Scope of the report
              • 13.2 Inclusions and exclusions checklist
                • Inclusions checklist
                • Exclusions checklist
              • 13.3 Currency conversion rates for US$
                • Currency conversion rates for US$
              • 13.4 Research methodology
                • Research methodology
              • 13.5 Data procurement
                • Information sources
              • 13.6 Data validation
                • Data validation
              • 13.7 Validation techniques employed for market sizing
                • Validation techniques employed for market sizing
              • 13.8 Data synthesis
                • Data synthesis
              • 13.9 360 degree market analysis
                • 360 degree market analysis
              • 13.10 List of abbreviations
                • List of abbreviations

              Research Methodology

              Technavio presents a detailed picture of the market by way of study, synthesis, and summation of data from multiple sources. The analysts have presented the various facets of the market with a particular focus on identifying the key industry influencers. The data thus presented is comprehensive, reliable, and the result of extensive research, both primary and secondary.

              INFORMATION SOURCES

              Primary sources

              • Manufacturers and suppliers
              • Channel partners
              • Industry experts
              • Strategic decision makers

              Secondary sources

              • Industry journals and periodicals
              • Government data
              • Financial reports of key industry players
              • Historical data
              • Press releases

              DATA ANALYSIS

              Data Synthesis

              • Collation of data
              • Estimation of key figures
              • Analysis of derived insights

              Data Validation

              • Triangulation with data models
              • Reference against proprietary databases
              • Corroboration with industry experts

              REPORT WRITING

              Qualitative

              • Market drivers
              • Market challenges
              • Market trends
              • Five forces analysis

              Quantitative

              • Market size and forecast
              • Market segmentation
              • Geographical insights
              • Competitive landscape

              Interested in this report?

              Get your sample now to see our research methodology and insights!

              Download Now

              Frequently Asked Questions

              Online Footwear market growth will increase by $ 32.5 bn during 2024-2028 .

              The Online Footwear market is expected to grow at a CAGR of 8.08% during 2024-2028 .

              Online Footwear market is segmented by Product( Non athletic footwear, Athletic footwear) End-user( Men, Women, Children, South America, MEA)

              Adidas AG, Alibaba Group Holding Ltd., Amazon.com Inc., Bata, Clarks Reliance Footwear Pvt. Ltd., Dolce and Gabbana S.r.l., eBay Inc., Fila Holdings Corp., Flipkart Internet Pvt. Ltd., Geox S.p.A, Kohls Inc, Macys Inc., Michael Kors Switzerland GmbH, Net Distribution Services Pvt. Ltd., New Balance Athletics Inc., Nike Inc., Pentland Brands Ltd., PUMA SE, VALENTINO Spa, VF Corp. are a few of the key vendors in the Online Footwear market.

              APAC will register the highest growth rate of 64% among the other regions. Therefore, the Online Footwear market in APAC is expected to garner significant business opportunities for the vendors during the forecast period.

              China, US, India, Germany, Indonesia

              • Rising popularity of digital payment systemsThe availability of a wide range of merchandise is the driving factor this market.
              • online payment options is the driving factor this market.
              • online tracking of shipments is the driving factor this market.
              • 24/7 customer support is the driving factor this market.
              • larger Internet reach is the driving factor this market.
              • and cheaper costs has increased the demand for online shopping. Currently is the driving factor this market.
              • customers have several payment options is the driving factor this market.
              • such as credit cards is the driving factor this market.
              • cash-on-delivery (COD) is the driving factor this market.
              • Internet banking accounts is the driving factor this market.
              • demand drafts is the driving factor this market.
              • and cash-on-order. Consumers also rely on payment service providers such as PayPal is the driving factor this market.
              • which allows them to pay without revealing their personal information. The most popular method of payment is COD. In developing countries like India and China is the driving factor this market.
              • consumers are wary of sharing their debit card or credit card details online is the driving factor this market.
              • particularly with small and less well-known merchants. So is the driving factor this market.
              • retailers offer COD options to build trust among customers and encourage them to shop online.Digital payment services allow consumers to make payments at the point of sale through a mobile device. The transactions can be completed in a few steps on the phone. Large players like Amazon is the driving factor this market.
              • Google is the driving factor this market.
              • MasterCard is the driving factor this market.
              • and PayPal are investing heavily in technology. Digital payment applications are being used innovatively to improve the consumer experience. Mobile wallets such as Apple Pay is the driving factor this market.
              • Android Pay is the driving factor this market.
              • and Samsung Pay will become a standard feature on new smartphones is the driving factor this market.
              • which is the driving factor this market.
              • in turn is the driving factor this market.
              • will increase the growth of mobile payments is the driving factor this market.
              • which will further drive the growth of the global online footwear market during the forecast period. is the driving factor this market.

              The Online Footwear market vendors should focus on grabbing business opportunities from the Non athletic footwear segment as it accounted for the largest market share in the base year.