
Europe Online On-Demand Services Market Size 2025-2029
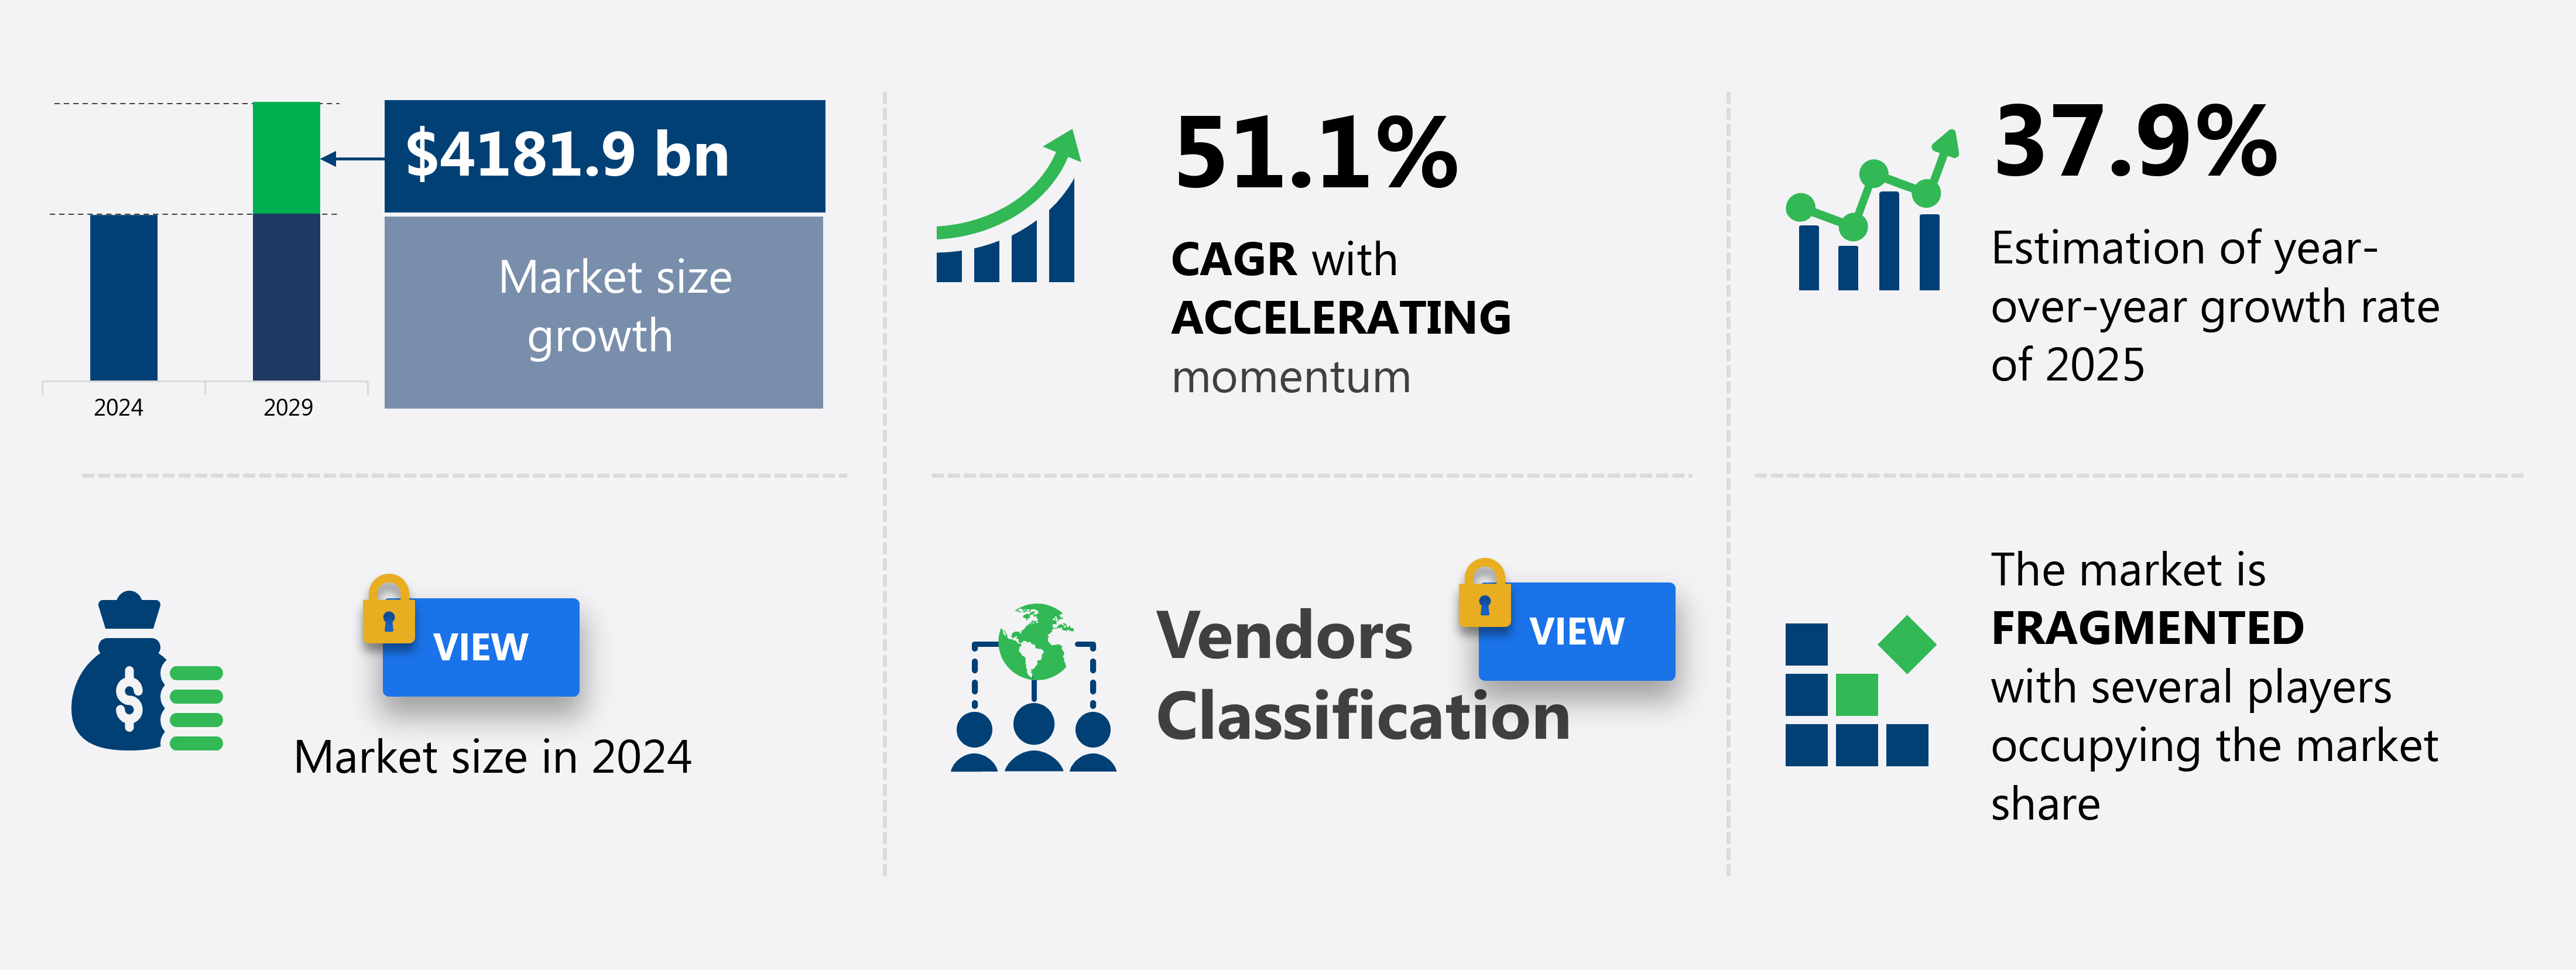
The Europe online on-demand services market size is forecast to increase by USD 4,181.9 billion at a CAGR of 51.1% between 2024 and 2029.
- The Online On-Demand Services Market is experiencing significant growth, driven by the increasing number of advertising and marketing campaigns leveraging these platforms to reach consumers more effectively. The flexibility and convenience offered by on-demand services have made them an indispensable part of modern consumer behavior. However, the market is not without challenges. Regulatory hurdles impact adoption in certain industries, particularly those with stringent data protection regulations. Additionally, supply chain inconsistencies can temper growth potential, as providers must ensure seamless delivery of services to maintain customer satisfaction.
- Moreover, the Internet of Things (IoT) and mobile payments streamline service delivery and user experience. Companies seeking to capitalize on market opportunities and navigate challenges effectively should focus on addressing these issues through robust regulatory compliance and supply chain optimization strategies. By staying agile and responsive to evolving consumer demands and market trends, players in the Online On-Demand Services Market can seize opportunities for innovation and growth.
What will be the size of the Europe Online On-Demand Services Market during the forecast period?
- In the dynamic US business landscape, the on-demand services market continues to evolve, driven by community building and innovation in various sectors. Home services and professional services are revolutionized through peer-to-peer platforms, fostering operational excellence. Shared economy models, such as ride-hailing and food delivery, disrupt traditional industries. Subscription services, including loyalty programs, cater to customer segmentation and pricing models. Emerging technologies like remote work and the gig economy expand the mobile workforce.
- User acquisition relies on growth hacking and social proof, while user-generated content fuels engagement. Future trends include education services, handyman services, healthcare services, and financial services adopting on-demand models. Service level agreements and customer support ensure quality and satisfaction. Company partnerships and innovation pipelines are essential for revenue generation. Task management and flexibility are key to navigating this evolving market.
How is this market segmented?
The market research report provides comprehensive data (region-wise segment analysis), with forecasts and estimates in "USD billion" for the period 2025-2029, as well as historical data from 2019-2023 for the following segments.
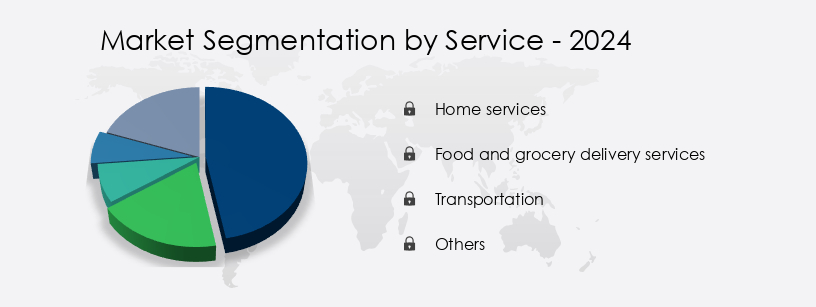
- Service
- Home services
- Food and grocery delivery services
- Transportation
- Others
- Platform
- Mobile
- Web
- Service Type
- Recurring subscriptions
- One-time purchase
- Freemium models
- Geography
- Europe
- Germany
- Sweden
- The Netherlands
- UK
- Europe
By Service Insights
The home services segment is estimated to witness significant growth during the forecast period.
The on-demand services market encompasses a range of sectors, with home services being a significant contributor. This segment includes offerings such as cleaning, laundry, gardening, repair and maintenance, and home security services. Revenues are derived from various home care and design services like interior designing, pest control, deep cleaning, sofa cleaning, glasswork, woodwork, and waterproofing. The market is characterized by a multitude of small and large players, offering diverse home services. Consumer lifestyle shifts and increasing disposable income, particularly in Europe, where the European Union's GDP per capita stands at USD41,422, are driving demand for on-demand home services.
Process optimization and location-based services are crucial elements in the on-demand services industry. Machine learning algorithms and artificial intelligence enable efficient task management, while subscription services cater to customer preferences. Pricing models vary, with freemium and premium options available. The Internet of Things (IoT) and digital transformation are integral to on-demand services, allowing for real-time availability and logistics optimization. Business automation and service booking systems streamline operations, ensuring cost reduction and efficiency gains. Service delivery, customer support, and payment processing are essential components, with service level agreements and privacy compliance ensuring quality and trust. Mobile apps and user interfaces prioritize user experience, while mobile payments facilitate seamless transactions.
Rating systems and big data analysis enable continuous service improvement, with data security and geolocation tracking ensuring customer privacy and satisfaction. Disruptive innovation and competitive advantage are key factors in market penetration, with API integration and social media platforms expanding reach and engagement. Cloud computing and data analytics provide valuable insights for demand forecasting and customer segmentation.
The Home services segment was valued at USD billion in 2019 and showed a gradual increase during the forecast period.
Market Dynamics
Our researchers analyzed the data with 2024 as the base year, along with the key drivers, trends, and challenges. A holistic analysis of drivers will help companies refine their marketing strategies to gain a competitive advantage.
What are the Europe Online On-Demand Services Market market drivers leading to the rise in adoption of the Industry?
- The primary advantage driving the market is the use of online, on-demand services platforms, which offer numerous benefits to users. Online on-demand services refer to digital marketplaces that grant easy access to various offerings, including interior design, painting, packers and movers, home cleaning, pest control, transport, delivery, and cook/maid/driver services. The market for these services is experiencing significant growth due to their unparalleled convenience and accessibility. One of the primary advantages of online on-demand services platforms is their ease of use. Companies provide comprehensive information about a range of services on websites and mobile apps, enabling customers to quickly and efficiently book services that suit their needs. Furthermore, these platforms offer process optimization through features like location-based services, machine learning algorithms for personalized recommendations, and business automation.
- Additionally, online on-demand services contribute to cost reduction and efficiency gains for businesses and consumers. Service booking is streamlined, reducing the need for lengthy phone calls or in-person interactions. Moreover, these platforms ensure service quality assurance through customer reviews and ratings, allowing users to make informed decisions when choosing a service provider. Overall, the online on-demand services market is expected to continue its growth trajectory, offering numerous benefits to both businesses and consumers.
What are the Europe Online On-Demand Services Market market trends shaping the Industry?
- The increasing prevalence of advertising and marketing campaigns represents a significant market trend. This trend reflects the growing importance of effective communication strategies in today's business landscape. The European online on-demand services market is driven by companies' marketing efforts to increase customer awareness and retention. Amazon Home Services, for example, offers a Happiness Guarantee, promising compensation if services fail to meet customer satisfaction. Other marketing strategies include customized services, cashback options, and discounts on initial and frequent orders. These tactics aim to attract and retain customers, contributing significantly to the market's growth during the forecast period. Companies also prioritize user interface and experience, mobile payments, and service level agreements to enhance customer satisfaction.
- Subscription services, customer segmentation, pricing models, and the integration of the Internet of Things further boost the market's expansion. Effective customer support is essential to address any issues promptly and maintain a positive relationship with clients. These factors collectively contribute to the robust growth of the market.
How does Europe Online On-Demand Services Market market faces challenges face during its growth?
- Data and privacy concerns represent a significant challenge to the industry's growth, necessitating robust solutions to protect consumer information while ensuring business continuity. The European online on-demand services market is experiencing substantial growth, driven by the increasing preference for digital platforms offering food delivery, ride-hailing, and streaming services. However, data privacy concerns persist, with stringent regulations like the General Data Protection Regulation (GDPR) mandating explicit user consent for data collection and processing. In 2024, over 1,200 data breaches were reported in the EU, affecting millions of users, emphasizing the importance of robust data security measures. A survey revealed that 71% of consumers would cease doing business with a company following a data breach or mishandling of sensitive information.
- To address these challenges, service providers are integrating digital wallets, social media, and artificial intelligence for seamless payment processing and demand forecasting. Big data and data analytics are also being leveraged to enhance user experience and improve service offerings. Privacy compliance remains a priority, with companies investing in advanced security systems and adhering to industry best practices. The market's digital transformation continues, with the integration of rating systems, ensuring transparency and accountability.
Exclusive Europe Online On-Demand Services Market Customer Landscape
The market forecasting report includes the adoption lifecycle of the market, covering from the innovator's stage to the laggard's stage. It focuses on adoption rates in different regions based on penetration. Furthermore, the report also includes key purchase criteria and drivers of price sensitivity to help companies evaluate and develop their market growth analysis strategies.
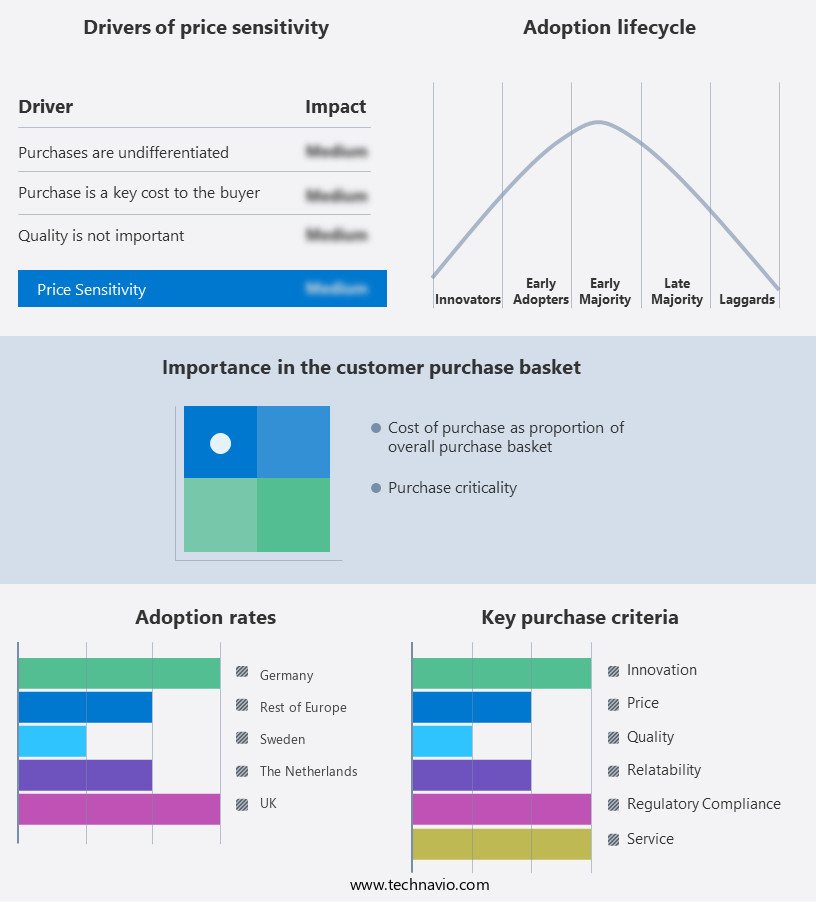
Customer Landscape
Key Companies & Market Insights
Companies are implementing various strategies, such as strategic alliances, market forecast partnerships, mergers and acquisitions, geographical expansion, and product/service launches, to enhance their presence in the market.
The market research and growth report includes detailed analyses of the competitive landscape of the market and information about key companies, including:
- ABM Industries Inc.
- Amazon.com Inc.
- Aramark
- Cleaners of London
- Cleanzy
- Compass Group Plc
- Handy
- Helpling GmbH and Co. KG
- ISS AS
- MAID2CLEAN Ltd.
- Mitie Group plc
- Rentokil Initial Plc
- Sodexo SA
- Sunshine Cleaning Systems Inc.
- Taskrabbit Inc.
- Wecasa
- Yoopies
Qualitative and quantitative analysis of companies has been conducted to help clients understand the wider business environment as well as the strengths and weaknesses of key market players. Data is qualitatively analyzed to categorize companies as pure play, category-focused, industry-focused, and diversified; it is quantitatively analyzed to categorize companies as dominant, leading, strong, tentative, and weak.
Recent Development and News in Online On-Demand Services Market In Europe
- In February 2024, Amazon Prime Video announced the launch of Prime Gaming, a new service that integrates free games, in-game content, and Twitch channel subscriptions for its Prime members, expanding its on-demand offerings beyond video streaming (Amazon PR).
- In October 2024, Microsoft and Netflix entered into a strategic partnership, enabling Microsoft's Xbox gaming consoles to stream Netflix content directly, enhancing the user experience and strengthening Netflix's presence in the gaming industry (Microsoft PR).
- In March 2025, Disney+ secured a significant investment of USD1 billion from Sony Group Corporation, marking one of the largest funding rounds in the on-demand streaming sector, and further solidifying Disney+'s position as a major player in the market (Sony PR).
- In August 2025, Apple TV+, in collaboration with Oprah Winfrey, launched a new original series, "The Oprah Conversation," exclusively on its platform, showcasing Apple's commitment to producing high-quality, exclusive content to attract and retain subscribers (Apple PR).
Research Analyst Overview
In the ever-evolving landscape of on-demand services, customer needs and market trends continue to shape the industry's dynamics. The integration of technology, such as machine learning and artificial intelligence, into on-demand services has led to process optimization and efficiency gains. Location-based services enable real-time availability and geographic targeting, enhancing the user experience. Business automation and task management systems streamline service delivery and help providers meet service level agreements. Subscription services and freemium models offer flexible pricing options, increasing market penetration. User interface and user experience design are crucial elements in ensuring customer satisfaction and retention. Mobile apps and mobile payments have revolutionized on-demand services, allowing for seamless service booking and payment processing.
Big data and data analytics provide valuable insights for demand forecasting and business growth. Digital transformation and API integration enable on-line platforms to offer a wide range of services and partnerships. Cost reduction is a significant factor in the on-demand services market, with providers leveraging cloud computing and the Internet of Things to optimize logistics and reduce operational costs. Service quality assurance and privacy compliance are essential for maintaining customer trust and adhering to regulatory requirements. Rating systems and customer reviews play a critical role in ensuring service quality and driving competition. Social media integration offers opportunities for marketing and customer engagement.
The regulatory scenario, with the EU and Bis setting stringent standards, is driving innovation in the sector. The liquid segment, including liquid fabric softeners and low-foaming detergents, is a significant contributor to the market. Service provider networks and digital wallets provide convenience and ease of use for customers. In the on-demand services market, pricing models and competitive advantage are key differentiators. Providers must continually adapt to changing market trends and customer needs to maintain a competitive edge. The integration of various technologies and business models offers endless opportunities for innovation and growth in this dynamic industry.
Dive into Technavio's robust research methodology, blending expert interviews, extensive data synthesis, and validated models for unparalleled Online On-Demand Services Market in Europe insights. See full methodology.
|
Market Scope |
|
|
Report Coverage |
Details |
|
Page number |
201 |
|
Base year |
2024 |
|
Historic period |
2019-2023 |
|
Forecast period |
2025-2029 |
|
Growth momentum & CAGR |
Accelerate at a CAGR of 51.1% |
|
Market growth 2025-2029 |
USD 4,181.9 billion |
|
Market structure |
Fragmented |
|
YoY growth 2024-2025(%) |
37.9 |
|
Competitive landscape |
Leading Companies, Market Positioning of Companies, Competitive Strategies, and Industry Risks |
What are the Key Data Covered in this Market Research Report?
- CAGR of the market during the forecast period
- Detailed information on factors that will drive the market growth and forecasting between 2025 and 2029
- Precise estimation of the size of the market and its contribution of the market in focus to the parent market
- Accurate predictions about upcoming market growth and trends and changes in consumer behaviour
- Growth of the market across Europe
- Thorough analysis of the market's competitive landscape and detailed information about companies
- Comprehensive analysis of factors that will challenge the growth of market report
We can help! Our analysts can customize this market research report to meet your requirements Get in touch
 RIA -
RIA - 
