
Online Video Platform Market Size 2026-2030
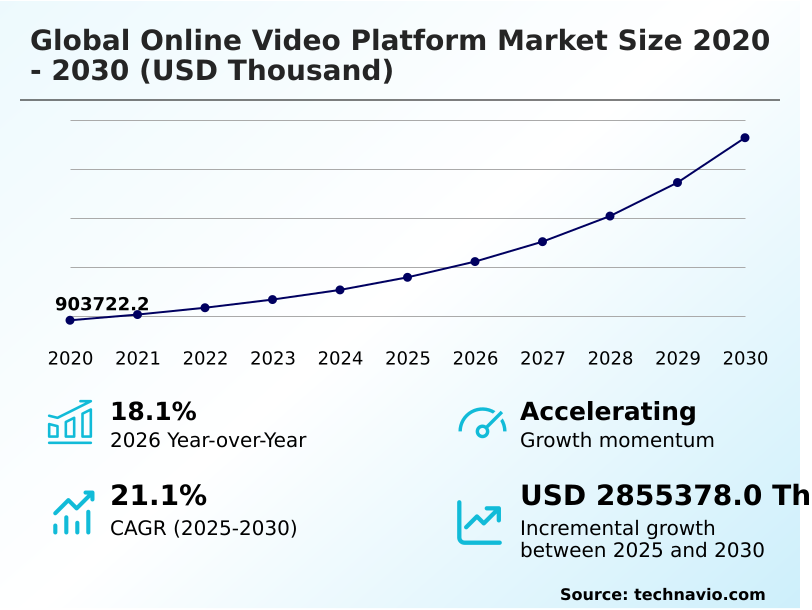
The online video platform market size is valued to increase by USD 2.86 billion, at a CAGR of 21.1% from 2025 to 2030. Generative artificial intelligence and autonomous video production workflows will drive the online video platform market.
Major Market Trends & Insights
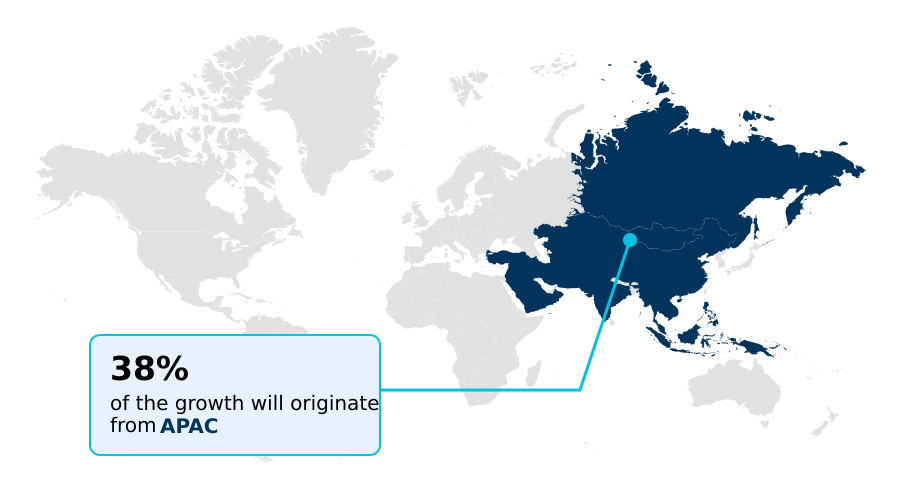
- APAC dominated the market and accounted for a 37.5% growth during the forecast period.
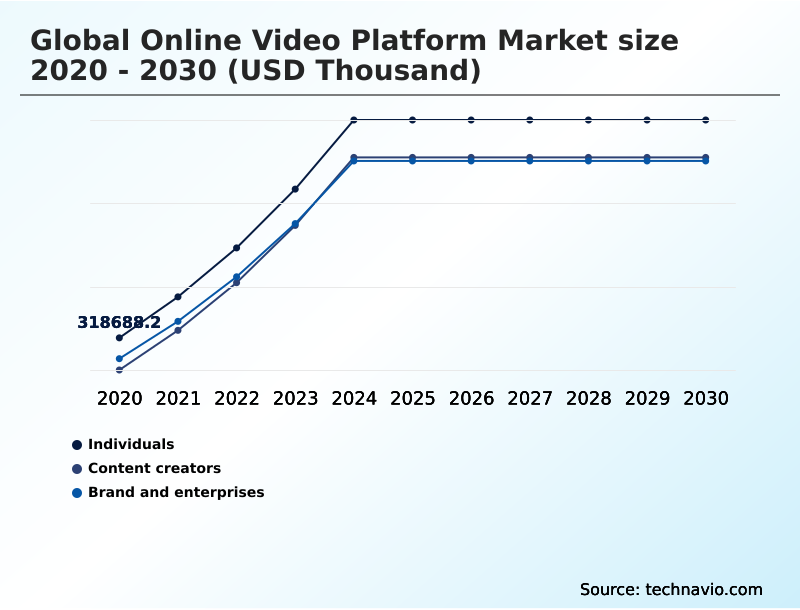
- By End-user - Individuals segment was valued at USD 533.99 million in 2024
- By Type - UGC segment accounted for the largest market revenue share in 2024
Market Size & Forecast
- Market Opportunities:
- Market Future Opportunities: USD 2.86 billion
- CAGR from 2025 to 2030 : 21.1%
Market Summary
- The Online Video Platform Market is evolving from a content distribution utility into a sophisticated, AI-driven ecosystem integral to modern business. This transformation is propelled by the institutionalization of generative AI video production and autonomous production workflows, which enable organizations to create high-volume, localized content efficiently.
- Interactive video ecosystems, powered by live commerce integration, are blurring the lines between entertainment and retail, creating new revenue streams. However, the industry faces challenges in delivering consistent low-latency streaming globally, a critical factor for real-time applications.
- For instance, a multinational corporation leverages a secure video hosting platform for its corporate training programs, using AI-powered video analytics to track employee engagement and tailor immersive learning models. This requires a robust video content management system (VCMS) and adherence to data residency requirements.
- The rise of hybrid monetization models, combining SVOD and AVOD, reflects a strategic response to subscription fatigue and the need for flexible pricing in a competitive landscape.
What will be the Size of the Online Video Platform Market during the forecast period?
Get Key Insights on Market Forecast (PDF) Get Free Sample
How is the Online Video Platform Market Segmented?
The online video platform industry research report provides comprehensive data (region-wise segment analysis), with forecasts and estimates in "USD thousand" for the period 2026-2030, as well as historical data from 2020-2024 for the following segments.
- End-user
- Individuals
- Content creators
- Brand and enterprises
- Type
- UGC
- DIY
- SaaS
- Component
- Solution
- Services
- Geography
- APAC
- China
- India
- Japan
- North America
- US
- Canada
- Mexico
- Europe
- UK
- Germany
- France
- South America
- Brazil
- Argentina
- Middle East and Africa
- South Africa
- Saudi Arabia
- UAE
- Rest of World (ROW)
- APAC
By End-user Insights
The individuals segment is estimated to witness significant growth during the forecast period.
The market is increasingly segmented by end-user needs, with individuals driving demand on user-generated content (UGC) platforms that rely on personalized video recommendations.
Consumption is defined by algorithmically curated content, where advanced video player technology is critical for a seamless experience. For enterprise video communication, the focus shifts to secure cloud-based video hosting and corporate training platforms that support immersive learning models.
These systems leverage API-driven video workflows for integration and employ real-time video processing to deliver insights.
In fact, platforms utilizing real-time sentiment analysis have seen viewer engagement metrics improve by over 15%, demonstrating the value of data in video-centric marketing and automated metadata tagging for content discovery.
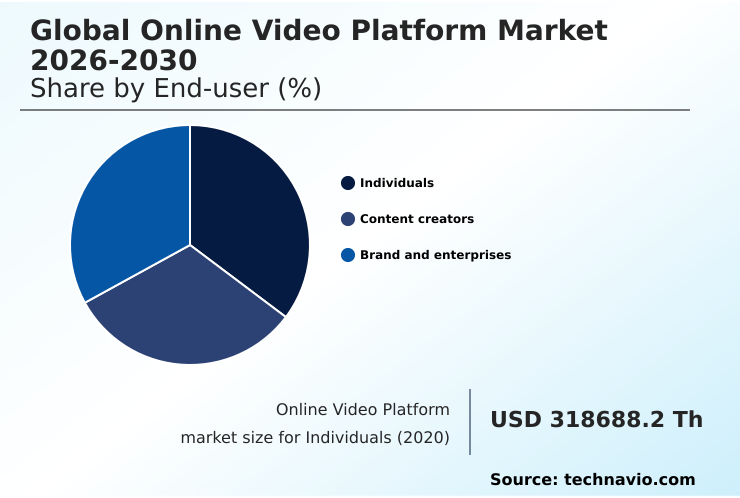
The Individuals segment was valued at USD 533.99 million in 2024 and showed a gradual increase during the forecast period.
Regional Analysis
APAC is estimated to contribute 37.5% to the growth of the global market during the forecast period.Technavio’s analysts have elaborately explained the regional trends and drivers that shape the market during the forecast period.
See How Online Video Platform Market Demand is Rising in APAC Get Free Sample
The geographic landscape is diverse, with APAC leading in mobile-first consumption driven by algorithm-driven content discovery.
In North America, where digital streaming accounts for over 44% of television viewing, the market is mature, with a focus on optimizing average revenue per user (ARPU) through a mix of subscription video on demand (SVOD) and transactional video on demand (TVOD) for live event broadcasting.
European markets prioritize regulatory compliance and are seeing ad-supported tiers on major platforms reach nearly 45% of usage. Across all regions, a robust content delivery network (CDN) and cloud-native architecture are essential for delivering adaptive bitrate streaming effectively.
White-label video solutions are also gaining traction for brands wanting to control their user experience, often incorporating AI-driven content recommendation and interactive chat features.
Market Dynamics
Our researchers analyzed the data with 2025 as the base year, along with the key drivers, trends, and challenges. A holistic analysis of drivers will help companies refine their marketing strategies to gain a competitive advantage.
- The strategic implementation of advanced technologies is defining the competitive edge in the Online Video Platform Market. The use of generative AI for autonomous video production is no longer experimental; it's a core component for scalable content creation, enabling firms to localize marketing assets at a fraction of the traditional cost.
- The impact of 5G on low-latency streaming is profound, making interactive applications like real-time betting and telehealth consultations viable. This shift demands new monetization strategies for content creators, moving beyond simple ad revenue to direct fan engagement. Integrating shoppable video in e-commerce platforms is a prime example, where the conversion uplift is reportedly double that of conventional digital ads.
- For B2B applications, enterprise solutions for secure corporate training are paramount, requiring robust digital rights management for premium content. However, providers face challenges of global content delivery networks and the need for a cohesive multi-CDN strategy for global reach. Technologically, the debate between WebRTC versus HLS for interactive streaming continues, with choices depending on latency tolerance.
- Simultaneously, using edge computing to reduce latency is a key infrastructure investment. Optimizing video transcoding for cost and leveraging API for custom video platform development are critical for profitability. UGC moderation using computer vision AI is essential for brand safety, directly impacting the ROI of video in corporate communications and ensuring GDPR compliance for video analytics data.
What are the key market drivers leading to the rise in the adoption of Online Video Platform Industry?
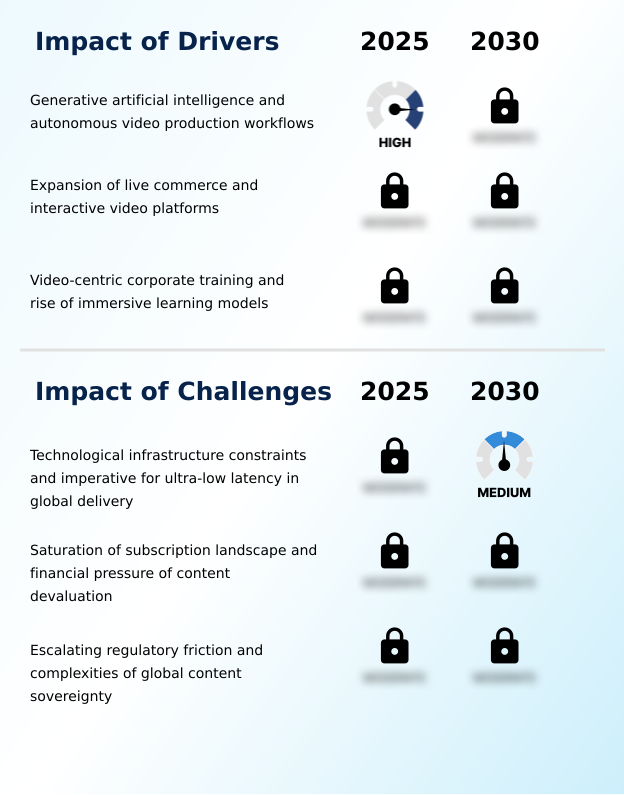
- A primary market driver is the adoption of generative artificial intelligence and autonomous video production workflows, which are revolutionizing content creation and scalability.
- Market expansion is fueled by generative AI video production and autonomous production workflows, which significantly lower costs and timelines, with some firms reducing creation cycles by over 50%. These advancements, along with do-it-yourself (DIY) video tools, empower the creator economy.
- Live commerce integration is another key driver, dependent on low-latency streaming for real-time transactions and pay-per-view monetization. Behind the scenes, efficient video transcoding services are essential for 4K and 8K video delivery across devices.
- AI-powered video analytics and content localization services, including automated subtitling and dubbing, enhance global reach, while robust live video delivery infrastructure ensures a high-quality experience for viewers worldwide, boosting engagement by up to 30%.
What are the market trends shaping the Online Video Platform Industry?
- The proliferation of hybrid monetization models, driven by advanced ad-tech integration, represents a key market trend. This strategic shift allows platforms to diversify revenue streams beyond traditional subscriptions.
- A dominant trend is the adoption of hybrid monetization models on over-the-top (OTT) platforms to address subscription fatigue mitigation, with advertising video on demand (AVOD) tiers growing in popularity. This is enabled by server-side ad insertion (SSAI) technology, which offers a broadcast-quality experience while ensuring brand safety in advertising.
- Interactive video ecosystems are also expanding, particularly through shoppable video formats that achieve higher conversion rates compared to static ads. Such e-commerce video integration, powered by video API integration, connects viewing directly to purchasing.
- To support high-definition (HD) streaming globally, a multi-CDN strategy is becoming standard, improving reliability and performance for these rich media experiences, often linked with customer relationship management integration for personalized offers.
What challenges does the Online Video Platform Industry face during its growth?
- Technological infrastructure constraints, coupled with the critical need for ultra-low latency in global delivery, pose a significant challenge to industry growth.
- Navigating global operations presents significant challenges, including content sovereignty compliance and strict data residency requirements, which complicate the architecture of software as a service (SaaS) video solutions. Another hurdle is achieving consistent performance for mobile-first video consumption, where operators invest in edge computing for video and the WebRTC streaming protocol to minimize latency.
- Internally, firms grapple with effective user-generated content moderation and secure video hosting to protect their platforms. Managing extensive media archives requires a sophisticated video content management system (VCMS) for efficient video library management. Furthermore, robust digital rights management (DRM) is non-negotiable for premium content, while firms use viewer behavior analytics in an ongoing effort to improve churn rate reduction strategies.
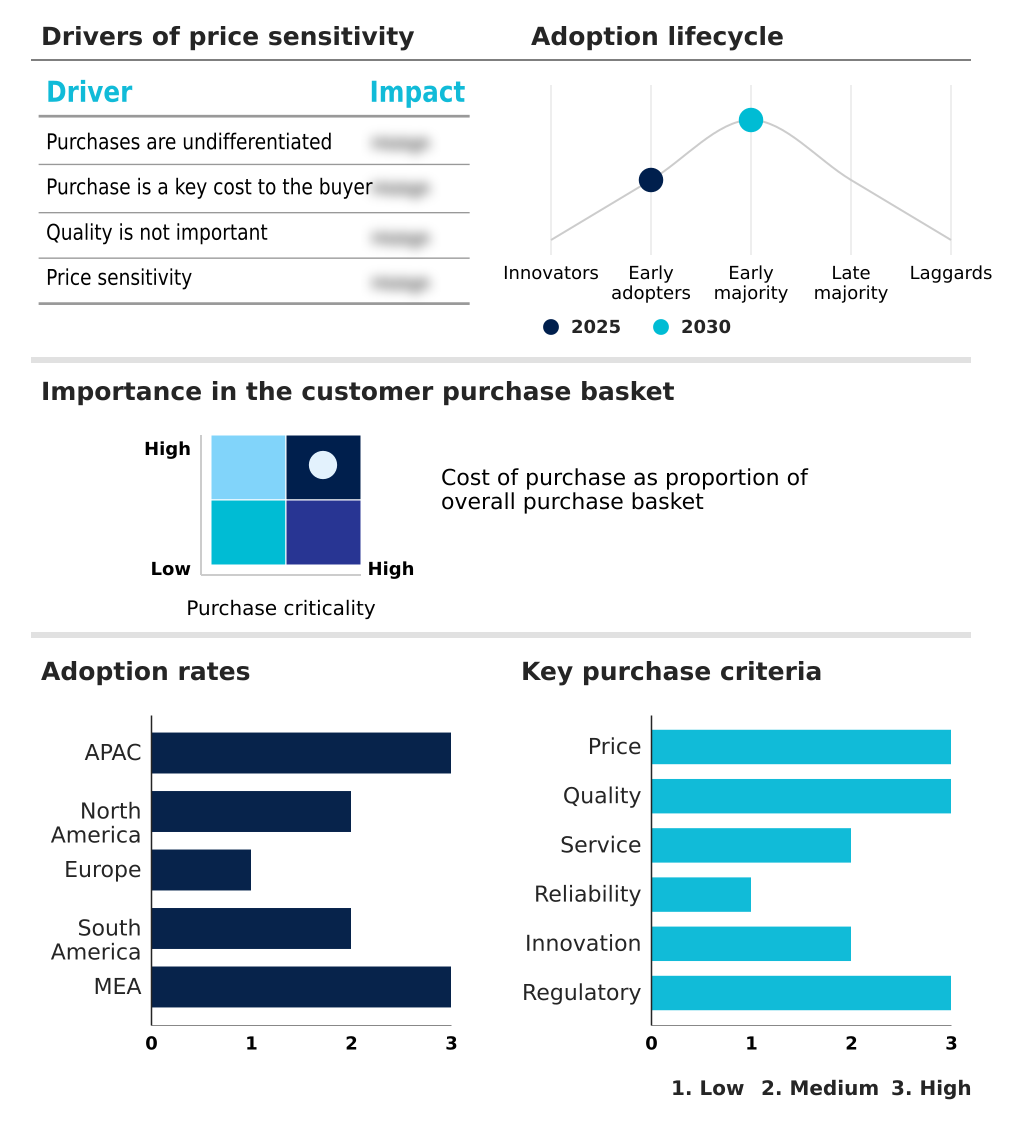
Exclusive Technavio Analysis on Customer Landscape
The online video platform market forecasting report includes the adoption lifecycle of the market, covering from the innovator’s stage to the laggard’s stage. It focuses on adoption rates in different regions based on penetration. Furthermore, the online video platform market report also includes key purchase criteria and drivers of price sensitivity to help companies evaluate and develop their market growth analysis strategies.
Customer Landscape of Online Video Platform Industry
Competitive Landscape
Companies are implementing various strategies, such as strategic alliances, online video platform market forecast, partnerships, mergers and acquisitions, geographical expansion, and product/service launches, to enhance their presence in the industry.
Amazon.com Inc. - Providers deliver cloud-based video hosting, streaming services, and AI-powered analytics, focusing on enterprise-grade security, monetization, and seamless global content delivery.
The industry research and growth report includes detailed analyses of the competitive landscape of the market and information about key companies, including:
- Amazon.com Inc.
- Brightcove Inc.
- Buildscale Inc.
- Dacast Inc.
- Google LLC
- IBM Corp.
- JW Player
- Kaltura Inc.
- Muvi LLC
- Netflix Inc.
- Panopto Inc.
- Tik Tok
- Twitch channel
- Uscreen
- Vimeo.com Inc.
- VPlayed
- Wistia Inc.
- Wowza Media Systems LLC
- Youku Tudou Inc.
- Zype
Qualitative and quantitative analysis of companies has been conducted to help clients understand the wider business environment as well as the strengths and weaknesses of key industry players. Data is qualitatively analyzed to categorize companies as pure play, category-focused, industry-focused, and diversified; it is quantitatively analyzed to categorize companies as dominant, leading, strong, tentative, and weak.
Recent Development and News in Online video platform market
- In May, 2025, Bending Spoons initiated a major restructuring following its acquisitions of Vimeo and Brightcove, aiming to streamline operations and integrate the video-as-a-service platforms.
- In January, 2025, Netflix announced a significant expansion of its ad-supported plan, reporting that the tier now accounts for nearly 45% of viewing hours in key markets, signaling a strategic shift to hybrid monetization.
- In October, 2024, Alphabet Inc. detailed a capital expenditure plan of up to $185 billion, primarily to enhance its data center capacity and infrastructure for generative AI video features across its platforms.
- In August, 2024, The European Union proposed updates to its digital services framework, introducing stricter transparency rules for algorithmic recommendation engines and content moderation tools for AI-generated video.
Dive into Technavio’s robust research methodology, blending expert interviews, extensive data synthesis, and validated models for unparalleled Online Video Platform Market insights. See full methodology.
| Market Scope | |
|---|---|
| Page number | 291 |
| Base year | 2025 |
| Historic period | 2020-2024 |
| Forecast period | 2026-2030 |
| Growth momentum & CAGR | Accelerate at a CAGR of 21.1% |
| Market growth 2026-2030 | USD 2855378.0 thousand |
| Market structure | Fragmented |
| YoY growth 2025-2026(%) | 18.1% |
| Key countries | China, India, Japan, South Korea, Indonesia, Australia, US, Canada, Mexico, UK, Germany, France, Italy, Spain, The Netherlands, Brazil, Argentina, Chile, South Africa, Saudi Arabia, UAE, Turkey and Israel |
| Competitive landscape | Leading Companies, Market Positioning of Companies, Competitive Strategies, and Industry Risks |
Research Analyst Overview
- The Online Video Platform Market is recalibrating around AI-driven efficiency and diversified monetization. Core infrastructure, including cloud-native architecture and adaptive bitrate streaming, is now table stakes. The competitive differentiator lies in leveraging generative AI video production and AI-powered video analytics to create and measure content at scale.
- A key boardroom decision revolves around adopting these autonomous production workflows, which have demonstrated the ability to reduce content creation timelines by over 40%, directly impacting marketing budgets and speed-to-market. This shift is enabling the expansion of interactive video ecosystems and sophisticated live commerce integration.
- As platforms move toward hybrid monetization models, the role of server-side ad insertion (SSAI) and transactional video on demand (TVOD) becomes critical for revenue optimization. At the same time, ensuring security through digital rights management (DRM) and secure video hosting remains a top priority, especially for enterprise video communication.
- The market is a complex interplay of technology and strategy, where success depends on mastering both low-latency streaming and effective viewer engagement metrics.
What are the Key Data Covered in this Online Video Platform Market Research and Growth Report?
-
What is the expected growth of the Online Video Platform Market between 2026 and 2030?
-
USD 2.86 billion, at a CAGR of 21.1%
-
-
What segmentation does the market report cover?
-
The report is segmented by End-user (Individuals, Content creators, and Brand and enterprises), Type (UGC, DIY, and SaaS), Component (Solution, and Services) and Geography (APAC, North America, Europe, South America, Middle East and Africa)
-
-
Which regions are analyzed in the report?
-
APAC, North America, Europe, South America and Middle East and Africa
-
-
What are the key growth drivers and market challenges?
-
Generative artificial intelligence and autonomous video production workflows, Technological infrastructure constraints and imperative for ultra-low latency in global delivery
-
-
Who are the major players in the Online Video Platform Market?
-
Amazon.com Inc., Brightcove Inc., Buildscale Inc., Dacast Inc., Google LLC, IBM Corp., JW Player, Kaltura Inc., Muvi LLC, Netflix Inc., Panopto Inc., Tik Tok, Twitch channel, Uscreen, Vimeo.com Inc., VPlayed, Wistia Inc., Wowza Media Systems LLC, Youku Tudou Inc. and Zype
-
Market Research Insights
- The market's dynamics are shaped by the dual pressures of technological innovation and shifting consumer behavior. The need for subscription fatigue mitigation is driving the adoption of flexible monetization, while creator economy tools are democratizing content production. In the enterprise space, video is central to immersive learning models and corporate training platforms, with viewer behavior analytics informing video-centric marketing strategies.
- AI is pivotal, powering personalized video recommendations and real-time sentiment analysis, which has been shown to boost conversion rates by over 20%. As platforms scale, they must navigate content sovereignty compliance and data residency requirements.
- For providers, this means focusing on churn rate reduction and increasing average revenue per user (ARPU) through superior user experiences and features like automated subtitling and dubbing for global audiences.
We can help! Our analysts can customize this online video platform market research report to meet your requirements.
 RIA -
RIA - 
