
Live Streaming Market Size 2026-2030
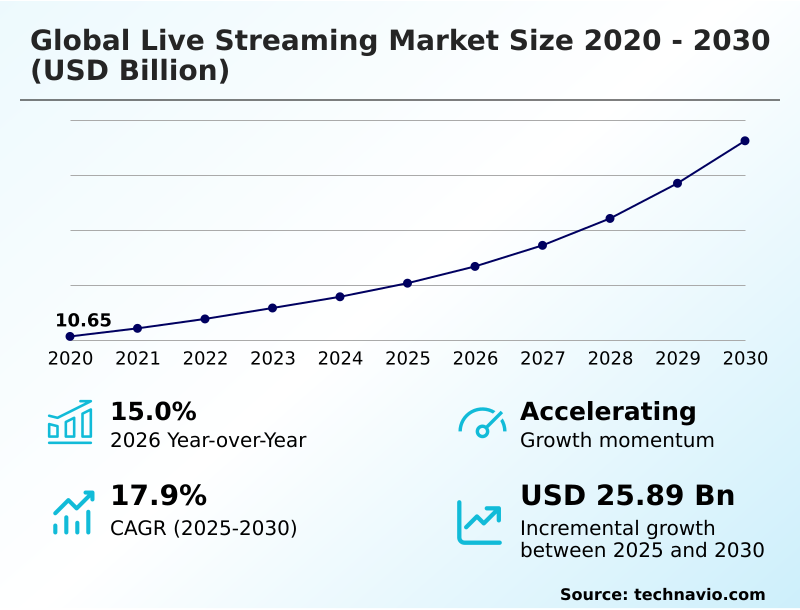
The live streaming market size is valued to increase by USD 25.89 billion, at a CAGR of 17.9% from 2025 to 2030. Rising penetration of smartphones and easy access to internet will drive the live streaming market.
Major Market Trends & Insights
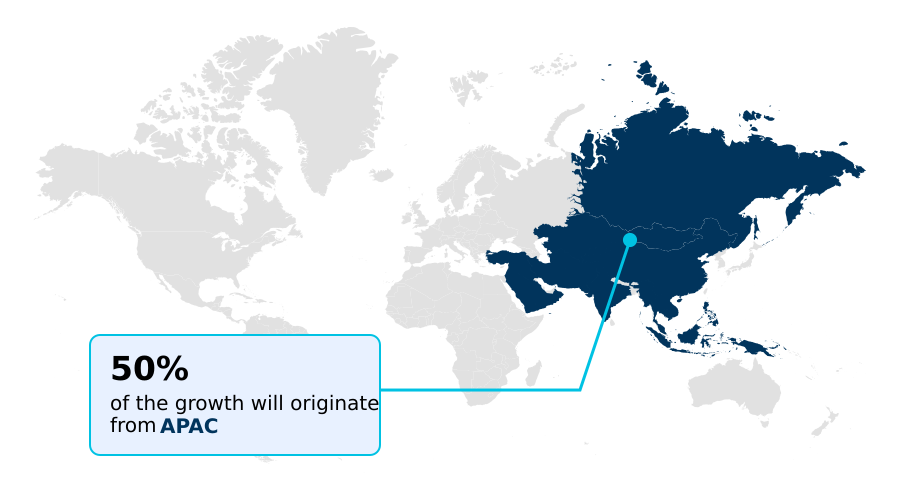
- APAC dominated the market and accounted for a 49.8% growth during the forecast period.
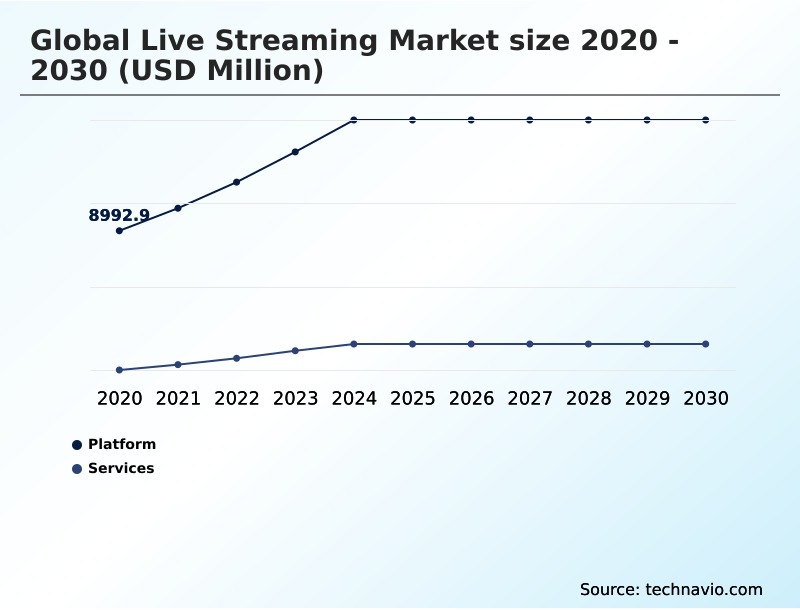
- By Product - Platform segment was valued at USD 14.83 billion in 2024
- By End-user - Media and entertainment segment accounted for the largest market revenue share in 2024
Market Size & Forecast
- Market Opportunities: USD 35.57 billion
- Market Future Opportunities: USD 25.89 billion
- CAGR from 2025 to 2030 : 17.9%
Market Summary
- The live streaming market is a dynamic and integral part of the digital media landscape, fueled by the demand for interactive and immediate content. At its core, the industry relies on a scalable streaming infrastructure capable of real-time transmission with low latency streaming, ensuring a high-quality viewer experience.
- This is made possible through advanced content delivery networks and the use of adaptive bitrate technology. The rise of the creator economy platforms has democratized content creation, leading to a surge in user-generated content across various genres.
- Monetization has evolved beyond simple ads, with content monetization models now including digital tipping systems, subscription-based monetization, and the rapidly growing field of live commerce integration. For instance, a retail brand can leverage live shopping festivals to showcase products, answer questions via real-time chat moderation, and drive sales directly within the broadcast, achieving conversion rates significantly higher than traditional e-commerce.
- As the market matures, a greater emphasis is placed on governance through ai-powered moderation and ensuring brand safety in streaming, addressing the challenges inherent in live, unscripted content.
What will be the Size of the Live Streaming Market during the forecast period?
Get Key Insights on Market Forecast (PDF) Get Free Sample
How is the Live Streaming Market Segmented?
The live streaming industry research report provides comprehensive data (region-wise segment analysis), with forecasts and estimates in "USD million" for the period 2026-2030, as well as historical data from 2020-2024 for the following segments.
- Product
- Platform
- Services
- End-user
- Media and entertainment
- Education
- Esports
- Events
- Others
- Type
- Video streaming
- Audio streaming
- Geography
- APAC
- China
- Japan
- India
- North America
- US
- Canada
- Mexico
- Europe
- UK
- Germany
- France
- South America
- Brazil
- Argentina
- Colombia
- Middle East and Africa
- Saudi Arabia
- UAE
- South Africa
- Rest of World (ROW)
- APAC
By Product Insights
The platform segment is estimated to witness significant growth during the forecast period.
The platform segment is defined by its foundational role, leveraging cloud-native solutions and a scalable streaming infrastructure to manage cloud-based video production. Key functionalities include robust content transcoding service options and sophisticated digital rights management to protect assets.
Modern systems facilitate seamless api and sdk embedding for custom integrations, while server-side ad insertion offers advanced monetization. The emphasis is on creating a smooth live-to-vod workflow, enhanced by effective content discovery algorithms and personalized content recommendation.
Architectures are evolving to support peer-to-peer streaming, immersive 360-degree video, and complex multi-camera production, all layered with interactive video layers to boost engagement, a model that has shown a 15% increase in viewer interaction time.
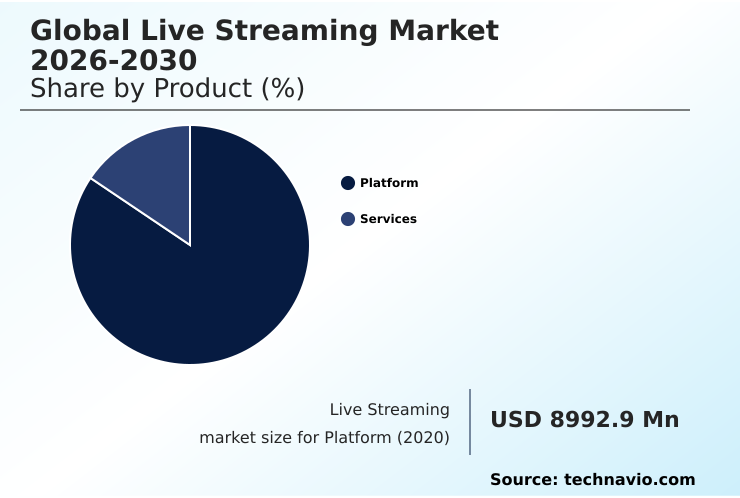
The Platform segment was valued at USD 14.83 billion in 2024 and showed a gradual increase during the forecast period.
Regional Analysis
APAC is estimated to contribute 49.8% to the growth of the global market during the forecast period.Technavio’s analysts have elaborately explained the regional trends and drivers that shape the market during the forecast period.
See How Live Streaming Market Demand is Rising in APAC Get Free Sample
The market's geographic landscape is characterized by dynamic growth, particularly in APAC, which accounts for nearly 50% of the incremental growth. This expansion is driven by the demand for real-time transmission and instantaneous distribution of high-definition broadcast content.
In this region, a mobile-first design is critical, with leading countries demonstrating a significant uptake in hybrid event technology and esports tournament coverage.
Platforms are optimizing delivery using advanced h.265 video codec standards and protocols like webrtc protocol and secure reliable transport to ensure low latency streaming. As organizations expand their global footprint, corporate town hall meetings are increasingly reliant on these technologies.
Effective implementation of real-time video analytics and interactive audience tools has improved engagement metrics by over 20% in key verticals.
Market Dynamics
Our researchers analyzed the data with 2025 as the base year, along with the key drivers, trends, and challenges. A holistic analysis of drivers will help companies refine their marketing strategies to gain a competitive advantage.
- Strategic decision-making in the live streaming market requires a deep understanding of its technical and operational complexities. Key considerations include the benefits of low latency streaming, which directly impacts user engagement, and the effective use of ai for live video moderation to manage platform risk.
- For content creators and broadcasters, the best practices for enterprise streaming are essential for maintaining professional standards, especially when considering live streaming for corporate training. Technologically, the landscape is shaped by discussions around comparing h.265 and av1 codecs for efficiency and the use of webrtc for interactive sessions.
- The rising popularity of ar overlays in sports broadcasting opens new revenue streams, a critical aspect when evaluating how to implement server-side ad insertion. For businesses, building a live commerce platform presents a significant opportunity, though it comes with challenges of global content delivery and the need to ensure drm for premium content.
- Flexibility is achieved by learning how to integrate live video with apis, which is crucial for custom solutions designed for managing high concurrent viewer loads. A comprehensive live to vod content strategy is now a standard requirement, as are systems for providing real-time analytics for audience engagement.
- A focus on optimizing video for mobile streaming and improving quality of experience metrics can yield significant results; for instance, mobile-first optimizations have shown to increase viewer retention on cellular networks by over 25%.
- Furthermore, understanding the legal aspects of user-generated content and addressing security concerns in live broadcasting are non-negotiable for sustainable operations, especially when exploring how to start monetizing live streams with virtual gifts.
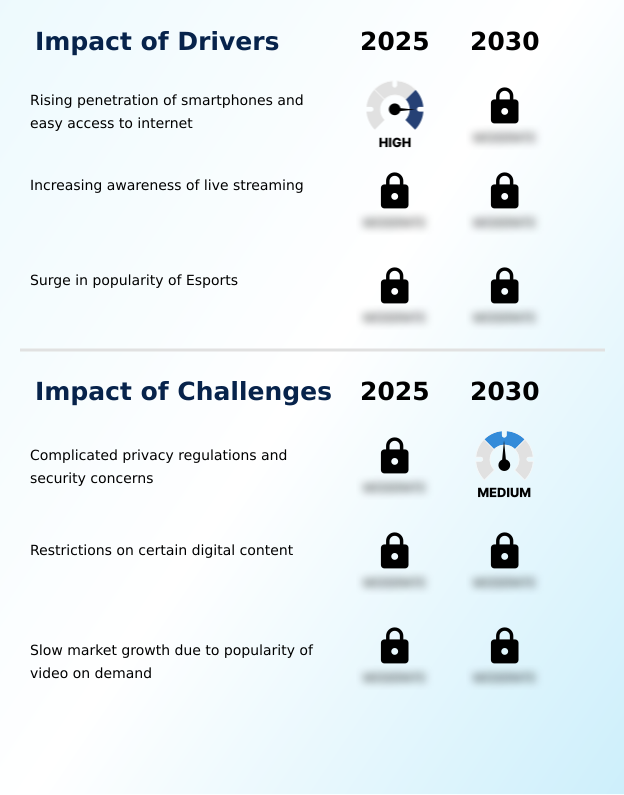
What are the key market drivers leading to the rise in the adoption of Live Streaming Industry?
- The rising penetration of smartphones, coupled with greater access to high-speed internet, serves as a key driver for market expansion.
- Market growth is primarily driven by expanding connectivity and the rise of the creator economy. Advanced content delivery networks and edge computing deployment are crucial for improving the quality of experience monitoring, reducing content load times by up to 50%.
- The adoption of efficient standards like av1 video compression simplifies the video ingestion process, supporting the surge in content from creator economy platforms. This environment fosters new content monetization models, including digital tipping systems and direct fan engagement strategies.
- The boom in live commerce integration, facilitated by live shopping festivals and managed with real-time chat moderation, has created significant revenue streams. Furthermore, a multi-cdn strategy is increasingly used to ensure reliability for a global audience.
What are the market trends shaping the Live Streaming Industry?
- The integration of advanced technologies with online streaming services marks a significant market trend, poised to redefine user experiences and enhance platform capabilities.
- Key market trends are centered on technological integration and user experience enhancement. The adoption of ai-powered moderation is becoming standard for managing user-generated content and ensuring brand safety in streaming, leading to a 40% reduction in harmful content incidents. Platforms are using augmented reality overlays and virtual reality integration to deepen parasocial interactions and create immersive environments.
- This is supported by a scalable streaming infrastructure that employs adaptive bitrate technology to guarantee quality. The rise of citizen journalism tools and live polling features is diversifying content, while enterprises are adopting white-label solutions for branded enterprise video communication. These trends are amplified by influencer marketing platforms, which leverage authenticity to drive engagement across new formats.
What challenges does the Live Streaming Industry face during its growth?
- Complex privacy regulations and persistent security concerns present a key challenge affecting the industry's growth.
- Navigating regulatory and competitive challenges is critical for market participants. The complexity of global compliance requires robust forensic watermarking and automated content flagging to manage liabilities associated with over-the-top delivery. At the same time, the intense competition from on-demand content necessitates a focus on audience retention analytics and reducing glass-to-glass latency to maintain viewer interest.
- Platforms are refining dynamic ad insertion to improve monetization without degrading the user experience. The expansion into sectors like remote education platforms and telehealth applications introduces stringent data privacy requirements. To stay competitive, providers are offering advanced features like interactive video layers and flexible subscription-based monetization or pay-per-view events, leveraging social media broadcasting to attract and retain users.
Exclusive Technavio Analysis on Customer Landscape
The live streaming market forecasting report includes the adoption lifecycle of the market, covering from the innovator’s stage to the laggard’s stage. It focuses on adoption rates in different regions based on penetration. Furthermore, the live streaming market report also includes key purchase criteria and drivers of price sensitivity to help companies evaluate and develop their market growth analysis strategies.
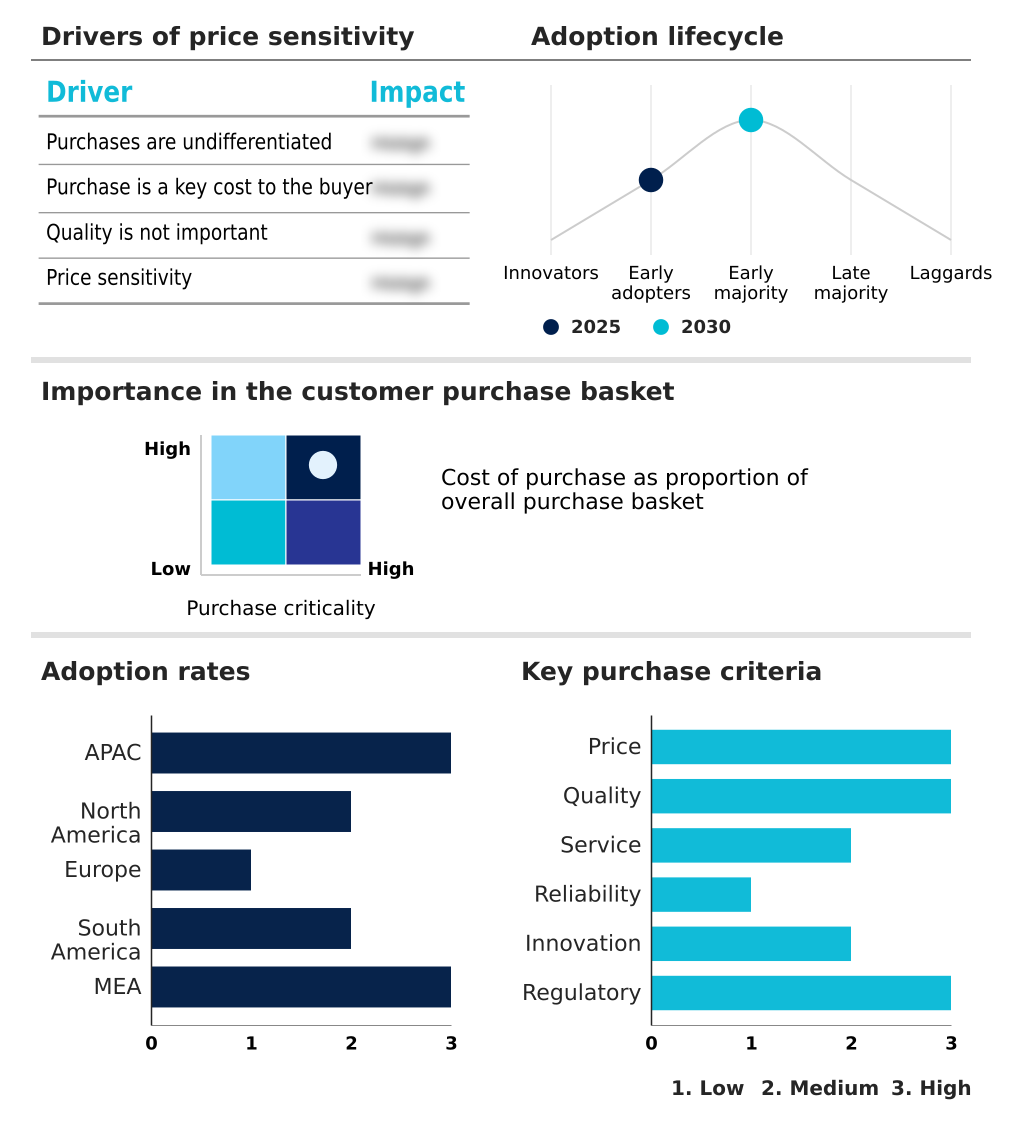
Customer Landscape of Live Streaming Industry
Competitive Landscape
Companies are implementing various strategies, such as strategic alliances, live streaming market forecast, partnerships, mergers and acquisitions, geographical expansion, and product/service launches, to enhance their presence in the industry.
Alphabet Inc. - Offerings include real-time video broadcasting and event streaming, featuring platforms designed for the expanding creator economy and enhanced audience engagement.
The industry research and growth report includes detailed analyses of the competitive landscape of the market and information about key companies, including:
- Alphabet Inc.
- Amazon.com Inc.
- Brightcove Inc.
- ByteDance Ltd.
- Flux Broadcast
- Haivision Systems Inc.
- IBM Corp.
- Meta Platforms Inc.
- MetaCDN
- Microsoft Corp.
- Muvi LLC
- Panopto Inc.
- Stream Hatchet
- Super Digital doo
- Tencent Holdings Ltd.
- Vimeo.com Inc.
- WaveFX
- Wowza Media Systems LLC
- ZEGOCLOUD Pte. Ltd.
Qualitative and quantitative analysis of companies has been conducted to help clients understand the wider business environment as well as the strengths and weaknesses of key industry players. Data is qualitatively analyzed to categorize companies as pure play, category-focused, industry-focused, and diversified; it is quantitatively analyzed to categorize companies as dominant, leading, strong, tentative, and weak.
Recent Development and News in Live streaming market
- In January, 2025, a major social networking platform was fined over three hundred million euros by a European data protection agency for using facial recognition software to categorize audience demographics during live sessions without explicit user consent, forcing a global overhaul of its privacy architecture.
- In February, 2025, The World Health Organization hosted a global digital health summit broadcast live across multiple platforms in over twenty languages, reaching an audience of five hundred million unique viewers and highlighting the medium's role in public information dissemination.
- In August, 2025, Jio Cinema launched an innovative AI-powered feature enabling viewers of live sports to change camera angles using voice commands, demonstrating a shift toward highly customized and interactive viewing experiences.
- In September, 2025, Stella McCartney introduced its own exclusive live broadcasting platform to host runway shows, allowing high-net-worth clients to pre-order items in real-time and generating significant revenue, showcasing a trend of brands building proprietary streaming environments.
Dive into Technavio’s robust research methodology, blending expert interviews, extensive data synthesis, and validated models for unparalleled Live Streaming Market insights. See full methodology.
| Market Scope | |
|---|---|
| Page number | 297 |
| Base year | 2025 |
| Historic period | 2020-2024 |
| Forecast period | 2026-2030 |
| Growth momentum & CAGR | Accelerate at a CAGR of 17.9% |
| Market growth 2026-2030 | USD 25892.1 million |
| Market structure | Fragmented |
| YoY growth 2025-2026(%) | 15.0% |
| Key countries | China, Japan, India, South Korea, Australia, Indonesia, US, Canada, Mexico, UK, Germany, France, Italy, Spain, The Netherlands, Brazil, Argentina, Colombia, Saudi Arabia, UAE, South Africa, Israel and Turkey |
| Competitive landscape | Leading Companies, Market Positioning of Companies, Competitive Strategies, and Industry Risks |
Research Analyst Overview
- The live streaming market's evolution is defined by a convergence of advanced infrastructure and sophisticated monetization. Core to this is the reliance on cloud-native solutions and effective content delivery networks that enable real-time transmission and instantaneous distribution.
- To ensure a high quality of experience monitoring, platforms employ adaptive bitrate technology and are transitioning to efficient standards like the h.265 video codec and av1 video compression. The technical backbone involves a streamlined video ingestion process and robust content transcoding service, often deployed via edge computing deployment.
- Protocols like webrtc protocol and secure reliable transport are critical for minimizing glass-to-glass latency. For boardroom consideration, content governance is paramount, addressed through ai-powered moderation, automated content flagging, and security measures like digital rights management and forensic watermarking. Monetization is increasingly driven by live commerce integration and strategies like server-side ad insertion and dynamic ad insertion.
- Creator economy platforms thrive on user-generated content, fostering parasocial interactions and leveraging viewer engagement metrics and audience retention analytics. The market supports everything from high-definition broadcast with multi-camera production and 360-degree video to immersive augmented reality overlays and virtual reality integration, often delivered through white-label solutions with custom api and sdk embedding for over-the-top delivery.
What are the Key Data Covered in this Live Streaming Market Research and Growth Report?
-
What is the expected growth of the Live Streaming Market between 2026 and 2030?
-
USD 25.89 billion, at a CAGR of 17.9%
-
-
What segmentation does the market report cover?
-
The report is segmented by Product (Platform, and Services), End-user (Media and entertainment, Education, Esports, Events, and Others), Type (Video streaming, and Audio streaming) and Geography (APAC, North America, Europe, South America, Middle East and Africa)
-
-
Which regions are analyzed in the report?
-
APAC, North America, Europe, South America and Middle East and Africa
-
-
What are the key growth drivers and market challenges?
-
Rising penetration of smartphones and easy access to internet, Complicated privacy regulations and security concerns
-
-
Who are the major players in the Live Streaming Market?
-
Alphabet Inc., Amazon.com Inc., Brightcove Inc., ByteDance Ltd., Flux Broadcast, Haivision Systems Inc., IBM Corp., Meta Platforms Inc., MetaCDN, Microsoft Corp., Muvi LLC, Panopto Inc., Stream Hatchet, Super Digital doo, Tencent Holdings Ltd., Vimeo.com Inc., WaveFX, Wowza Media Systems LLC and ZEGOCLOUD Pte. Ltd.
-
Market Research Insights
- Market dynamics are increasingly shaped by technological innovation and shifting consumer behaviors. The need for a scalable streaming infrastructure is paramount, as platforms adopt a mobile-first design to cater to a global audience. The expansion of enterprise video communication, particularly for corporate town hall meetings, has driven a 20% increase in the adoption of professional streaming solutions.
- In entertainment, new content monetization models and direct fan engagement strategies are redefining revenue streams, with esports tournament coverage shattering viewership records. The integration of interactive audience tools, which can boost user session times by over 30%, is becoming a key differentiator.
- As the industry matures, a multi-cdn strategy is critical for ensuring global reliability and delivering a seamless viewer experience across diverse network conditions.
We can help! Our analysts can customize this live streaming market research report to meet your requirements.
 RIA -
RIA - 
