Optical Interconnect Market Analysis APAC, North America, Europe, South America, Middle East and Africa - China, US, South Korea, Japan, Canada - Size and Forecast 2024-2028

Optical Interconnect Market Analysis APAC, North America, Europe, South America, Middle East and Africa - China, US, South Korea, Japan, Canada - Size and Forecast 2024-2028

Published: Jun 2024 190 Pages SKU: IRTNTR73770

Market Overview at a Glance

$16.80 B
Market Opportunity
20.62%
CAGR
16.56
YoY growth 2023-2024(%)

Optical Interconnect Market Size 2024-2028

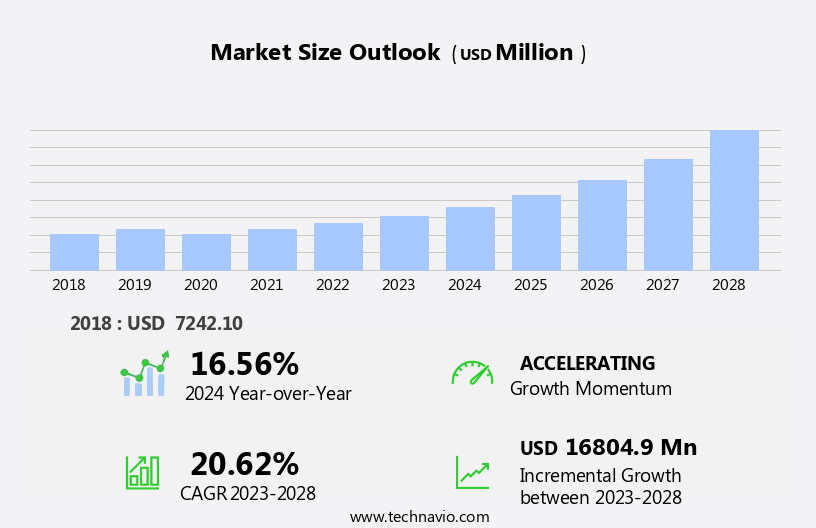
The optical interconnect market size is forecast to increase by USD 16.8 billion, at a CAGR of 20.62% between 2023 and 2028.

  • The market is experiencing significant growth, driven by the increasing adoption of cloud databases and the demand for millimeter wave connectivity. Cloud databases require high-speed, low-latency connectivity to support the massive data transfer and processing needs of businesses and consumers. This trend is fueling the demand for advanced optical interconnect solutions, which offer superior bandwidth and reliability. However, the high cost of optical interconnectors poses a significant challenge for market growth. These components are essential for establishing high-speed optical connections between servers, data centers, and other network infrastructure. Despite their benefits, their high cost can limit their widespread adoption, particularly in smaller organizations and emerging markets.
  • To capitalize on market opportunities and navigate this challenge effectively, companies must focus on developing cost-effective solutions while maintaining the necessary performance and reliability. By addressing this challenge, they can tap into the significant potential of the market, which is poised for continued growth as the demand for high-speed connectivity continues to escalate.

What will be the Size of the Optical Interconnect Market during the forecast period?

Optical Interconnect Market Size

Explore in-depth regional segment analysis with market size data - historical 2018-2022 and forecasts 2024-2028 - in the full report.  
Request Free Sample

The market continues to evolve, driven by advancements in photonics integration, machine learning, and high-performance computing. Optical signal processing plays a pivotal role in enhancing optical bandwidth and enabling high-speed data transmission. Optical demultiplexers and optical multiplexers facilitate network architecture reconfiguration and interoperability testing. Optical modulators and optical receivers are integral components of optical transceivers, which are essential for data center interconnect and consumer electronics applications. Direct attach cables and breakout cables streamline system integration and reduce power consumption. Free-space optics and fiber optic cables are employed in various sectors, including industrial automation, scientific research, and medical imaging.

Singlemode fiber and multimode fiber cater to different data rate requirements. Optical fiber production techniques, such as optical fiber drawing and optical fiber splicing, ensure signal integrity and minimize optical fiber loss. Thermal management is a critical consideration for maintaining optimal performance in optical interconnect modules. Optical amplifiers extend the reach of optical signals and improve bit error rate. Wavelength division multiplexing enables efficient use of the optical spectrum. Optical switches facilitate network reconfiguration and traffic management. The ongoing development of optical interconnect technologies is shaping the future of 5G networks, light fidelity, and cloud computing.

Transceiver compatibility and transceiver form factors are key areas of focus for enhancing performance and reducing costs. Optical interconnect technologies are also finding applications in emerging areas such as edge computing, big data analytics, and optical wireless. Optical spectrum analyzers and optical power meters are essential tools for testing and optimizing these systems.

How is this Optical Interconnect Industry segmented?

The optical interconnect industry research report provides comprehensive data (region-wise segment analysis), with forecasts and estimates in "USD million" for the period 2024-2028, as well as historical data from 2018-2022 for the following segments.

  • Fiber Type
    • Single-mode fiber
    • Multimode fiber
  • Connectivity
    • Rack level
    • Long-haul level
    • Chip and board level
  • Product Type
    • Optical transceivers
    • Connectors
    • Cable assemblies
    • Others
  • Geography
    • North America
      • US
      • Canada
    • APAC
      • China
      • Japan
      • South Korea
    • Rest of World (ROW)

By Fiber Type Insights

The single-mode fiber segment is estimated to witness significant growth during the forecast period.

Single-mode optical fibers, featuring a core diameter of approximately 8-9 microns and a cladding diameter of around 125 microns, are the foundation of long-distance fiber optical communications. Their design allows for a single ray of light to travel directly through the fiber, reducing reflections and resulting in less attenuation and increased transmission distance, typically up to 10 kilometers. This type of fiber is essential for high-performance applications, including data center interconnects, high-speed data transmission, and 5G networks. Advancements in photonics integration, optical fiber production, and optical signal processing have led to innovations in single-mode fiber technology. For instance, silicon photonics, optical amplifiers, and optical switches have significantly improved the efficiency and capacity of single-mode fiber systems.

Moreover, the integration of artificial intelligence and machine learning algorithms in thermal management and signal integrity has optimized network architecture and interoperability testing. Optical transponders, optical transceivers, and optical interconnect modules have become increasingly important components in the single-mode fiber ecosystem. These devices enable high bit error rates and transceiver compatibility, ensuring seamless data transfer between various systems. Furthermore, the development of advanced transceiver form factors, such as direct attach cables and breakout cables, has streamlined system integration and fiber optic testing. The single-mode fiber market is also influenced by emerging trends, such as edge computing, industrial automation, and scientific research.

Edge computing, for example, requires high-bandwidth, low-latency connections, making single-mode fibers an ideal choice for data transfer. Similarly, industrial automation applications, such as robotics and machine vision, rely on single-mode fibers for high-speed data transmission and precise control. In scientific research, single-mode fibers are used extensively in various fields, including medical imaging, spectroscopy, and optical spectroscopy. Optical fiber coating technologies, such as optical fiber drawing and optical fiber loss reduction techniques, have also contributed significantly to the advancement of single-mode fiber systems. These advancements have led to improvements in optical bandwidth, power consumption, and wavelength division multiplexing, making single-mode fibers a preferred choice for high-speed data transmission applications.

In summary, single-mode optical fibers play a pivotal role in the fiber optical communications industry, driving advancements in various sectors, including data centers, telecommunications, and scientific research. The ongoing innovations in photonics integration, optical fiber production, and signal processing are expected to further expand the capabilities and applications of single-mode fibers.

Optical Interconnect Market Size

Request Free Sample

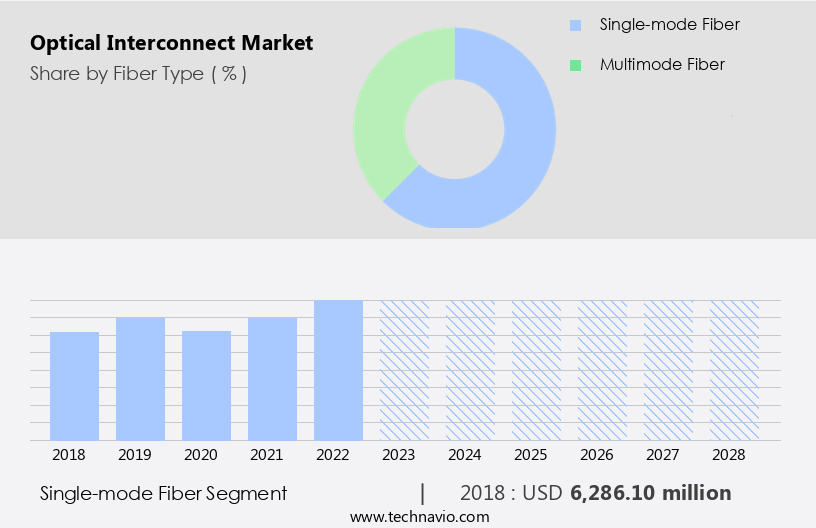
The Single-mode fiber segment was valued at USD 6.29 billion in 2018 and showed a gradual increase during the forecast period.

Regional Analysis

APAC is estimated to contribute 62% to the growth of the global market during the forecast period. Technavio's analysts have elaborately explained the regional trends and drivers that shape the market during the forecast period.

Optical Interconnect Market Share by Geography

 Request Free Sample

The market in APAC is experiencing significant growth due to several key factors. Governments in India and China are increasingly investing in fiber optics for communication infrastructure, as they focus on digital transformation. The region's burgeoning population and rising number of telecom subscribers further fuel the demand for optical interconnect solutions. Moreover, the increasing adoption of edge computing and artificial intelligence technologies, particularly in data-intensive industries, necessitates high-speed data transmission and processing capabilities. This requirement is driving the demand for advanced optical interconnect technologies, such as photonics integration, optical fiber drawing, and optical signal processing. In addition, the expanding data center industry in APAC is a significant contributor to the market's growth.

Data centers require efficient thermal management solutions, optical transponders, fiber optic connectors, and other optical interconnect components to ensure signal integrity and high-bandwidth connectivity. The proliferation of consumer electronics, 5G networks, and industrial automation applications in APAC is also driving the demand for optical interconnect solutions. These applications require high-speed data transmission, low power consumption, and interoperability with various transceiver form factors. Furthermore, the development of advanced technologies, such as silicon photonics, wavelength division multiplexing, and optical wireless, is expected to provide new opportunities for market growth. The integration of these technologies with other optical interconnect components, such as optical amplifiers, optical switches, and optical demultiplexers, is expected to enable more efficient and cost-effective solutions for various applications.

Optical interconnect modules, passive optical cable, and active optical cable are also gaining popularity in the market due to their ability to provide high-bandwidth connectivity and reduce fiber optic loss. Fiber optic testing and system integration are crucial aspects of the market to ensure optimal performance and reliability of the optical interconnect solutions. Overall, the market in APAC is expected to continue its growth trajectory due to the increasing demand for high-speed data transmission, data center interconnect, and advanced optical interconnect technologies.

Market Dynamics

Our researchers analyzed the data with 2023 as the base year, along with the key drivers, trends, and challenges. A holistic analysis of drivers will help companies refine their marketing strategies to gain a competitive advantage.

What are the key market drivers leading to the rise in the adoption of Optical Interconnect Industry?

  • The adoption of cloud databases serves as the primary catalyst for market growth. 
  • The market is experiencing significant growth due to the increasing demand for high-speed data transmission and processing in various industries, including telecommunications, data centers, and artificial intelligence. A key technology driving this market is the integration of photonics, which utilizes photonic chips to process and transmit data using light waves. This approach offers several advantages, such as higher bandwidth, lower power consumption, and improved signal integrity. Moreover, the adoption of edge computing and big data analytics is fueling the need for advanced optical interconnect solutions. Edge computing allows data processing to occur closer to the source, reducing latency and improving response times.
  • Big data analytics requires the processing of vast amounts of data, which can be challenging for traditional electrical interconnects. Optical interconnects, with their ability to transmit large volumes of data at high speeds, are well-suited for this application. Thermal management is another critical factor influencing the market's growth. Optical interconnects generate significant heat during operation, necessitating effective thermal management solutions to maintain optimal performance and reliability. Innovations in optical fiber coating, splicing, and drawing technologies are addressing this challenge, enabling the production of high-quality, low-loss optical fibers. Optical transponders, transceivers, multiplexers, and connectors are essential components of optical interconnect systems.
  • These components require high precision and reliability to ensure signal integrity and maintain network architecture. The market is witnessing significant advancements in the development of integrated photonics solutions, such as photonics integration and monolithic integration, which are expected to further drive market growth.

What are the market trends shaping the Optical Interconnect Industry?

  • Millimeter wave connectivity is gaining significant traction as the next market trend. This technology, which enables high-speed, wireless communication, is becoming increasingly demanded by industries and consumers alike due to its ability to support large data transfer rates and low latency.
  • The market is experiencing significant growth due to the increasing demand for high-speed data transmission in various industries. The proliferation of 5G networks and the resulting surge in wireless backhaul traffic are major drivers of this growth. Optical interconnect components, such as optical signal processing, optical demultiplexers, and optical modulators, are essential for managing and transmitting this traffic efficiently. High-speed data transmission applications, including machine learning, scientific research, consumer electronics, and data center interconnect, require high optical bandwidth. Optical interconnect technology offers solutions to meet these demands, making it a crucial component in these industries. Furthermore, free-space optics and direct attach cables are increasingly being used in place of traditional copper cables to enhance data rates and reduce latency.
  • In the context of 5G networks, optical interconnect is used to connect millimeter wave connectivity, which is extensively used in small cell backhaul networks. The use of millimeter wave technology in 5G networks requires high-bandwidth, low-latency, and reliable interconnect solutions. Optical interconnect offers these benefits, making it an indispensable technology for 5G networks. An optical spectrum analyzer is an essential tool for testing and maintaining the performance of optical interconnect systems. It enables the analysis of optical signals, ensuring that they meet the required specifications for high-speed data transmission. With the increasing adoption of optical interconnect technology, the demand for optical spectrum analyzers is also expected to grow.
  • In conclusion, the demand for optical interconnect components is expected to increase during the forecast period due to the growing need for high-speed data transmission and the adoption of 5G networks. Optical interconnect offers solutions for managing and transmitting wireless backhaul traffic efficiently and reliably, making it a crucial technology for various industries. Additionally, the use of optical interconnect in 5G networks and the increasing demand for testing and maintenance tools, such as optical spectrum analyzers, are expected to further fuel market growth.

What challenges does the Optical Interconnect Industry face during its growth?

  • The escalating costs of optical interconnectors represent a significant challenge that could hinder the expansion and growth of the industry. 
  • The market encompasses high-performance computing applications, where interconnectors play a pivotal role in transmitting data through optical fibers. Optical interconnects come with varying average selling prices (ASPs), depending on factors such as applications, package weight, bandwidth, and customization options. Interconnectors supporting high bandwidths and specific wavelengths command a premium price. These advanced interconnectors are capable of analyzing signals from various standard cables, including USB, coaxial, and Ethernet. They offer automatic measurements for debugging purposes. However, the high ASP of these interconnectors poses a significant challenge for industries, as it represents a substantial capital expenditure. This high cost may hinder the adoption of new interconnectors, potentially limiting the growth of the market.
  • Optical interconnects employ technologies like optical amplifiers, wavelength division multiplexing, optical switches, and silicon photonics. Interoperability testing and transceiver compatibility are crucial for ensuring seamless integration of these components. An optical receiver, optical power meter, and optical interconnect modules are essential components of an optical interconnect system. Singlemode fiber is the primary medium for data transmission. In conclusion, the market is driven by the increasing demand for high-speed data transmission in various industries. Despite the high ASP, the market is expected to grow due to the continuous advancements in technology and the increasing need for efficient and reliable data transmission solutions.

Exclusive Customer Landscape

The optical interconnect market forecasting report includes the adoption lifecycle of the market, covering from the innovator's stage to the laggard's stage. It focuses on adoption rates in different regions based on penetration. Furthermore, the optical interconnect market report also includes key purchase criteria and drivers of price sensitivity to help companies evaluate and develop their market growth analysis strategies.

Optical Interconnect Market Share by Geography

 Customer Landscape

Key Companies & Market Insights

Companies are implementing various strategies, such as strategic alliances, optical interconnect market forecast, partnerships, mergers and acquisitions, geographical expansion, and product/service launches, to enhance their presence in the industry.

3M Co. - The company specializes in the production of advanced optical interconnect solutions, encompassing 400G, 100G, and 40G modules.

The industry research and growth report includes detailed analyses of the competitive landscape of the market and information about key companies, including:

  • 3M Co.
  • Amphenol Corp.
  • Cisco Systems Inc.
  • Corning Inc.
  • FIBERONE LLC
  • Fischer Connectors Holding SA
  • Fujikura Ltd.
  • Fujitsu Ltd.
  • Furukawa Electric Co. Ltd.
  • II VI Inc.
  • InnoLight Technology Ltd.
  • Japan Aviation Electronics Industry Ltd.
  • Lumentum Holdings Inc.
  • Molex LLC
  • NINGBO LONGXING TELECOMMUNICATIONS EQUIPMENT MANUFACTURING CO. LT
  • NVIDIA Corp.
  • Radiall SA
  • Sterlite Technologies Ltd.
  • Sumitomo Electric Industries Ltd.
  • TE Connectivity Ltd.

Qualitative and quantitative analysis of companies has been conducted to help clients understand the wider business environment as well as the strengths and weaknesses of key industry players. Data is qualitatively analyzed to categorize companies as pure play, category-focused, industry-focused, and diversified; it is quantitatively analyzed to categorize companies as dominant, leading, strong, tentative, and weak.

Recent Development and News in Optical Interconnect Market

  • In February 2023, Cisco Systems, a leading technology company, announced the launch of its new optical interconnect solution, the NCS 5500 Series Silicon Photonics Coherent Transport Platform. This innovation aims to deliver increased bandwidth and efficiency for data center and metro applications (Cisco Press Release, 2023).
  • In April 2024, Finisar Corporation, a leading optical communications company, entered into a strategic partnership with Microsoft to develop and manufacture custom optical components for Microsoft's undersea cable projects. This collaboration is expected to significantly boost Finisar's presence in the telecommunications market (Microsoft Tech Community, 2024).
  • In January 2025, Lumentum Holdings, Inc., a key player in the optical technology industry, completed the acquisition of Oclaro, Inc., a leading provider of optical components and modules. This merger is anticipated to expand Lumentum's product portfolio and strengthen its position in the market (Lumentum Press Release, 2025).
  • In June 2025, the European Union announced a € 1 billion investment in the European Optical Infrastructure Alliance, a public-private partnership aimed at accelerating the deployment of optical interconnect solutions across Europe. This initiative is expected to boost the European market and promote technological advancements in the field (European Commission Press Release, 2025).

Research Analyst Overview

  • The market encompasses a diverse range of technologies, including optical design, sensing, and lithography, that are driving innovation in various industries. One notable trend is the integration of quantum computing and open networking, which necessitates advanced optical spectroscopy and digital signal processing for high-speed data transfer. Optical modeling and simulation play a crucial role in the development of optical networking standards, ensuring interoperability and data privacy. Coherent optics and quantum optics are pushing the boundaries of optical security and metrology, while network virtualization and software-defined networking require advanced optical memory and optical fiber sensors for efficient and secure network operations.
  • Holographic data storage and optical clock technologies offer promising solutions for cloud-native networking and data center applications. The photonics industry continues to thrive, with ongoing research in optical microscopy, fiber Bragg gratings, and optical gyroscopes.

Dive into Technavio's robust research methodology, blending expert interviews, extensive data synthesis, and validated models for unparalleled Optical Interconnect Market insights. See full methodology.

Market Scope

Report Coverage

Details

Page number

190

Base year

2023

Historic period

2018-2022

Forecast period

2024-2028

Growth momentum & CAGR

Accelerate at a CAGR of 20.62%

Market growth 2024-2028

USD 16804.9 million

Market structure

Fragmented

YoY growth 2023-2024(%)

16.56

Key countries

China, US, South Korea, Japan, and Canada

Competitive landscape

Leading Companies, Market Positioning of Companies, Competitive Strategies, and Industry Risks

Request Free Sample

What are the Key Data Covered in this Optical Interconnect Market Research and Growth Report?

  • CAGR of the Optical Interconnect industry during the forecast period
  • Detailed information on factors that will drive the growth and forecasting between 2024 and 2028
  • Precise estimation of the size of the market and its contribution of the industry in focus to the parent market
  • Accurate predictions about upcoming growth and trends and changes in consumer behaviour
  • Growth of the market across APAC, North America, Europe, South America, and Middle East and Africa
  • Thorough analysis of the market's competitive landscape and detailed information about companies
  • Comprehensive analysis of factors that will challenge the optical interconnect market growth of industry companies

We can help! Our analysts can customize this optical interconnect market research report to meet your requirements.

Get in touch

1 Executive Summary

  • 1.1 Market overview
    • Executive Summary - Chart on Market Overview
    • Executive Summary - Data Table on Market Overview
    • Executive Summary - Chart on Global Market Characteristics
    • Executive Summary - Chart on Market by Geography
    • Executive Summary - Chart on Market Segmentation by Fiber Type
    • Executive Summary - Chart on Market Segmentation by Connectivity
    • Executive Summary - Chart on Market Segmentation by Product Type
    • Executive Summary - Chart on Incremental Growth
    • Executive Summary - Data Table on Incremental Growth
    • Executive Summary - Chart on Company Market Positioning

2 Market Landscape

  • 2.1 Market ecosystem
    • Parent Market
    • Data Table on - Parent Market
  • 2.2 Market characteristics
    • Market characteristics analysis
  • 2.3 Value chain analysis
    • Value Chain Analysis

3 Market Sizing

  • 3.1 Market definition
    • Offerings of companies included in the market definition
  • 3.2 Market segment analysis
    • Market segments
  • 3.3 Market size 2023
    • 3.4 Market outlook: Forecast for 2023-2028
      • Chart on Global - Market size and forecast 2023-2028 ($ million)
      • Data Table on Global - Market size and forecast 2023-2028 ($ million)
      • Chart on Global Market: Year-over-year growth 2023-2028 (%)
      • Data Table on Global Market: Year-over-year growth 2023-2028 (%)

    4 Historic Market Size

    • 4.1 Global Optical Interconnect Market 2018 - 2022
      • Historic Market Size - Data Table on Global Optical Interconnect Market 2018 - 2022 ($ million)
    • 4.2 Fiber Type segment analysis 2018 - 2022
      • Historic Market Size - Fiber Type Segment 2018 - 2022 ($ million)
    • 4.3 Connectivity segment analysis 2018 - 2022
      • Historic Market Size - Connectivity Segment 2018 - 2022 ($ million)
    • 4.4 Product Type segment analysis 2018 - 2022
      • Historic Market Size - Product Type Segment 2018 - 2022 ($ million)
    • 4.5 Geography segment analysis 2018 - 2022
      • Historic Market Size - Geography Segment 2018 - 2022 ($ million)
    • 4.6 Country segment analysis 2018 - 2022
      • Historic Market Size - Country Segment 2018 - 2022 ($ million)

    5 Five Forces Analysis

    • 5.1 Five forces summary
      • Five forces analysis - Comparison between 2023 and 2028
    • 5.2 Bargaining power of buyers
      • Bargaining power of buyers - Impact of key factors 2023 and 2028
    • 5.3 Bargaining power of suppliers
      • Bargaining power of suppliers - Impact of key factors in 2023 and 2028
    • 5.4 Threat of new entrants
      • Threat of new entrants - Impact of key factors in 2023 and 2028
    • 5.5 Threat of substitutes
      • Threat of substitutes - Impact of key factors in 2023 and 2028
    • 5.6 Threat of rivalry
      • Threat of rivalry - Impact of key factors in 2023 and 2028
    • 5.7 Market condition
      • Chart on Market condition - Five forces 2023 and 2028

    6 Market Segmentation by Fiber Type

    • 6.1 Market segments
      • Chart on Fiber Type - Market share 2023-2028 (%)
      • Data Table on Fiber Type - Market share 2023-2028 (%)
    • 6.2 Comparison by Fiber Type
      • Chart on Comparison by Fiber Type
      • Data Table on Comparison by Fiber Type
    • 6.3 Single-mode fiber - Market size and forecast 2023-2028
      • Chart on Single-mode fiber - Market size and forecast 2023-2028 ($ million)
      • Data Table on Single-mode fiber - Market size and forecast 2023-2028 ($ million)
      • Chart on Single-mode fiber - Year-over-year growth 2023-2028 (%)
      • Data Table on Single-mode fiber - Year-over-year growth 2023-2028 (%)
    • 6.4 Multimode fiber - Market size and forecast 2023-2028
      • Chart on Multimode fiber - Market size and forecast 2023-2028 ($ million)
      • Data Table on Multimode fiber - Market size and forecast 2023-2028 ($ million)
      • Chart on Multimode fiber - Year-over-year growth 2023-2028 (%)
      • Data Table on Multimode fiber - Year-over-year growth 2023-2028 (%)
    • 6.5 Market opportunity by Fiber Type
      • Market opportunity by Fiber Type ($ million)
      • Data Table on Market opportunity by Fiber Type ($ million)

    7 Market Segmentation by Connectivity

    • 7.1 Market segments
      • Chart on Connectivity - Market share 2023-2028 (%)
      • Data Table on Connectivity - Market share 2023-2028 (%)
    • 7.2 Comparison by Connectivity
      • Chart on Comparison by Connectivity
      • Data Table on Comparison by Connectivity
    • 7.3 Rack level - Market size and forecast 2023-2028
      • Chart on Rack level - Market size and forecast 2023-2028 ($ million)
      • Data Table on Rack level - Market size and forecast 2023-2028 ($ million)
      • Chart on Rack level - Year-over-year growth 2023-2028 (%)
      • Data Table on Rack level - Year-over-year growth 2023-2028 (%)
    • 7.4 Long-haul level - Market size and forecast 2023-2028
      • Chart on Long-haul level - Market size and forecast 2023-2028 ($ million)
      • Data Table on Long-haul level - Market size and forecast 2023-2028 ($ million)
      • Chart on Long-haul level - Year-over-year growth 2023-2028 (%)
      • Data Table on Long-haul level - Year-over-year growth 2023-2028 (%)
    • 7.5 Chip and board level - Market size and forecast 2023-2028
      • Chart on Chip and board level - Market size and forecast 2023-2028 ($ million)
      • Data Table on Chip and board level - Market size and forecast 2023-2028 ($ million)
      • Chart on Chip and board level - Year-over-year growth 2023-2028 (%)
      • Data Table on Chip and board level - Year-over-year growth 2023-2028 (%)
    • 7.6 Market opportunity by Connectivity
      • Market opportunity by Connectivity ($ million)
      • Data Table on Market opportunity by Connectivity ($ million)

    8 Market Segmentation by Product Type

    • 8.1 Market segments
      • Chart on Product Type - Market share 2023-2028 (%)
      • Data Table on Product Type - Market share 2023-2028 (%)
    • 8.2 Comparison by Product Type
      • Chart on Comparison by Product Type
      • Data Table on Comparison by Product Type
    • 8.3 Optical transceivers - Market size and forecast 2023-2028
      • Chart on Optical transceivers - Market size and forecast 2023-2028 ($ million)
      • Data Table on Optical transceivers - Market size and forecast 2023-2028 ($ million)
      • Chart on Optical transceivers - Year-over-year growth 2023-2028 (%)
      • Data Table on Optical transceivers - Year-over-year growth 2023-2028 (%)
    • 8.4 Connectors - Market size and forecast 2023-2028
      • Chart on Connectors - Market size and forecast 2023-2028 ($ million)
      • Data Table on Connectors - Market size and forecast 2023-2028 ($ million)
      • Chart on Connectors - Year-over-year growth 2023-2028 (%)
      • Data Table on Connectors - Year-over-year growth 2023-2028 (%)
    • 8.5 Cable assemblies - Market size and forecast 2023-2028
      • Chart on Cable assemblies - Market size and forecast 2023-2028 ($ million)
      • Data Table on Cable assemblies - Market size and forecast 2023-2028 ($ million)
      • Chart on Cable assemblies - Year-over-year growth 2023-2028 (%)
      • Data Table on Cable assemblies - Year-over-year growth 2023-2028 (%)
    • 8.6 Others - Market size and forecast 2023-2028
      • Chart on Others - Market size and forecast 2023-2028 ($ million)
      • Data Table on Others - Market size and forecast 2023-2028 ($ million)
      • Chart on Others - Year-over-year growth 2023-2028 (%)
      • Data Table on Others - Year-over-year growth 2023-2028 (%)
    • 8.7 Market opportunity by Product Type
      • Market opportunity by Product Type ($ million)
      • Data Table on Market opportunity by Product Type ($ million)

    9 Customer Landscape

    • 9.1 Customer landscape overview
      • Analysis of price sensitivity, lifecycle, customer purchase basket, adoption rates, and purchase criteria

    10 Geographic Landscape

    • 10.1 Geographic segmentation
      • Chart on Market share by geography 2023-2028 (%)
      • Data Table on Market share by geography 2023-2028 (%)
    • 10.2 Geographic comparison
      • Chart on Geographic comparison
      • Data Table on Geographic comparison
    • 10.3 APAC - Market size and forecast 2023-2028
      • Chart on APAC - Market size and forecast 2023-2028 ($ million)
      • Data Table on APAC - Market size and forecast 2023-2028 ($ million)
      • Chart on APAC - Year-over-year growth 2023-2028 (%)
      • Data Table on APAC - Year-over-year growth 2023-2028 (%)
    • 10.4 North America - Market size and forecast 2023-2028
      • Chart on North America - Market size and forecast 2023-2028 ($ million)
      • Data Table on North America - Market size and forecast 2023-2028 ($ million)
      • Chart on North America - Year-over-year growth 2023-2028 (%)
      • Data Table on North America - Year-over-year growth 2023-2028 (%)
    • 10.5 Europe - Market size and forecast 2023-2028
      • Chart on Europe - Market size and forecast 2023-2028 ($ million)
      • Data Table on Europe - Market size and forecast 2023-2028 ($ million)
      • Chart on Europe - Year-over-year growth 2023-2028 (%)
      • Data Table on Europe - Year-over-year growth 2023-2028 (%)
    • 10.6 South America - Market size and forecast 2023-2028
      • Chart on South America - Market size and forecast 2023-2028 ($ million)
      • Data Table on South America - Market size and forecast 2023-2028 ($ million)
      • Chart on South America - Year-over-year growth 2023-2028 (%)
      • Data Table on South America - Year-over-year growth 2023-2028 (%)
    • 10.7 Middle East and Africa - Market size and forecast 2023-2028
      • Chart on Middle East and Africa - Market size and forecast 2023-2028 ($ million)
      • Data Table on Middle East and Africa - Market size and forecast 2023-2028 ($ million)
      • Chart on Middle East and Africa - Year-over-year growth 2023-2028 (%)
      • Data Table on Middle East and Africa - Year-over-year growth 2023-2028 (%)
    • 10.8 China - Market size and forecast 2023-2028
      • Chart on China - Market size and forecast 2023-2028 ($ million)
      • Data Table on China - Market size and forecast 2023-2028 ($ million)
      • Chart on China - Year-over-year growth 2023-2028 (%)
      • Data Table on China - Year-over-year growth 2023-2028 (%)
    • 10.9 South Korea - Market size and forecast 2023-2028
      • Chart on South Korea - Market size and forecast 2023-2028 ($ million)
      • Data Table on South Korea - Market size and forecast 2023-2028 ($ million)
      • Chart on South Korea - Year-over-year growth 2023-2028 (%)
      • Data Table on South Korea - Year-over-year growth 2023-2028 (%)
    • 10.10 US - Market size and forecast 2023-2028
      • Chart on US - Market size and forecast 2023-2028 ($ million)
      • Data Table on US - Market size and forecast 2023-2028 ($ million)
      • Chart on US - Year-over-year growth 2023-2028 (%)
      • Data Table on US - Year-over-year growth 2023-2028 (%)
    • 10.11 Japan - Market size and forecast 2023-2028
      • Chart on Japan - Market size and forecast 2023-2028 ($ million)
      • Data Table on Japan - Market size and forecast 2023-2028 ($ million)
      • Chart on Japan - Year-over-year growth 2023-2028 (%)
      • Data Table on Japan - Year-over-year growth 2023-2028 (%)
    • 10.12 Canada - Market size and forecast 2023-2028
      • Chart on Canada - Market size and forecast 2023-2028 ($ million)
      • Data Table on Canada - Market size and forecast 2023-2028 ($ million)
      • Chart on Canada - Year-over-year growth 2023-2028 (%)
      • Data Table on Canada - Year-over-year growth 2023-2028 (%)
    • 10.13 Market opportunity by geography
      • Market opportunity by geography ($ million)
      • Data Tables on Market opportunity by geography ($ million)

    11 Drivers, Challenges, and Opportunity/Restraints

    • 11.1 Market drivers
      • 11.2 Market challenges
        • 11.3 Impact of drivers and challenges
          • Impact of drivers and challenges in 2023 and 2028
        • 11.4 Market opportunities/restraints

          12 Competitive Landscape

          • 12.1 Overview
            • 12.2 Competitive Landscape
              • Overview on criticality of inputs and factors of differentiation
            • 12.3 Landscape disruption
              • Overview on factors of disruption
            • 12.4 Industry risks
              • Impact of key risks on business

            13 Competitive Analysis

            • 13.1 Companies profiled
              • Companies covered
            • 13.2 Market positioning of companies
              • Matrix on companies position and classification
            • 13.3 Cisco Systems Inc.
              • Cisco Systems Inc. - Overview
              • Cisco Systems Inc. - Business segments
              • Cisco Systems Inc. - Key news
              • Cisco Systems Inc. - Key offerings
              • Cisco Systems Inc. - Segment focus
            • 13.4 Corning Inc.
              • Corning Inc. - Overview
              • Corning Inc. - Business segments
              • Corning Inc. - Key news
              • Corning Inc. - Key offerings
              • Corning Inc. - Segment focus
            • 13.5 FIBERONE LLC
              • FIBERONE LLC - Overview
              • FIBERONE LLC - Product / Service
              • FIBERONE LLC - Key offerings
            • 13.6 Fujikura Ltd.
              • Fujikura Ltd. - Overview
              • Fujikura Ltd. - Business segments
              • Fujikura Ltd. - Key offerings
              • Fujikura Ltd. - Segment focus
            • 13.7 Fujitsu Ltd.
              • Fujitsu Ltd. - Overview
              • Fujitsu Ltd. - Business segments
              • Fujitsu Ltd. - Key news
              • Fujitsu Ltd. - Key offerings
              • Fujitsu Ltd. - Segment focus
            • 13.8 Furukawa Electric Co. Ltd.
              • Furukawa Electric Co. Ltd. - Overview
              • Furukawa Electric Co. Ltd. - Business segments
              • Furukawa Electric Co. Ltd. - Key news
              • Furukawa Electric Co. Ltd. - Key offerings
              • Furukawa Electric Co. Ltd. - Segment focus
            • 13.9 II VI Inc.
              • II VI Inc. - Overview
              • II VI Inc. - Business segments
              • II VI Inc. - Key offerings
              • II VI Inc. - Segment focus
            • 13.10 Lumentum Holdings Inc.
              • Lumentum Holdings Inc. - Overview
              • Lumentum Holdings Inc. - Business segments
              • Lumentum Holdings Inc. - Key news
              • Lumentum Holdings Inc. - Key offerings
              • Lumentum Holdings Inc. - Segment focus
            • 13.11 Sumitomo Electric Industries Ltd.
              • Sumitomo Electric Industries Ltd. - Overview
              • Sumitomo Electric Industries Ltd. - Business segments
              • Sumitomo Electric Industries Ltd. - Key news
              • Sumitomo Electric Industries Ltd. - Key offerings
              • Sumitomo Electric Industries Ltd. - Segment focus
            • 13.12 TE Connectivity Ltd.
              • TE Connectivity Ltd. - Overview
              • TE Connectivity Ltd. - Business segments
              • TE Connectivity Ltd. - Key news
              • TE Connectivity Ltd. - Key offerings
              • TE Connectivity Ltd. - Segment focus

            14 Appendix

            • 14.1 Scope of the report
              • 14.2 Inclusions and exclusions checklist
                • Inclusions checklist
                • Exclusions checklist
              • 14.3 Currency conversion rates for US$
                • Currency conversion rates for US$
              • 14.4 Research methodology
                • Research methodology
              • 14.5 Data procurement
                • Information sources
              • 14.6 Data validation
                • Data validation
              • 14.7 Validation techniques employed for market sizing
                • Validation techniques employed for market sizing
              • 14.8 Data synthesis
                • Data synthesis
              • 14.9 360 degree market analysis
                • 360 degree market analysis
              • 14.10 List of abbreviations
                • List of abbreviations

              Research Methodology

              Technavio presents a detailed picture of the market by way of study, synthesis, and summation of data from multiple sources. The analysts have presented the various facets of the market with a particular focus on identifying the key industry influencers. The data thus presented is comprehensive, reliable, and the result of extensive research, both primary and secondary.

              INFORMATION SOURCES

              Primary sources

              • Manufacturers and suppliers
              • Channel partners
              • Industry experts
              • Strategic decision makers

              Secondary sources

              • Industry journals and periodicals
              • Government data
              • Financial reports of key industry players
              • Historical data
              • Press releases

              DATA ANALYSIS

              Data Synthesis

              • Collation of data
              • Estimation of key figures
              • Analysis of derived insights

              Data Validation

              • Triangulation with data models
              • Reference against proprietary databases
              • Corroboration with industry experts

              REPORT WRITING

              Qualitative

              • Market drivers
              • Market challenges
              • Market trends
              • Five forces analysis

              Quantitative

              • Market size and forecast
              • Market segmentation
              • Geographical insights
              • Competitive landscape

              Interested in this report?

              Get your sample now to see our research methodology and insights!

              Download Now

              Frequently Asked Questions

              Optical Interconnect market growth will increase by $ 16804.9 mn during 2024-2028 .

              The Optical Interconnect market is expected to grow at a CAGR of 20.62% during 2024-2028 .

              Optical Interconnect market is segmented by Fiber Type( Single-mode fiber, Multimode fiber) Connectivity( Rack level, Long-haul level, Chip and board level) Product Type( Optical transceivers, Connectors, Cable assemblies, Others)

              3M Co., Amphenol Corp., Cisco Systems Inc., Corning Inc., FIBERONE LLC, Fischer Connectors Holding SA, Fujikura Ltd., Fujitsu Ltd., Furukawa Electric Co. Ltd., II VI Inc., InnoLight Technology Ltd., Japan Aviation Electronics Industry Ltd., Lumentum Holdings Inc., Molex LLC, NINGBO LONGXING TELECOMMUNICATIONS EQUIPMENT MANUFACTURING CO. LT, NVIDIA Corp., Radiall SA, Sterlite Technologies Ltd., Sumitomo Electric Industries Ltd., TE Connectivity Ltd. are a few of the key vendors in the Optical Interconnect market.

              APAC will register the highest growth rate of 62% among the other regions. Therefore, the Optical Interconnect market in APAC is expected to garner significant business opportunities for the vendors during the forecast period.

              China, US, South Korea, Japan, Canada

              • Adoption of cloud databaseThe database consists of multiple servers that keep the data available for end-users. Databases store data in a digital format. On the other hand is the driving factor this market.
              • the cloud is an effective storage medium is the driving factor this market.
              • and the data stored on the cloud can be easily accessed. Commercial enterprises require very high storage capacity and need to access information and data from any location. Many enterprises use cloud-based storage services such as Amazon Web Services is the driving factor this market.
              • Amazon Cloud Drive is the driving factor this market.
              • Bit Torrent Sync is the driving factor this market.
              • Box is the driving factor this market.
              • Cubby is the driving factor this market.
              • Dropbox is the driving factor this market.
              • and Google Drive. The cloud database needs to process and combine multiple discrete data items in a single operation. Alternative storage that provides higher performance is required to handle this type of complex data. Fiber optical interconnects such as transceivers is the driving factor this market.
              • cable assemblies is the driving factor this market.
              • and cables offer future scalability is the driving factor this market.
              • higher capacities is the driving factor this market.
              • and lower energy. Optical interconnect is a feasible replacement for some networking infrastructure because of the advantages mentioned below. Supports 100 is the driving factor this market.
              • 000 times faster speeds than copper connectorsRequires no wear levelingProvides the highest endurance Delivers low-power operationThe demand for cloud-based storage is increasing because it provides better scalability and high storage availability. Cloud-based services such as platform-as-a-service (PaaS) and storage-as-a-service (SaaS) have created a huge demand for fiber optical interconnects. As the global spending by enterprises on cloud storage increases is the driving factor this market.
              • it will also boost the demand for fiber optical interconnect for cloud-based applications. Therefore is the driving factor this market.
              • CSPs are expected to adopt a variety of advanced equipment such as interconnects that enable higher processing speed is the driving factor this market.
              • give high storage capabilities is the driving factor this market.
              • are cost-effective is the driving factor this market.
              • and consume less power is the driving factor this market.
              • which will contribute to the growth of the global optical interconnect market during the forecast period. is the driving factor this market.

              The Optical Interconnect market vendors should focus on grabbing business opportunities from the Single-mode fiber segment as it accounted for the largest market share in the base year.