Optical Transport Network Equipment Market Analysis, Size, and Forecast 2026-2030: North America (US, Canada, and Mexico), APAC (China, Japan, and India), Europe (Germany, UK, and France), South America (Brazil and Argentina), Middle East and Africa (Saudi Arabia, UAE, and South Africa), and Rest of World (ROW)

Optical Transport Network Equipment Market Analysis, Size, and Forecast 2026-2030:
North America (US, Canada, and Mexico), APAC (China, Japan, and India), Europe (Germany, UK, and France), South America (Brazil and Argentina), Middle East and Africa (Saudi Arabia, UAE, and South Africa), and Rest of World (ROW)

Published: Mar 2026 339 Pages SKU: IRTNTR45423

Market Overview at a Glance

$5.69 B
Market Opportunity
3.8%
CAGR 2025 - 2030
35%
APAC Growth
$22.61 B
WDM segment 2024

Optical Transport Network Equipment Market Size 2026-2030

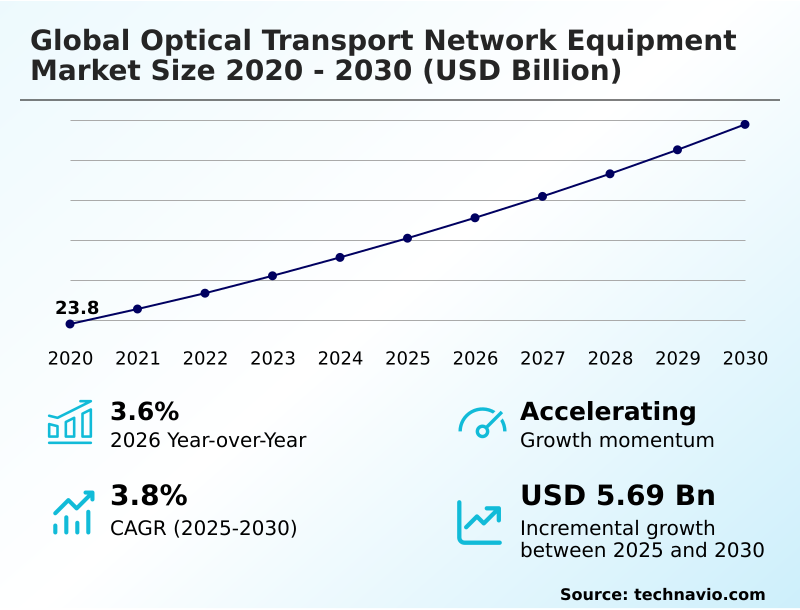
The optical transport network equipment market size is valued to increase by USD 5.69 billion, at a CAGR of 3.8% from 2025 to 2030. Exponential data traffic growth acceleration will drive the optical transport network equipment market.

Major Market Trends & Insights

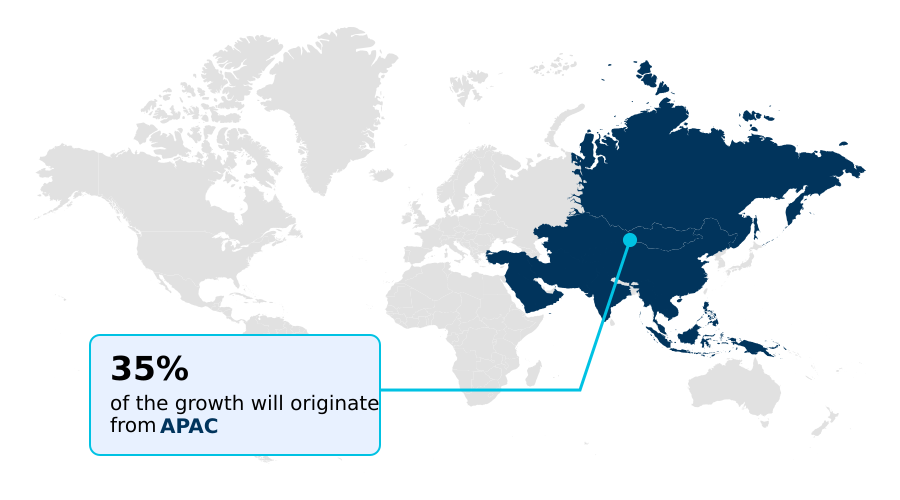
  • APAC dominated the market and accounted for a 35% growth during the forecast period.
  • By Technology - WDM segment was valued at USD 22.61 billion in 2024
  • By End-user - Communication service providers segment accounted for the largest market revenue share in 2024

Market Size & Forecast

  • Market Opportunities: USD 9.98 billion
  • Market Future Opportunities: USD 5.69 billion
  • CAGR from 2025 to 2030 : 3.8%

Market Summary

  • The optical transport network equipment market is the foundational layer of modern digital communication, enabling the high-capacity data transmission required by telecommunications carriers, cloud providers, and enterprises. This market revolves around specialized hardware and software, including systems for wavelength division multiplexing, which dramatically increases the capacity of fiber optic infrastructure.
  • Key components like the optical transponder and reconfigurable optical add-drop multiplexer manage the flow of data, while advanced technologies such as terabit coherent optical technology and probabilistic constellation shaping push the boundaries of performance. The relentless growth in data traffic, fueled by bandwidth-intensive applications and the expansion of 5G, drives continuous innovation.
  • Architectural shifts toward IP-optical convergence and open and disaggregated optical networking are transforming deployment models, offering greater flexibility. Concurrently, the integration of AI-driven network automation is becoming crucial for managing network complexity, optimizing end-to-end network performance, and enabling capabilities like predictive network maintenance.
  • This evolution ensures that the underlying infrastructure can support future demands from both consumer and industrial applications, making it a critical area of investment for digital transformation.

What will be the Size of the Optical Transport Network Equipment Market during the forecast period?

Get Key Insights on Market Forecast (PDF) Request Free Sample

How is the Optical Transport Network Equipment Market Segmented?

The optical transport network equipment industry research report provides comprehensive data (region-wise segment analysis), with forecasts and estimates in "USD million" for the period 2026-2030, as well as historical data from 2020-2024 for the following segments.
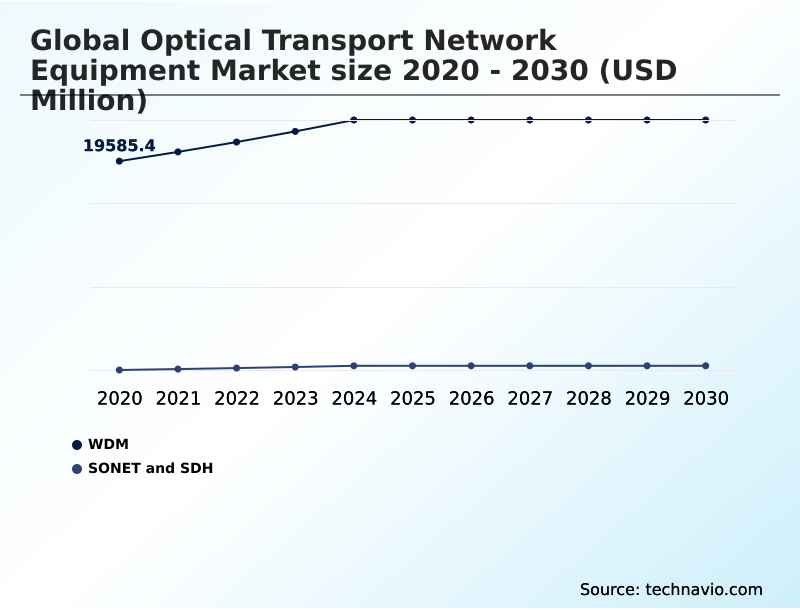
  • Technology
    • WDM
    • SONET and SDH
  • End-user
    • Communication service providers
    • Enterprises
    • Public sector
    • Others
  • Component
    • Hardware
    • Services
    • Software
  • Geography
    • North America
      • US
      • Canada
      • Mexico
    • APAC
      • China
      • Japan
      • India
    • Europe
      • Germany
      • UK
      • France
    • South America
      • Brazil
      • Argentina
    • Middle East and Africa
      • Saudi Arabia
      • UAE
      • South Africa
    • Rest of World (ROW)

By Technology Insights

The wdm segment is estimated to witness significant growth during the forecast period.

The optical transport network market is primarily defined by technology, with wavelength division multiplexing (WDM) being the dominant segment.

This technology, particularly dense wavelength division multiplexing, enables the transmission of multiple data streams over a single fiber using distinct optical wavelength assignments.

This method is essential for network capacity expansion to support growing IP traffic management needs from bandwidth-intensive applications and digital transformation initiatives.

Systems for optical channel monitoring are critical for managing these complex networks, ensuring low-latency data transmission across terrestrial fiber networks and long-haul backbone networks.

Advanced platforms now achieve superior spectral efficiency maximization, with industry reports showing that global internet bandwidth grew 23% in 2024, driving the need for continuous innovation in WDM for cloud service delivery.

Request Free Sample

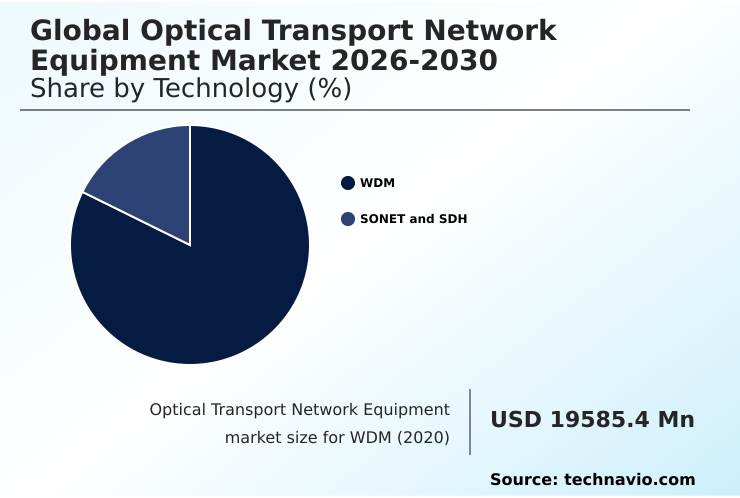
The WDM segment was valued at USD 22.61 billion in 2024 and showed a gradual increase during the forecast period.

Request Free Sample

Regional Analysis

APAC is estimated to contribute 35% to the growth of the global market during the forecast period.Technavio’s analysts have elaborately explained the regional trends and drivers that shape the market during the forecast period.

See How Optical Transport Network Equipment Market Demand is Rising in APAC Request Free Sample

The geographic landscape of the optical transport network market is diverse, with APAC leading as the largest region, contributing to 35% of incremental growth. North America remains a key market, driven by hyperscale data center expansion.

In Europe, a focus on energy-efficient networking and the modernization of legacy systems, including older SONET and SDH infrastructure, drives investment.

Across all regions, operators are deploying advanced hardware like the reconfigurable optical add-drop multiplexer and systems with sophisticated optical amplification using erbium-doped fiber amplifiers. Modern platforms use enhanced forward error correction and adaptive modulation algorithms for efficiency.

Geopolitical considerations and the need for quantum-safe encryption are increasingly influencing procurement decisions and strategies for intelligent capacity planning.

Market Dynamics

Our researchers analyzed the data with 2025 as the base year, along with the key drivers, trends, and challenges. A holistic analysis of drivers will help companies refine their marketing strategies to gain a competitive advantage.

  • Strategic decision-making in the optical transport network equipment market is increasingly nuanced, focusing on specific use cases and technological trade-offs. The debate over coherent pluggable optics vs transponders highlights a pivotal shift, with pluggables favored for their economic and operational benefits in metro networks.
  • The growing adoption of 800G coherent pluggable optics applications, especially for optical transport for AI training clusters, underscores the demand for high-density, low-latency connectivity. Exploring the disaggregated optical networking cost benefits is now a standard practice for operators seeking to avoid vendor lock-in, though it raises challenges in managing multi-vendor optical networks and testing optical network interoperability.
  • The role of AI in optical network fault prediction is transitioning from a concept to a core operational tool, crucial for maintaining service level agreements. For mobile infrastructure, designing effective optical transport for 5G fronthaul is critical for enabling advanced 5G services.
  • In data centers, data center interconnect latency optimization and the implementation of IP-optical convergence network architecture are top priorities. Automation, particularly through software-defined optical network management and automating optical service provisioning workflows, is essential for operational efficiency. Operators are also addressing sustainability by analyzing the power consumption in optical networks and reinforcing security through optical network security best practices.
  • For infrastructure planning, developing effective submarine cable capacity upgrade strategies and flexible grid WDM network design are key, alongside roadmaps for upgrading legacy SONET and SDH networks.
  • These focused strategies demonstrate a market maturity where optimizing the ROI of open optical networking is a primary goal, with some disaggregated models showing a total cost of ownership reduction of over 20% compared to traditional architectures.

What are the key market drivers leading to the rise in the adoption of Optical Transport Network Equipment Industry?

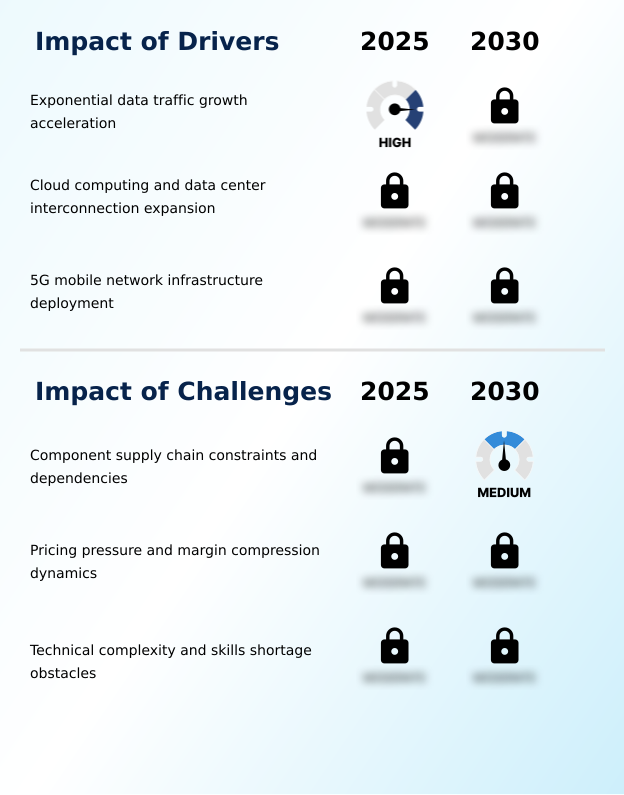
  • The exponential acceleration of data traffic, driven by bandwidth-intensive applications and cloud services, is a primary driver for market growth.

  • Market drivers are centered on escalating bandwidth demand. The expansion of data center interconnection is a primary factor, with hyperscaler purchases increasing 45% in late 2024 to support cloud computing workloads and emerging generative AI workloads.
  • The global deployment of 5G infrastructure is another critical driver, demanding robust optical backhaul solutions and high-capacity optical fronthaul connectivity for 5G radio access network support.
  • This requires sophisticated packet optical transport systems across both metro optical infrastructure and submarine cable systems. The push for IP-optical convergence and network slicing enablement further fuels demand for advanced equipment that provides low-latency data transmission essential for next-generation services.

What are the market trends shaping the Optical Transport Network Equipment Industry?

  • A primary trend influencing the market is the accelerating adoption of coherent pluggable optics. This architectural shift enables direct integration of advanced transmission capabilities into routing and switching equipment.

  • Evolving architectural trends are reshaping the market, led by the adoption of coherent pluggable optics in compact formats like the QSFP-DD form factor. This shift toward 400ZR coherent modules and 800ZR coherent modules facilitates total cost of ownership reduction. Concurrently, open and disaggregated optical networking is gaining traction, promoting multi-vendor interoperability.
  • The integration of AI-driven network automation enables advanced capabilities such as predictive network maintenance and automated service provisioning, with some deployments improving network utilization efficiency by 31%. Furthermore, software-defined optical networking and real-time traffic engineering allow for dynamic control, enhancing end-to-end network performance and reducing service provisioning times from days to hours.

What challenges does the Optical Transport Network Equipment Industry face during its growth?

  • A key challenge affecting industry growth is the persistent constraints and dependencies within the component supply chain.

  • The market faces significant headwinds, primarily from component supply chain constraints and pricing pressure dynamics. Critical subsystems relying on indium phosphide components and advanced photonic integrated circuit designs experienced lead times extending up to 52 weeks. The limited availability of the coherent digital signal processor and challenges in silicon photonics integration create bottlenecks.
  • Concurrently, increasing technical complexity challenges and skills shortage obstacles hinder deployment and maintenance, complicating efforts toward mean time to repair reduction. While operators desire procurement flexibility, the need for specialized expertise for remote infrastructure management, network function virtualization, and cybersecurity threat detection adds to operational costs, with some estimates suggesting a need for 180,000 new technicians in the US alone.

Exclusive Technavio Analysis on Customer Landscape

The optical transport network equipment market forecasting report includes the adoption lifecycle of the market, covering from the innovator’s stage to the laggard’s stage. It focuses on adoption rates in different regions based on penetration. Furthermore, the optical transport network equipment market report also includes key purchase criteria and drivers of price sensitivity to help companies evaluate and develop their market growth analysis strategies.

Customer Landscape of Optical Transport Network Equipment Industry

Competitive Landscape

Companies are implementing various strategies, such as strategic alliances, optical transport network equipment market forecast, partnerships, mergers and acquisitions, geographical expansion, and product/service launches, to enhance their presence in the industry.

Adtran Holdings Inc. - Key offerings include high-capacity optical transmission hardware, advanced network management software, and integrated systems designed to scale modern digital infrastructure.

The industry research and growth report includes detailed analyses of the competitive landscape of the market and information about key companies, including:

  • Adtran Holdings Inc.
  • Aliathon Technology
  • Ciena Corp.
  • Cisco Systems Inc.
  • Deutsche Telekom AG
  • Ekinops SA
  • FiberHome
  • Fujitsu Ltd.
  • Huawei Technologies Co. Ltd.
  • Infinera Corp.
  • Juniper Networks Inc.
  • Mitsubishi Electric Corp.
  • NEC Corp.
  • Padtec Holding S.A.
  • Ribbon Communications Inc.
  • Tejas Network Ltd.
  • Telefonaktiebolaget Ericsson
  • Yokogawa Electric Corp.
  • ZTE Corp.

Qualitative and quantitative analysis of companies has been conducted to help clients understand the wider business environment as well as the strengths and weaknesses of key industry players. Data is qualitatively analyzed to categorize companies as pure play, category-focused, industry-focused, and diversified; it is quantitatively analyzed to categorize companies as dominant, leading, strong, tentative, and weak.

Recent Development and News in Optical transport network equipment market

  • In November 2024, Nokia announced the integration of Infinera's coherent pluggable technologies into its portfolio, demonstrating a unified roadmap targeting 1.6 terabit solutions post-acquisition.
  • In January 2025, Ciena Corp. reported new deployments of its coherent pluggable optics with neoscaler companies, which are leveraging the technology to build high-capacity optical links for AI infrastructure connecting distributed GPU clusters.
  • In March 2025, Alibaba Cloud announced a significant expansion of its infrastructure in Southeast Asia, deploying new availability zones that rely on high-capacity optical transport for integration into its global network.
  • In May 2025, IBM Cloud revealed enhancements to its hybrid cloud offerings, introducing advanced connectivity options that utilize high-bandwidth optical networking to ensure seamless interconnection between on-premises and cloud data centers.

Dive into Technavio’s robust research methodology, blending expert interviews, extensive data synthesis, and validated models for unparalleled Optical Transport Network Equipment Market insights. See full methodology.

Market Scope
Page number 339
Base year 2025
Historic period 2020-2024
Forecast period 2026-2030
Growth momentum & CAGR Accelerate at a CAGR of 3.8%
Market growth 2026-2030 USD 5687.9 million
Market structure Fragmented
YoY growth 2025-2026(%) 3.6%
Key countries US, Canada, Mexico, China, Japan, India, South Korea, Australia, Indonesia, Germany, UK, France, Italy, Spain, The Netherlands, Brazil, Argentina, Chile, Saudi Arabia, UAE, South Africa, Israel and Turkey
Competitive landscape Leading Companies, Market Positioning of Companies, Competitive Strategies, and Industry Risks

Request Free Sample

Research Analyst Overview

  • The optical transport network equipment market is undergoing a significant architectural evolution driven by insatiable bandwidth demand. Core technologies like wavelength division multiplexing and its high-capacity variant, dense wavelength division multiplexing, remain fundamental to scaling fiber optic infrastructure.
  • The innovation focus has shifted to the component level, with coherent pluggable optics in QSFP-DD form factor and OSFP configurations revolutionizing data center interconnection. These modules, leveraging advanced photonic integrated circuit designs with silicon photonics integration and indium phosphide components, are displacing traditional optical transponder systems.
  • Inside, the coherent digital signal processor enables complex techniques like probabilistic constellation shaping and robust forward error correction. For network management, software-defined optical networking and IP-optical convergence are key, supported by hardware such as the reconfigurable optical add-drop multiplexer and optical switching matrix.
  • This ecosystem, which includes the optical line system, ensures efficient optical amplification and management of each optical wavelength. This transition facilitates new deployment models like packet optical transport and robust optical backhaul solutions for 5G, while also managing the migration from legacy SONET and SDH systems.
  • Some carriers have leveraged these advancements to reduce service provisioning times from days to mere hours.

What are the Key Data Covered in this Optical Transport Network Equipment Market Research and Growth Report?

  • What is the expected growth of the Optical Transport Network Equipment Market between 2026 and 2030?

    • USD 5.69 billion, at a CAGR of 3.8%

  • What segmentation does the market report cover?

    • The report is segmented by Technology (WDM, and SONET and SDH), End-user (Communication service providers, Enterprises, Public sector, and Others), Component (Hardware, Services, and Software) and Geography (North America, APAC, Europe, South America, Middle East and Africa)

  • Which regions are analyzed in the report?

    • North America, APAC, Europe, South America and Middle East and Africa

  • What are the key growth drivers and market challenges?

    • Exponential data traffic growth acceleration, Component supply chain constraints and dependencies

  • Who are the major players in the Optical Transport Network Equipment Market?

    • Adtran Holdings Inc., Aliathon Technology, Ciena Corp., Cisco Systems Inc., Deutsche Telekom AG, Ekinops SA, FiberHome, Fujitsu Ltd., Huawei Technologies Co. Ltd., Infinera Corp., Juniper Networks Inc., Mitsubishi Electric Corp., NEC Corp., Padtec Holding S.A., Ribbon Communications Inc., Tejas Network Ltd., Telefonaktiebolaget Ericsson, Yokogawa Electric Corp. and ZTE Corp.

Market Research Insights

  • Market dynamics are shaped by a confluence of technological innovation and operational imperatives. The shift toward AI-driven network automation and predictive network maintenance is paramount, with some operators achieving a 31% improvement in network utilization. The adoption of open and disaggregated optical networking enhances multi-vendor interoperability, while data center interconnection demands optimized low-latency data transmission to support cloud computing workloads.
  • Advanced multi-layer network orchestration enables automated service provisioning and real-time traffic engineering for network slicing enablement. This focus on efficiency drives total cost of ownership reduction and supports network capacity expansion for 5G radio access network support.
  • As digital transformation initiatives accelerate, the emphasis on cybersecurity threat detection, energy-efficient networking, and quantum-safe encryption is intensifying, influencing both technology and investment strategies.

We can help! Our analysts can customize this optical transport network equipment market research report to meet your requirements.

Get in touch

1. Executive Summary

1.1 Market overview

Executive Summary - Chart on Market Overview
Executive Summary - Data Table on Market Overview
Executive Summary - Chart on Global Market Characteristics
Executive Summary - Chart on Market by Geography
Executive Summary - Chart on Market Segmentation by Technology
Executive Summary - Chart on Market Segmentation by End-user
Executive Summary - Chart on Market Segmentation by Component
Executive Summary - Chart on Incremental Growth
Executive Summary - Data Table on Incremental Growth
Executive Summary - Chart on Company Market Positioning

2. Technavio Analysis

2.1 Analysis of price sensitivity, lifecycle, customer purchase basket, adoption rates, and purchase criteria

2.2 Criticality of inputs and Factors of differentiation

Chart on Overview on criticality of inputs and factors of differentiation

2.3 Factors of disruption

Chart on Overview on factors of disruption

2.4 Impact of drivers and challenges

Chart on Impact of drivers and challenges in 2025 and 2030

3. Market Landscape

3.1 Market ecosystem

Chart on Parent Market
Data Table on - Parent Market

3.2 Market characteristics

Chart on Market characteristics analysis

3.3 Value chain analysis

Chart on Value chain analysis

4. Market Sizing

4.1 Market definition

Data Table on Offerings of companies included in the market definition

4.2 Market segment analysis

Market segments

4.3 Market size 2025

4.4 Market outlook: Forecast for 2025-2030

Chart on Global - Market size and forecast 2025-2030 ($ million)
Data Table on Global - Market size and forecast 2025-2030 ($ million)
Chart on Global Market: Year-over-year growth 2025-2030 (%)
Data Table on Global Market: Year-over-year growth 2025-2030 (%)

5. Historic Market Size

5.1 Global Optical Transport Network Equipment Market 2020 - 2024

Historic Market Size - Data Table on Global Optical Transport Network Equipment Market 2020 - 2024 ($ million)

5.2 Technology segment analysis 2020 - 2024

Historic Market Size - Technology Segment 2020 - 2024 ($ million)

5.3 End-user segment analysis 2020 - 2024

Historic Market Size - End-user Segment 2020 - 2024 ($ million)

5.4 Component segment analysis 2020 - 2024

Historic Market Size - Component Segment 2020 - 2024 ($ million)

5.5 Geography segment analysis 2020 - 2024

Historic Market Size - Geography Segment 2020 - 2024 ($ million)

5.6 Country segment analysis 2020 - 2024

Historic Market Size - Country Segment 2020 - 2024 ($ million)

6. Qualitative Analysis

6.1 Impact of AI on Global Optical Transport Network Equipment Market

7. Five Forces Analysis

7.1 Five forces summary

Five forces analysis - Comparison between 2025 and 2030

7.2 Bargaining power of buyers

Bargaining power of buyers - Impact of key factors 2025 and 2030

7.3 Bargaining power of suppliers

Bargaining power of suppliers - Impact of key factors in 2025 and 2030

7.4 Threat of new entrants

Threat of new entrants - Impact of key factors in 2025 and 2030

7.5 Threat of substitutes

Threat of substitutes - Impact of key factors in 2025 and 2030

7.6 Threat of rivalry

Threat of rivalry - Impact of key factors in 2025 and 2030

7.7 Market condition

Chart on Market condition - Five forces 2025 and 2030

8. Market Segmentation by Technology

8.1 Market segments

Chart on Technology - Market share 2025-2030 (%)
Data Table on Technology - Market share 2025-2030 (%)

8.2 Comparison by Technology

Chart on Comparison by Technology
Data Table on Comparison by Technology

8.3 WDM - Market size and forecast 2025-2030

Chart on WDM - Market size and forecast 2025-2030 ($ million)
Data Table on WDM - Market size and forecast 2025-2030 ($ million)
Chart on WDM - Year-over-year growth 2025-2030 (%)
Data Table on WDM - Year-over-year growth 2025-2030 (%)

8.4 SONET and SDH - Market size and forecast 2025-2030

Chart on SONET and SDH - Market size and forecast 2025-2030 ($ million)
Data Table on SONET and SDH - Market size and forecast 2025-2030 ($ million)
Chart on SONET and SDH - Year-over-year growth 2025-2030 (%)
Data Table on SONET and SDH - Year-over-year growth 2025-2030 (%)

8.5 Market opportunity by Technology

Market opportunity by Technology ($ million)
Data Table on Market opportunity by Technology ($ million)

9. Market Segmentation by End-user

9.1 Market segments

Chart on End-user - Market share 2025-2030 (%)
Data Table on End-user - Market share 2025-2030 (%)

9.2 Comparison by End-user

Chart on Comparison by End-user
Data Table on Comparison by End-user

9.3 Communication service providers - Market size and forecast 2025-2030

Chart on Communication service providers - Market size and forecast 2025-2030 ($ million)
Data Table on Communication service providers - Market size and forecast 2025-2030 ($ million)
Chart on Communication service providers - Year-over-year growth 2025-2030 (%)
Data Table on Communication service providers - Year-over-year growth 2025-2030 (%)

9.4 Enterprises - Market size and forecast 2025-2030

Chart on Enterprises - Market size and forecast 2025-2030 ($ million)
Data Table on Enterprises - Market size and forecast 2025-2030 ($ million)
Chart on Enterprises - Year-over-year growth 2025-2030 (%)
Data Table on Enterprises - Year-over-year growth 2025-2030 (%)

9.5 Public sector - Market size and forecast 2025-2030

Chart on Public sector - Market size and forecast 2025-2030 ($ million)
Data Table on Public sector - Market size and forecast 2025-2030 ($ million)
Chart on Public sector - Year-over-year growth 2025-2030 (%)
Data Table on Public sector - Year-over-year growth 2025-2030 (%)

9.6 Others - Market size and forecast 2025-2030

Chart on Others - Market size and forecast 2025-2030 ($ million)
Data Table on Others - Market size and forecast 2025-2030 ($ million)
Chart on Others - Year-over-year growth 2025-2030 (%)
Data Table on Others - Year-over-year growth 2025-2030 (%)

9.7 Market opportunity by End-user

Market opportunity by End-user ($ million)
Data Table on Market opportunity by End-user ($ million)

10. Market Segmentation by Component

10.1 Market segments

Chart on Component - Market share 2025-2030 (%)
Data Table on Component - Market share 2025-2030 (%)

10.2 Comparison by Component

Chart on Comparison by Component
Data Table on Comparison by Component

10.3 Hardware - Market size and forecast 2025-2030

Chart on Hardware - Market size and forecast 2025-2030 ($ million)
Data Table on Hardware - Market size and forecast 2025-2030 ($ million)
Chart on Hardware - Year-over-year growth 2025-2030 (%)
Data Table on Hardware - Year-over-year growth 2025-2030 (%)

10.4 Services - Market size and forecast 2025-2030

Chart on Services - Market size and forecast 2025-2030 ($ million)
Data Table on Services - Market size and forecast 2025-2030 ($ million)
Chart on Services - Year-over-year growth 2025-2030 (%)
Data Table on Services - Year-over-year growth 2025-2030 (%)

10.5 Software - Market size and forecast 2025-2030

Chart on Software - Market size and forecast 2025-2030 ($ million)
Data Table on Software - Market size and forecast 2025-2030 ($ million)
Chart on Software - Year-over-year growth 2025-2030 (%)
Data Table on Software - Year-over-year growth 2025-2030 (%)

10.6 Market opportunity by Component

Market opportunity by Component ($ million)
Data Table on Market opportunity by Component ($ million)

11. Customer Landscape

11.1 Customer landscape overview

Analysis of price sensitivity, lifecycle, customer purchase basket, adoption rates, and purchase criteria

12. Geographic Landscape

12.1 Geographic segmentation

Chart on Market share by geography 2025-2030 (%)
Data Table on Market share by geography 2025-2030 (%)

12.2 Geographic comparison

Chart on Geographic comparison
Data Table on Geographic comparison

12.3 North America - Market size and forecast 2025-2030

Chart on North America - Market size and forecast 2025-2030 ($ million)
Data Table on North America - Market size and forecast 2025-2030 ($ million)
Chart on North America - Year-over-year growth 2025-2030 (%)
Data Table on North America - Year-over-year growth 2025-2030 (%)
Chart on Regional Comparison - North America
Data Table on Regional Comparison - North America

12.3.1 US - Market size and forecast 2025-2030

Chart on US - Market size and forecast 2025-2030 ($ million)
Data Table on US - Market size and forecast 2025-2030 ($ million)
Chart on US - Year-over-year growth 2025-2030 (%)
Data Table on US - Year-over-year growth 2025-2030 (%)

12.3.2 Canada - Market size and forecast 2025-2030

Chart on Canada - Market size and forecast 2025-2030 ($ million)
Data Table on Canada - Market size and forecast 2025-2030 ($ million)
Chart on Canada - Year-over-year growth 2025-2030 (%)
Data Table on Canada - Year-over-year growth 2025-2030 (%)

12.3.3 Mexico - Market size and forecast 2025-2030

Chart on Mexico - Market size and forecast 2025-2030 ($ million)
Data Table on Mexico - Market size and forecast 2025-2030 ($ million)
Chart on Mexico - Year-over-year growth 2025-2030 (%)
Data Table on Mexico - Year-over-year growth 2025-2030 (%)

12.4 APAC - Market size and forecast 2025-2030

Chart on APAC - Market size and forecast 2025-2030 ($ million)
Data Table on APAC - Market size and forecast 2025-2030 ($ million)
Chart on APAC - Year-over-year growth 2025-2030 (%)
Data Table on APAC - Year-over-year growth 2025-2030 (%)
Chart on Regional Comparison - APAC
Data Table on Regional Comparison - APAC

12.4.1 China - Market size and forecast 2025-2030

Chart on China - Market size and forecast 2025-2030 ($ million)
Data Table on China - Market size and forecast 2025-2030 ($ million)
Chart on China - Year-over-year growth 2025-2030 (%)
Data Table on China - Year-over-year growth 2025-2030 (%)

12.4.2 Japan - Market size and forecast 2025-2030

Chart on Japan - Market size and forecast 2025-2030 ($ million)
Data Table on Japan - Market size and forecast 2025-2030 ($ million)
Chart on Japan - Year-over-year growth 2025-2030 (%)
Data Table on Japan - Year-over-year growth 2025-2030 (%)

12.4.3 India - Market size and forecast 2025-2030

Chart on India - Market size and forecast 2025-2030 ($ million)
Data Table on India - Market size and forecast 2025-2030 ($ million)
Chart on India - Year-over-year growth 2025-2030 (%)
Data Table on India - Year-over-year growth 2025-2030 (%)

12.4.4 South Korea - Market size and forecast 2025-2030

Chart on South Korea - Market size and forecast 2025-2030 ($ million)
Data Table on South Korea - Market size and forecast 2025-2030 ($ million)
Chart on South Korea - Year-over-year growth 2025-2030 (%)
Data Table on South Korea - Year-over-year growth 2025-2030 (%)

12.4.5 Australia - Market size and forecast 2025-2030

Chart on Australia - Market size and forecast 2025-2030 ($ million)
Data Table on Australia - Market size and forecast 2025-2030 ($ million)
Chart on Australia - Year-over-year growth 2025-2030 (%)
Data Table on Australia - Year-over-year growth 2025-2030 (%)

12.4.6 Indonesia - Market size and forecast 2025-2030

Chart on Indonesia - Market size and forecast 2025-2030 ($ million)
Data Table on Indonesia - Market size and forecast 2025-2030 ($ million)
Chart on Indonesia - Year-over-year growth 2025-2030 (%)
Data Table on Indonesia - Year-over-year growth 2025-2030 (%)

12.5 Europe - Market size and forecast 2025-2030

Chart on Europe - Market size and forecast 2025-2030 ($ million)
Data Table on Europe - Market size and forecast 2025-2030 ($ million)
Chart on Europe - Year-over-year growth 2025-2030 (%)
Data Table on Europe - Year-over-year growth 2025-2030 (%)
Chart on Regional Comparison - Europe
Data Table on Regional Comparison - Europe

12.5.1 Germany - Market size and forecast 2025-2030

Chart on Germany - Market size and forecast 2025-2030 ($ million)
Data Table on Germany - Market size and forecast 2025-2030 ($ million)
Chart on Germany - Year-over-year growth 2025-2030 (%)
Data Table on Germany - Year-over-year growth 2025-2030 (%)

12.5.2 UK - Market size and forecast 2025-2030

Chart on UK - Market size and forecast 2025-2030 ($ million)
Data Table on UK - Market size and forecast 2025-2030 ($ million)
Chart on UK - Year-over-year growth 2025-2030 (%)
Data Table on UK - Year-over-year growth 2025-2030 (%)

12.5.3 France - Market size and forecast 2025-2030

Chart on France - Market size and forecast 2025-2030 ($ million)
Data Table on France - Market size and forecast 2025-2030 ($ million)
Chart on France - Year-over-year growth 2025-2030 (%)
Data Table on France - Year-over-year growth 2025-2030 (%)

12.5.4 Italy - Market size and forecast 2025-2030

Chart on Italy - Market size and forecast 2025-2030 ($ million)
Data Table on Italy - Market size and forecast 2025-2030 ($ million)
Chart on Italy - Year-over-year growth 2025-2030 (%)
Data Table on Italy - Year-over-year growth 2025-2030 (%)

12.5.5 Spain - Market size and forecast 2025-2030

Chart on Spain - Market size and forecast 2025-2030 ($ million)
Data Table on Spain - Market size and forecast 2025-2030 ($ million)
Chart on Spain - Year-over-year growth 2025-2030 (%)
Data Table on Spain - Year-over-year growth 2025-2030 (%)

12.5.6 The Netherlands - Market size and forecast 2025-2030

Chart on The Netherlands - Market size and forecast 2025-2030 ($ million)
Data Table on The Netherlands - Market size and forecast 2025-2030 ($ million)
Chart on The Netherlands - Year-over-year growth 2025-2030 (%)
Data Table on The Netherlands - Year-over-year growth 2025-2030 (%)

12.6 South America - Market size and forecast 2025-2030

Chart on South America - Market size and forecast 2025-2030 ($ million)
Data Table on South America - Market size and forecast 2025-2030 ($ million)
Chart on South America - Year-over-year growth 2025-2030 (%)
Data Table on South America - Year-over-year growth 2025-2030 (%)
Chart on Regional Comparison - South America
Data Table on Regional Comparison - South America

12.6.1 Brazil - Market size and forecast 2025-2030

Chart on Brazil - Market size and forecast 2025-2030 ($ million)
Data Table on Brazil - Market size and forecast 2025-2030 ($ million)
Chart on Brazil - Year-over-year growth 2025-2030 (%)
Data Table on Brazil - Year-over-year growth 2025-2030 (%)

12.6.2 Argentina - Market size and forecast 2025-2030

Chart on Argentina - Market size and forecast 2025-2030 ($ million)
Data Table on Argentina - Market size and forecast 2025-2030 ($ million)
Chart on Argentina - Year-over-year growth 2025-2030 (%)
Data Table on Argentina - Year-over-year growth 2025-2030 (%)

12.6.3 Chile - Market size and forecast 2025-2030

Chart on Chile - Market size and forecast 2025-2030 ($ million)
Data Table on Chile - Market size and forecast 2025-2030 ($ million)
Chart on Chile - Year-over-year growth 2025-2030 (%)
Data Table on Chile - Year-over-year growth 2025-2030 (%)

12.7 Middle East and Africa - Market size and forecast 2025-2030

Chart on Middle East and Africa - Market size and forecast 2025-2030 ($ million)
Data Table on Middle East and Africa - Market size and forecast 2025-2030 ($ million)
Chart on Middle East and Africa - Year-over-year growth 2025-2030 (%)
Data Table on Middle East and Africa - Year-over-year growth 2025-2030 (%)
Chart on Regional Comparison - Middle East and Africa
Data Table on Regional Comparison - Middle East and Africa

12.7.1 Saudi Arabia - Market size and forecast 2025-2030

Chart on Saudi Arabia - Market size and forecast 2025-2030 ($ million)
Data Table on Saudi Arabia - Market size and forecast 2025-2030 ($ million)
Chart on Saudi Arabia - Year-over-year growth 2025-2030 (%)
Data Table on Saudi Arabia - Year-over-year growth 2025-2030 (%)

12.7.2 UAE - Market size and forecast 2025-2030

Chart on UAE - Market size and forecast 2025-2030 ($ million)
Data Table on UAE - Market size and forecast 2025-2030 ($ million)
Chart on UAE - Year-over-year growth 2025-2030 (%)
Data Table on UAE - Year-over-year growth 2025-2030 (%)

12.7.3 South Africa - Market size and forecast 2025-2030

Chart on South Africa - Market size and forecast 2025-2030 ($ million)
Data Table on South Africa - Market size and forecast 2025-2030 ($ million)
Chart on South Africa - Year-over-year growth 2025-2030 (%)
Data Table on South Africa - Year-over-year growth 2025-2030 (%)

12.7.4 Israel - Market size and forecast 2025-2030

Chart on Israel - Market size and forecast 2025-2030 ($ million)
Data Table on Israel - Market size and forecast 2025-2030 ($ million)
Chart on Israel - Year-over-year growth 2025-2030 (%)
Data Table on Israel - Year-over-year growth 2025-2030 (%)

12.7.5 Turkey - Market size and forecast 2025-2030

Chart on Turkey - Market size and forecast 2025-2030 ($ million)
Data Table on Turkey - Market size and forecast 2025-2030 ($ million)
Chart on Turkey - Year-over-year growth 2025-2030 (%)
Data Table on Turkey - Year-over-year growth 2025-2030 (%)

12.8 Market opportunity by geography

Market opportunity by geography ($ million)
Data Tables on Market opportunity by geography ($ million)

13. Drivers, Challenges, and Opportunity

13.1 Market drivers

Exponential data traffic growth acceleration
Cloud computing and data center interconnection expansion
5G mobile network infrastructure deployment

13.2 Market challenges

Component supply chain constraints and dependencies
Pricing pressure and margin compression dynamics
Technical complexity and skills shortage obstacles

13.3 Impact of drivers and challenges

Impact of drivers and challenges in 2025 and 2030

13.4 Market opportunities

Coherent pluggable optics market acceleration
Open and disaggregated optical networking adoption
AI-driven network automation and intelligence

14. Competitive Landscape

14.1 Overview

14.2

Overview on criticality of inputs and factors of differentiation

14.3 Landscape disruption

Overview on factors of disruption

14.4 Industry risks

Impact of key risks on business

15. Competitive Analysis

15.1 Companies profiled

Companies covered

15.2 Company ranking index

15.3 Market positioning of companies

Matrix on companies position and classification

15.4 Adtran Holdings Inc.

Adtran Holdings Inc. - Overview
Adtran Holdings Inc. - Business segments
Adtran Holdings Inc. - Key offerings
Adtran Holdings Inc. - Segment focus
SWOT

15.5 Aliathon Technology

Aliathon Technology - Overview
Aliathon Technology - Product / Service
Aliathon Technology - Key offerings
SWOT

15.6 Cisco Systems Inc.

Cisco Systems Inc. - Overview
Cisco Systems Inc. - Business segments
Cisco Systems Inc. - Key news
Cisco Systems Inc. - Key offerings
Cisco Systems Inc. - Segment focus
SWOT

15.7 Deutsche Telekom AG

Deutsche Telekom AG - Overview
Deutsche Telekom AG - Business segments
Deutsche Telekom AG - Key offerings
Deutsche Telekom AG - Segment focus
SWOT

15.8 Ekinops SA

Ekinops SA - Overview
Ekinops SA - Product / Service
Ekinops SA - Key offerings
SWOT

15.9 Fujitsu Ltd.

Fujitsu Ltd. - Overview
Fujitsu Ltd. - Business segments
Fujitsu Ltd. - Key news
Fujitsu Ltd. - Key offerings
Fujitsu Ltd. - Segment focus
SWOT

15.10 Huawei Technologies Co. Ltd.

Huawei Technologies Co. Ltd. - Overview
Huawei Technologies Co. Ltd. - Business segments
Huawei Technologies Co. Ltd. - Key news
Huawei Technologies Co. Ltd. - Key offerings
Huawei Technologies Co. Ltd. - Segment focus
SWOT

15.11 Infinera Corp.

Infinera Corp. - Overview
Infinera Corp. - Product / Service
Infinera Corp. - Key news
Infinera Corp. - Key offerings
SWOT

15.12 Juniper Networks Inc.

Juniper Networks Inc. - Overview
Juniper Networks Inc. - Product / Service
Juniper Networks Inc. - Key news
Juniper Networks Inc. - Key offerings
SWOT

15.13 Mitsubishi Electric Corp.

Mitsubishi Electric Corp. - Overview
Mitsubishi Electric Corp. - Business segments
Mitsubishi Electric Corp. - Key offerings
Mitsubishi Electric Corp. - Segment focus
SWOT

15.14 NEC Corp.

NEC Corp. - Overview
NEC Corp. - Business segments
NEC Corp. - Key news
NEC Corp. - Key offerings
NEC Corp. - Segment focus
SWOT

15.15 Ribbon Communications Inc.

Ribbon Communications Inc. - Overview
Ribbon Communications Inc. - Business segments
Ribbon Communications Inc. - Key offerings
Ribbon Communications Inc. - Segment focus
SWOT

15.16 Telefonaktiebolaget Ericsson

Telefonaktiebolaget Ericsson - Overview
Telefonaktiebolaget Ericsson - Business segments
Telefonaktiebolaget Ericsson - Key news
Telefonaktiebolaget Ericsson - Key offerings
Telefonaktiebolaget Ericsson - Segment focus
SWOT

15.17 Yokogawa Electric Corp.

Yokogawa Electric Corp. - Overview
Yokogawa Electric Corp. - Business segments
Yokogawa Electric Corp. - Key news
Yokogawa Electric Corp. - Key offerings
Yokogawa Electric Corp. - Segment focus
SWOT

15.18 ZTE Corp.

ZTE Corp. - Overview
ZTE Corp. - Business segments
ZTE Corp. - Key offerings
ZTE Corp. - Segment focus
SWOT

16. Appendix

16.1 Scope of the report

Market definition
Objectives
Notes and caveats

16.2 Inclusions and exclusions checklist

Inclusions checklist
Exclusions checklist

16.3 Currency conversion rates for US$

16.4 Research methodology

16.5 Data procurement

Information sources

16.6 Data validation

16.7 Validation techniques employed for market sizing

16.8 Data synthesis

16.9 360 degree market analysis

16.10 List of abbreviations

Research Methodology

Technavio presents a detailed picture of the market by way of study, synthesis, and summation of data from multiple sources. The analysts have presented the various facets of the market with a particular focus on identifying the key industry influencers. The data thus presented is comprehensive, reliable, and the result of extensive research, both primary and secondary.

INFORMATION SOURCES

Primary sources

  • Manufacturers and suppliers
  • Channel partners
  • Industry experts
  • Strategic decision makers

Secondary sources

  • Industry journals and periodicals
  • Government data
  • Financial reports of key industry players
  • Historical data
  • Press releases

DATA ANALYSIS

Data Synthesis

  • Collation of data
  • Estimation of key figures
  • Analysis of derived insights

Data Validation

  • Triangulation with data models
  • Reference against proprietary databases
  • Corroboration with industry experts

REPORT WRITING

Qualitative

  • Market drivers
  • Market challenges
  • Market trends
  • Five forces analysis

Quantitative

  • Market size and forecast
  • Market segmentation
  • Geographical insights
  • Competitive landscape

Interested in this report?

Get your sample now to see our research methodology and insights!

Download Now

Frequently Asked Questions

Optical Transport Network Equipment market growth will increase by USD 5687.9 million during 2026-2030.

The Optical Transport Network Equipment market is expected to grow at a CAGR of 3.8% during 2026-2030.

Optical Transport Network Equipment market is segmented by Technology (WDM, SONET and SDH) End-user (Communication service providers, Enterprises, Public sector, Others) Component (Hardware, Services, Software)

Adtran Holdings Inc., Aliathon Technology, Ciena Corp., Cisco Systems Inc., Deutsche Telekom AG, Ekinops SA, FiberHome, Fujitsu Ltd., Huawei Technologies Co. Ltd., Infinera Corp., Juniper Networks Inc., Mitsubishi Electric Corp., NEC Corp., Padtec Holding S.A., Ribbon Communications Inc., Tejas Network Ltd., Telefonaktiebolaget Ericsson, Yokogawa Electric Corp., ZTE Corp. are a few of the key vendors in the Optical Transport Network Equipment market.

APAC will register the highest growth rate of 35% among the other regions. Therefore, the Optical Transport Network Equipment market in APAC is expected to garner significant business opportunities for the vendors during the forecast period.

US, Canada, Mexico, China, Japan, India, South Korea, Australia, Indonesia, Germany, UK, France, Italy, Spain, The Netherlands, Brazil, Argentina, Chile, Saudi Arabia, UAE, South Africa, Israel, Turkey

  • Exponential data traffic growth acceleration is the driving factor this market.

The Optical Transport Network Equipment market vendors should focus on grabbing business opportunities from the Technology segment as it accounted for the largest market share in the base year.
RIA - Research AI Assistant
Ask RIA