
Orange Market Size 2023-2027
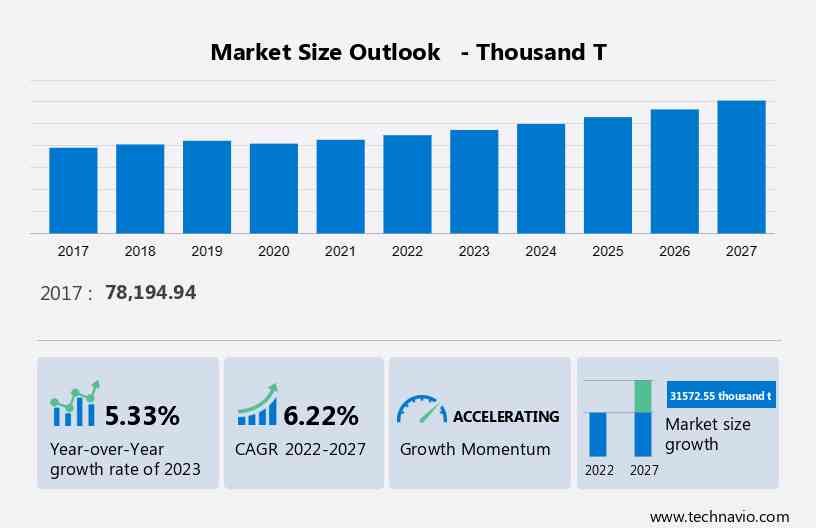
The orange market size is forecast to increase by 31,572.55 thousand tons between 2022 and 2027, accelerating at a CAGR of 6.22%.
- The increasing recognition and advocacy of oranges' nutritional benefits are transforming consumer preferences and market trends. As the word spreads about oranges' vitamin C content and antioxidant properties, there is a significant uptick in demand across multiple industries. Food and beverage companies are incorporating oranges into their offerings, while cosmetics and pharmaceuticals industries are using orange-derived ingredients for their health benefits. Vitamin C supplements, in particular, have gained popularity due to oranges' rich vitamin C content.
- Simultaneously, the retail sector is adapting to this heightened demand for citrus oils by allocating more shelf space and marketing efforts to orange-related products. This trend reflects a broader consumer shift towards healthier choices and presents a strategic opportunity for businesses to capitalize on the fruit's popularity. As consumption patterns continue to evolve, the orange market is poised for sustained growth and innovation.
- The orange market is experiencing dynamic shifts, driven by factors like orange juice demand and organic orange production. The citrus fruit exports face challenges due to supply chain disruptions, particularly in Florida orange harvests. Sustainable citrus farming practices are gaining traction, while orange peel applications are expanding. The frozen orange juice market and fresh orange consumption trends are also evolving, with fluctuations in orange market pricing impacting the sector.
What will be the Size of the Orange Market During the Forecast Period?
To learn more about this orange market trends and analysis report, Download Report Sample
Hpw is the Orange Market Segmented?
The oranage market research report provides comprehensive data (region wise segment analysis), with forecasts and estimates in "USD thousand" for the period 2023 to 2027, as well as historical data from 2017 to 2021 for the following segments
- Product Type Outlook
- Fresh
- Processed
- Frozen
- Application Outlook
- Non-organic
- Organic
- Region Outlook
- APAC
- China
- India
- Europe
- U.K.
- Germany
- France
- Rest of Europe
- North America
- The U.S.
- Canada
- South America
- Brazil
- Argentina
- Middle East & Africa
- Saudi Arabia
- South Africa
- Rest of the Middle East & Africa
- APAC
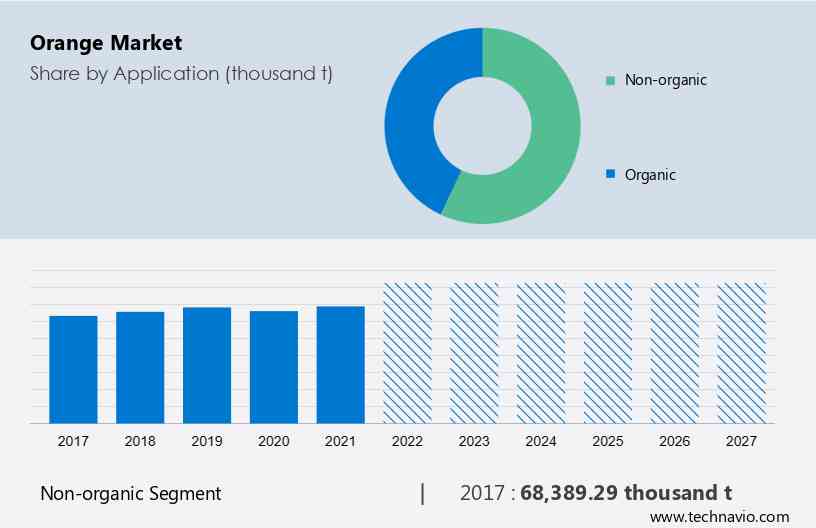
By Application
- The non-organic segment was the largest segment with a share of 68,389.29 thousand tons in 2017. In 2022, the non-organic category accounted for a sizable portion of the market worldwide. The typical method of producing non-organic oranges involves the use of artificial chemicals, fertilizers, and pesticides, among other things. In non-organic farming, pesticides are sprayed to lower the danger of disease and pest infestation while chemical fertilizers are used to encourage plant development. These market trends are influencing orange market growth.
For more details on other segments, Download Market Report
Region Analysis
- APAC is estimated to contribute 67% to the growth of the global market during the forecast period.APAC is expected to witness the highest growth rate due to the growing demand for oranges and related sports drinks in emerging economies like India and China. Major markets in the region are China, Australia, and India. China is the leading producer and consumer of tangerine and mandarine (mandarin orange). Similarly, while India is one of the leading producers of citrus fruits like oranges and lemons, Australia is one of the leading exporters of citrus fruits.
- The market in China is expected to witness a high growth rate due to the constraints in traditional packaging approaches, insufficient cold storage and transportation support, and a highly price-sensitive domestic market (due to which export is preferred more). Both production and postharvest treatments of oranges in China will continue to improve during the forecast period as the industry adopts better growing and handling technologies and standardized operations. These factors are expected to drive regional orange market growth during the forecast period.

To understand geographical trends, Download Market Forecast Report Sample
What are the Orange Market Dynamics Shaping Growth?
- Limes and oranges, both cultivated fruit trees with health benefits and fragrant peel, flourish in various climatic conditions. The chloroplast genome plays a crucial role in their cultivation, especially in organic farming practices. Companies, leveraging the virtue of organic farming, extract citrusy goodness from oranges for juice and powder applications, enriching the food and beverage industry with the health benefits of orange extract and citric acid, particularly in baking. The orange market relies on well-tended cultivated fruit trees to meet global demand for citrus fruit. Sustainable irrigation systems and advanced processing plants are crucial for maintaining high-quality produce.
- The orange market analysis report highlights key factors such as increasing orange juice demand and a rise in organic orange production. Despite supply chain disruptions, especially in Florida orange harvests, the sector is witnessing growth in citrus fruit exports. Sustainable citrus farming and innovative orange peel applications are shaping the future, while the frozen orange juice market and fresh orange consumption trends continue to evolve, alongside orange market pricing fluctuations.
Key Market Driver
- One of the drivers shaping the growth is the various health benefits associated with oranges and the growing consumer awareness of these health benefits. Oranges contain many antioxidants that have a positive effect on health. The demand for antioxidants in the food and beverage industry is increasing, mainly due to their increasing use in energy drinks, bars, and powders. This is why oranges are in high demand in the food and beverage and personal care industries.
- Some of the health benefits of oranges include antioxidants that help keep free radicals in check, nutritional value, and low-calorie content. Fruits and vegetables are an important part of a healthy diet, and when consumed in sufficient amounts each day, they help prevent many serious diseases, including cardiovascular disease and certain cancers. Many global organizations such as the WHO and the Food and Agriculture Organization (FAO) advocate for increased consumption of fruits and vegetables, which will drive orange market growth and trends.
Which are the Major Orange Market Companies?
The market is fragmented in nature. Some significant players include Berje Inc., Citrosuco, Citrus World Inc., Hyatt Fruit Co., INDIAN RIVER FRUIT Co., LEMONCONCENTRATE SLU, Louis Dreyfus Co. BV, Nielsen Citrus Products Co. Inc.,
The market research and growth report also includes detailed analyses of the competitive landscape of the market and information about 15 market companies, including:
- PACIFIC COAST FRUIT PRODUCTS Ltd.
- Paradise Juice Pvt. Ltd.
- Perricone Farms
- Schacht Groves
- SEQUOIA-ORANGE Co. Inc.
- SUNRISE FRUITS COMPANY SL
- The Fruit Co.
- Trinity Fruit Co.
- Tropicana Products Inc.
- Zain Natural Agro India Pvt. Ltd.
What are the Latest Market Developments and News?
-
In November 2024, the Florida Department of Citrus launched a new marketing campaign to promote the health benefits of fresh orange juice, focusing on its vitamin C content and immune-boosting properties. This initiative aims to increase consumer demand for fresh citrus products, particularly in North America and Europe.
-
In October 2024, a leading agricultural company in Brazil introduced a new variety of orange that is resistant to common diseases and pests. This development is expected to increase the yield of oranges and improve the overall quality of citrus exports from Brazil, which is one of the largest orange producers in the world.
-
In September 2024, the global citrus company, Valencias, announced a strategic partnership with a prominent logistics provider to expand its orange supply chain. The partnership will improve the distribution of fresh oranges to international markets, reducing delivery times and ensuring the fruit remains fresh when it reaches consumers.
-
In August 2024, a major Spanish agribusiness launched a new line of organic oranges, targeting the growing demand for sustainable and pesticide-free food products. The organic oranges will be sold both domestically and in international markets, with a focus on eco-conscious consumers in Europe and North America.
Will Consumer Demand Drive Market Growth?
- The orange market is experiencing significant growth due to the increasing demand for its versatility and health benefits. Oranges and their extracts offer health-conscious consumers natural flavoring agents, capitalizing on the citric acid and essential oils found in the fruit. Extensive applications of oranges and their extracts can be found in baking, cooking, and beverage production, enhancing the flavor profile of various goods. Farmers, particularly organic orange farmers, play a vital role in meeting the increased demand. They require efficient storage facilities and processing plants to maintain the quantity and quality of fruit.
- However, challenges such as raw material price variations persist, yet the market continues to flourish. Consumer preferences for clean-label and natural ingredients have become a major driving force in product categories like baked goods. The orange market exhibits significant fluctuations due to the seasonal nature of orange cultivation and weather conditions. Citrus fruits, including sweet orange, bitter orange, and pomelo, contribute to the market's diversity.
- Farmers employ efficient irrigation systems to ensure optimal fruit production, as the health and wellness trend continues to influence consumer preferences. Oranges are highly valued for their health benefits and rich vitamin content, leading to a diverse range of offerings from fresh oranges to orange extract powder applications. Functional beverages, dietary supplements, and vitamin-enhanced products are popular choices sourced from cultivated orange trees and their citrus maxima and citrus reticulata varieties. The orange market's growth is driven by these factors, making it a dynamic and evolving industry.
- Seasonal variations and weather conditions significantly impact orange production, while health trends and consumer preferences continue to shape market demand for various orange products. Citrus farmers rely on advanced irrigation systems to maintain optimal growing conditions, ensuring a consistent supply of high-quality oranges for consumers. The market caters to diverse preferences, with applications ranging from fresh fruit to functional food and beverage products. The health benefits and rich vitamin content of oranges make them a staple in the health and wellness industry, contributing to the market's continued growth.
|
Market Scope |
|
|
Report Coverage |
Details |
|
Page number |
140 |
|
Base year |
2022 |
|
Historic period |
2017 - 2021 |
|
Forecast period |
2023-2027 |
|
Growth momentum & CAGR |
Accelerate at a CAGR of 6.22% |
|
Market growth 2023-2027 |
31572.55 thousand t |
|
Market structure |
Fragmented |
|
YoY growth 2022-2023(%) |
5.33 |
|
Regional analysis |
APAC, Europe, North America, South America, and Middle East and Africa |
|
Performing market contribution |
APAC at 67% |
|
Key countries |
US, Mexico, China, India, and Brazil |
|
Competitive landscape |
Leading Companies, Market Positioning of Companies, Competitive Strategies, and Industry Risks |
|
Key companies profiled |
Berje Inc., Citrosuco, Citrus World Inc., Hyatt Fruit Co., INDIAN RIVER FRUIT Co., LEMONCONCENTRATE SLU, Louis Dreyfus Co. BV, Nielsen Citrus Products Co. Inc., PACIFIC COAST FRUIT PRODUCTS Ltd., Paradise Juice Pvt. Ltd., Perricone Farms, Schacht Groves, SEQUOIA-ORANGE Co. Inc., SUNRISE FRUITS COMPANY SL, The Fruit Co., Trinity Fruit Co., Tropicana Products Inc., and Zain Natural Agro India Pvt. Ltd. |
|
Market dynamics |
Parent market growth analysis, Market growth inducers and obstacles, Fast-growing and slow-growing segment analysis, COVID 19 impact and recovery analysis and future consumer dynamics, Market growth and forecasting, Market condition analysis for forecast period |
|
Customization purview |
If our orange market growth and trends report has not included the data that you are looking for, you can reach out to our analysts and get segments customized. |
What are the Key Data Covered in this Orange Market Research Report?
- CAGR of the market forecasting
- Detailed information on factors that will drive the growth of the market between 2023 and 2027
- Precise estimation of the size of the market size and its contribution of the market in focus to the parent market
- Accurate predictions about upcoming trends and changes in consumer behaviour
- Growth of the market industry across APAC, Europe, North America, South America, and Middle East and Africa
- Thorough analysis of the market's competitive landscape and detailed information about companies
- Comprehensive analysis of factors that will challenge the growth of market companies
We can help! Our analysts can customize this orange market analysis and report to meet your requirements.
 RIA -
RIA - 
