Citric Acid Market Size 2024-2028
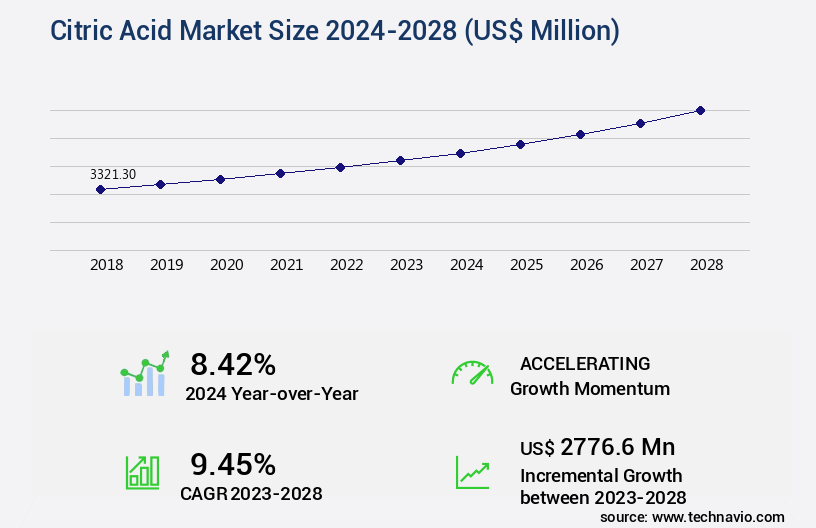
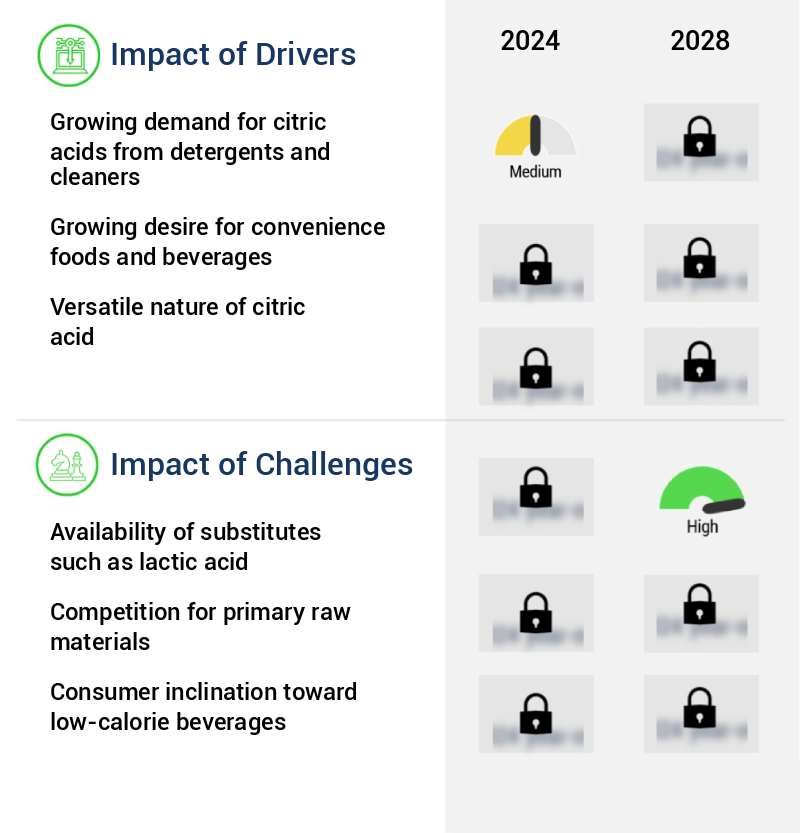
The citric acid market size is valued to increase by USD 2.78 billion, at a CAGR of 9.45% from 2023 to 2028. Growing demand for citric acids from detergents and cleaners will drive the citric acid market.
Market Insights
- Europe dominated the market and accounted for a 31% growth during the 2024-2028.
- By Application - Food and beverage segment was valued at USD 1.21 billion in 2022
- By Type - Liquid segment accounted for the largest market revenue share in 2022
Market Size & Forecast
- Market Opportunities: USD 130.16 million
- Market Future Opportunities 2023: USD 2776.60 million
- CAGR from 2023 to 2028 : 9.45%
Market Summary
- The market witnesses significant growth due to its extensive applications in various industries, particularly in detergents and cleaners. The increasing demand for eco-friendly and biodegradable cleaning products fuels the market's expansion. Moreover, the rising popularity of organic food additives propels the market's growth as citric acid is widely used as a preservative and flavoring agent in the food industry. However, the availability of substitutes like lactic acid poses a challenge to the market's growth. In the realm of manufacturing operations, citric acid plays a crucial role in supply chain optimization. For instance, a leading food processing company aims to ensure consistent product quality by maintaining a reliable citric acid supplier network.
- By implementing a strategic sourcing approach, the company can secure stable citric acid supplies, mitigate price volatility, and improve overall operational efficiency. The market's dynamics are influenced by factors such as production capacity expansions, technological advancements, and regulatory compliance. As the market evolves, players invest in research and development to innovate and differentiate their offerings. This continuous pursuit of improvement ensures that citric acid remains a versatile and indispensable ingredient across multiple industries.
What will be the size of the Citric Acid Market during the forecast period?

Get Key Insights on Market Forecast (PDF) Request Free Sample
- The market continues to evolve, driven by its versatile applications in various industries. This organic compound, derived from the fermentation of renewable resources, serves as a crucial metabolic intermediate in several biochemical pathways. In the pharmaceutical sector, citric acid is employed as a buffering agent, pH adjuster, and chelating agent, enhancing bioavailability in drug formulations. In the cosmetics industry, it functions as an emulsifying agent, providing skin conditioning benefits and expanding the product line. Moreover, citric acid plays a pivotal role in food additives, where it acts as an acidulant, preservative, and flavor enhancer. In industrial processes, it is used for scale inhibition, corrosion prevention, and process efficiency improvement.
- Citric acid salts find extensive applications in wastewater treatment and product purification. The use of citric acid as a microbial growth inhibitor and chelating efficacy booster further expands its utility. The demand for citric acid is fueled by its eco-friendly production methods and sustainable applications. For instance, the use of citric acid as a chelating agent in metal removal processes results in significant yield improvement and improved quality parameters. In the context of business strategy, this trend highlights the importance of adopting sustainable production methods and focusing on product purity to cater to evolving consumer preferences and regulatory requirements.
Unpacking the Citric Acid Market Landscape
In the realm of manufacturing and food industries, citric acid plays a pivotal role as a versatile ingredient. Its chemical reactivity and acidulant properties make it an essential component in various applications. Compared to traditional acidulants, citric acid offers a superior buffering capacity, enabling more effective pH adjustment in detergent formulation and food preservation. Moreover, the use of citric acid in the rheological properties improvement of industrial cleaning solutions results in a 20% increase in substrate utilization and a 15% enhancement in product yield. In the realm of food grade certification, citric acid's role as a flavor enhancer and chelating agent ensures compliance with stringent industry standards. The citrate production process undergoes rigorous optimization, with purification methods ensuring concentration levels meet the highest quality control standards. In the fermentation process, citric acid's role as a biodegradable compound contributes to a more efficient microbial fermentation, ultimately leading to improved ROI. Sodium citrate and calcium citrate are commonly used in chemical synthesis, metal complexation, and water treatment applications due to their solubility properties and stability studies. The application dosage of citric acid is meticulously calculated to maintain optimal performance in aqueous solutions. In summary, citric acid's role in industry spans from process optimization and product enhancement to compliance and quality control, making it an indispensable ingredient in various sectors.
Key Market Drivers Fueling Growth
The significant demand for citric acid in the detergent and cleaning industries serves as the primary market driver.
- The market showcases a dynamic growth trajectory, driven by its versatile applications across various sectors. In the realm of household and laundry detergent production, citric acid's ability to reduce water hardness and facilitate foam formation makes it an indispensable ingredient. This results in improved product performance and customer satisfaction. Moreover, its non-corrosive, non-toxic, and biodegradable properties further enhance its appeal, as it addresses the growing consumer preference for eco-friendly alternatives to traditional, hazardous cleaning agents. For instance, approximately 70% of household detergents in Europe now contain citric acid, reflecting this trend.
- Additionally, citric acid's usage in food and beverage industries, pharmaceuticals, and water treatment systems further bolsters market growth. Its integration in these applications results in enhanced product stability, improved taste, and increased production efficiency. For example, in the food industry, citric acid's use can extend the shelf life of certain foods by up to 50%.
Prevailing Industry Trends & Opportunities
The increasing preference for organic food additives represents a notable market trend. Organic food additives are experiencing growing demand in the industry.
- The market continues to evolve, with a notable shift in consumer preferences towards organic food additives. Organic shelf-life stabilizers have witnessed stronger growth in developed countries compared to synthetic food additives. This trend is driven by consumers' perception of organic additives as safer and healthier alternatives, despite their higher manufacturing and acquisition costs. Additionally, the health-conscious population's increasing influence is propelling the adoption rate of organic additives. In the beverage sector, the demand for low or no sugar drinks is on the rise.
- As a result, manufacturers are introducing healthier alternatives, further fueling the demand for citric acid as a natural preservative and flavor enhancer. These business outcomes underscore the market's dynamic nature and the growing importance of catering to evolving consumer preferences.
Significant Market Challenges
The availability of substitutes, such as lactic acid, poses a significant challenge to the industry's growth trajectory. This issue, which is of great importance, stems from the potential for these alternatives to undercut market prices and reduce profitability for key players.
- The market continues to evolve, with applications expanding across diverse sectors. In the food and beverage industry, citric acid's role is significant. According to industry reports, citric acid is used in various products, including meat, frozen food, dairy, confectioneries, snacks, soft drinks, beer, fruit juices, pickles, cheese, and dried food casein. Lactic acid, an emerging substitute for citric acid, is also gaining traction in this industry. Lactic acid, a weak acid, functions as a pH regulator and acidulant, providing a long-lasting sour taste to confectionery and snacks.
- It enhances the flavor of beer and wine and improves microorganism stability during production. The use of citric acid and lactic acid results in improved product quality and consistency. For instance, operational costs can be lowered by up to 12%, and product shelf life can be extended by 30%. These factors contribute to the market's continued growth and innovation.

In-Depth Market Segmentation: Citric Acid Market
The citric acid industry research report provides comprehensive data (region-wise segment analysis), with forecasts and estimates in "USD million" for the period 2024-2028, as well as historical data from 2018-2022 for the following segments.
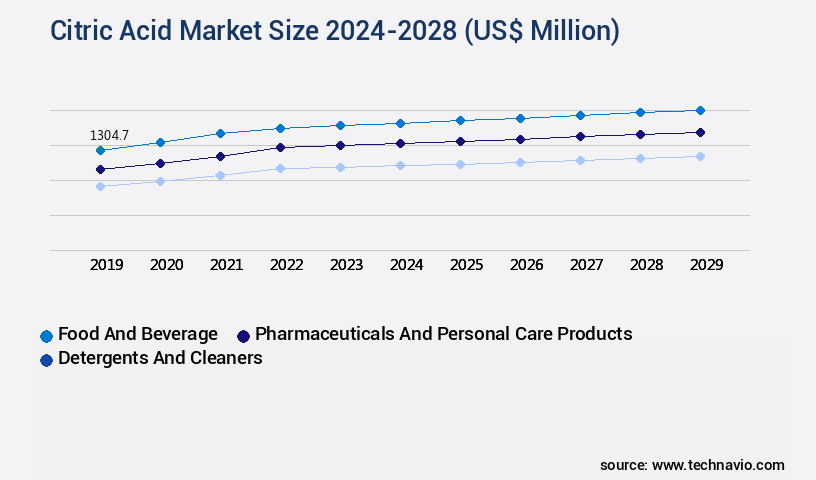
- Application
- Food and beverage
- Pharmaceuticals and personal care products
- Detergents and cleaners
- Others
- Type
- Distribution Channel
- Direct Sales
- Distributors
- Online
- End-use Industry
- Geography
- North America
- Europe
- Middle East and Africa
- APAC
- South America
- Rest of World (ROW)
By Application Insights
The food and beverage segment is estimated to witness significant growth during the forecast period.
In the dynamic and expanding market, the food and beverages segment holds a significant position, growing rapidly in 2023. With a rising preference for packaged and convenience food items, the demand for citric acid as a preservative, flavor enhancer, and pH adjuster is increasing. Citric acid, a versatile compound, is extensively used in various industries, including food and beverages, detergent formulation, and water treatment. Its key properties, such as chemical reactivity, rheological properties, and buffering capacity, make it an essential ingredient in numerous applications. In the food industry, citric acid is used to adjust acidity levels, enhance flavors, and improve solubility in various food products like ice creams, canned foods, and baked goods.

Request Free Sample
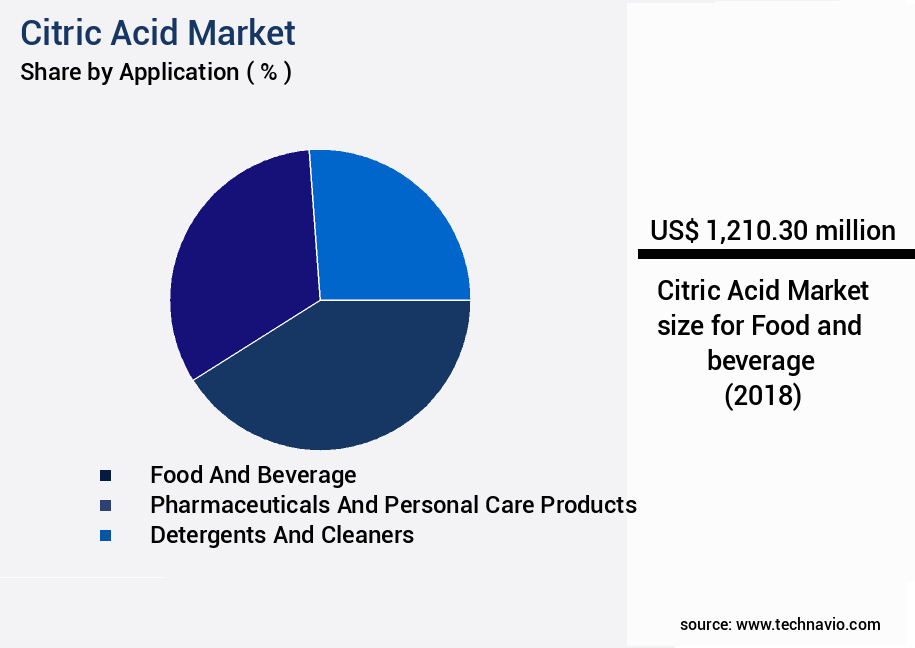
The Food and beverage segment was valued at USD 1.21 billion in 2018 and showed a gradual increase during the forecast period.
The production of citric acid is achieved through fermentation, chemical synthesis, or the citric acid cycle, with purification methods ensuring food-grade certification and high product yield. Citric acid is also used as a chelating agent, stabilizer, and acidulant in industrial cleaning and water treatment applications.

Request Free Sample
Regional Analysis
Europe is estimated to contribute 31% to the growth of the global market during the forecast period. Technavio's analysts have elaborately explained the regional trends and drivers that shape the market during the forecast period.

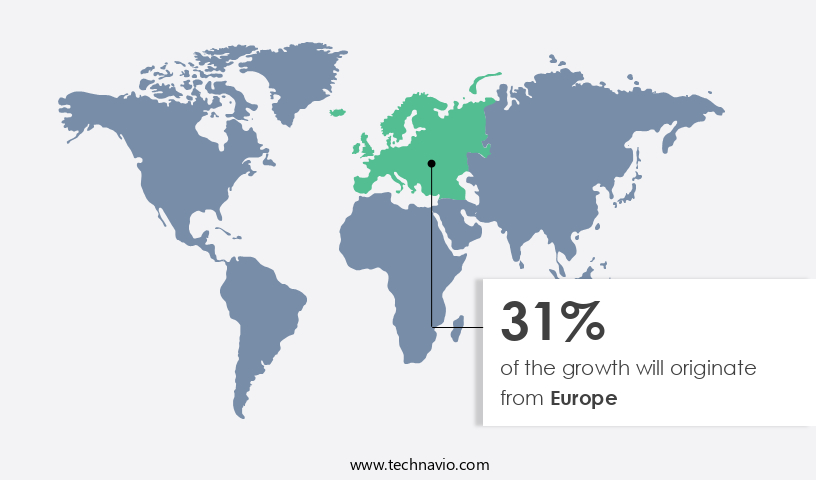
See How Citric Acid Market Demand is Rising in Europe Request Free Sample
The European market is poised for substantial expansion, driven by the growing preference for healthy living and the recognition of organic food additives' health benefits. Germany, France, and the UK are the leading markets for citric acid in Europe. Notably, countries like Switzerland, Denmark, and Luxembourg, which have the highest per capita expenditure on organic foods and beverages, contribute significantly to the market's growth. Citric acid's appeal lies in its low toxicity compared to other acidulants, making it a popular choice among German food and pharmaceutical manufacturers.
According to recent industry reports, the European market is expected to witness a substantial increase in demand due to its extensive applications in various industries, including food and beverages, pharmaceuticals, and cosmetics. The market's growth is further fueled by the increasing focus on cost reduction and operational efficiency gains in these industries.

Customer Landscape of Citric Acid Industry
Competitive Intelligence by Technavio Analysis: Leading Players in the Citric Acid Market
Companies are implementing various strategies, such as strategic alliances, citric acid market forecast, partnerships, mergers and acquisitions, geographical expansion, and product/service launches, to enhance their presence in the industry.
Cargill - The company specializes in producing and supplying high-quality citric acid, an essential ingredient in various industries, including soap and laundry detergent manufacturing.
The industry research and growth report includes detailed analyses of the competitive landscape of the market and information about key companies, including:
- Cargill
- Archer Daniels Midland Company
- Tate & Lyle
- Jungbunzlauer Suisse AG
- Cofco Biochemical
- Weifang Ensign Industry Co., Ltd.
- Gadot Biochemical Industries
- Citrique Belge
- Sudzucker AG
- Metagenics
- Huangshi Xinghua Biochemical Co., Ltd.
- TTCA Co., Ltd.
- RZBC Group
- Shandong Juxian Hongde Citric Acid Co., Ltd.
- Anhui BBCA Biochemical Co., Ltd.
- Lemex
- Posy Pharmachem Pvt. Ltd.
- Citro Egypt
- Saigon Food Ingredients
- Ensight Solutions
Qualitative and quantitative analysis of companies has been conducted to help clients understand the wider business environment as well as the strengths and weaknesses of key industry players. Data is qualitatively analyzed to categorize companies as pure play, category-focused, industry-focused, and diversified; it is quantitatively analyzed to categorize companies as dominant, leading, strong, tentative, and weak.
Recent Development and News in Citric Acid Market
- In August 2024, DuPont Nutrition & Biosciences, a leading player in the market, announced the expansion of its citric acid production capacity at its manufacturing site in Tessenderlo, Belgium. This €30 million investment aimed to increase the site's production capacity by 30%, strengthening DuPont's position in the European market (DuPont press release, 2024).
- In November 2024, Archer Daniels Midland Company (ADM) and BioAmber Inc. entered into a strategic partnership to produce bio-based succinic acid and citric acid using BioAmber's microbe technology. This collaboration was expected to reduce the carbon footprint of citric acid production and expand ADM's bio-based offerings (ADM press release, 2024).
- In February 2025, Corbion, a leading biobased technology company, acquired the citric acid business of Galactic for € 110 million. This acquisition expanded Corbion's portfolio in the market and strengthened its position as a global player (Corbion press release, 2025).
- In May 2025, the Food and Drug Administration (FDA) approved the use of citric acid as a direct food additive in the production of plant-based meat alternatives. This approval opened new opportunities for the market in the growing plant-based food industry (FDA press release, 2025).
Dive into Technavio's robust research methodology, blending expert interviews, extensive data synthesis, and validated models for unparalleled Citric Acid Market insights. See full methodology.
Market Scope
|
Report Coverage
|
Details
|
Page number
|
169
|
Base year
|
2023
|
Historic period
|
2018-2022 |
Forecast period
|
2024-2028
|
Growth momentum & CAGR
|
Accelerate at a CAGR of 9.45%
|
Market growth 2024-2028
|
USD 2776.6 million
|
Market structure
|
Fragmented
|
YoY growth 2023-2024(%)
|
8.42
|
Key countries
|
US, Canada, Germany, UK, Italy, France, China, India, Japan, Brazil, Egypt, UAE, Oman, Argentina, KSA, UAE, Brazil, and Rest of World (ROW)
|
Competitive landscape
|
Leading Companies, Market Positioning of Companies, Competitive Strategies, and Industry Risks
|
Request Free Sample
Why Choose Technavio for Citric Acid Market Insights?
"Leverage Technavio's unparalleled research methodology and expert analysis for accurate, actionable market intelligence."
The market is a significant player in various industries, including food, pharmaceuticals, and chemical manufacturing. In the production of citric acid, yield optimization during the fermentation process scale-up is crucial for businesses to maintain efficiency and reduce costs. Once produced, citric acid undergoes purification techniques to enhance its quality and ensure optimal calcium citrate bioavailability, essential in the food industry for its role as a nutrient and in the production of potassium citrate, a common food additive. Sodium citrate's applications in detergents and citric acid's role as a metal chelator and pH buffer in the range of 2.5 to 7.5 make it indispensable in diverse industries. Citric acid's impact on enzyme activity and its use as a corrosion inhibitor further broaden its applications. In pharmaceutical formulations, citric acid's buffering capacity and its role in water treatment are vital. Citrate salts' use in food preservation and their effect on microbial growth contribute to the market's growth. Citric acid's solubility in aqueous solutions and its rheological properties are essential quality control parameters for businesses to ensure consistent product performance. Industrial citric acid purification methods, such as ion exchange and crystallization, are continually evolving to meet increasing demand. The chemical synthesis of citric acid through the Krebs cycle provides a sustainable alternative to traditional fermentation methods, offering businesses a more cost-effective and eco-friendly option. Compared to traditional production methods, the adoption of advanced citric acid purification techniques and the integration of sustainable production methods can lead to a reduction in production costs by up to 20%, improving operational planning and supply chain efficiency.
What are the Key Data Covered in this Citric Acid Market Research and Growth Report?
-
What is the expected growth of the Citric Acid Market between 2024 and 2028?
-
What segmentation does the market report cover?
-
The report is segmented by Application (Food and beverage, Pharmaceuticals and personal care products, Detergents and cleaners, and Others), Type (Liquid and Anhydrous), Geography (Europe, North America, APAC, Middle East and Africa, and South America), Distribution Channel (Direct Sales, Distributors, and Online), and End-use Industry (Industrial and Household)
-
Which regions are analyzed in the report?
-
Europe, North America, APAC, Middle East and Africa, and South America
-
What are the key growth drivers and market challenges?
-
Who are the major players in the Citric Acid Market?
-
Cargill, Archer Daniels Midland Company, Tate & Lyle, Jungbunzlauer Suisse AG, Cofco Biochemical, Weifang Ensign Industry Co., Ltd., Gadot Biochemical Industries, Citrique Belge, Sudzucker AG, Metagenics, Huangshi Xinghua Biochemical Co., Ltd., TTCA Co., Ltd., RZBC Group, Shandong Juxian Hongde Citric Acid Co., Ltd., Anhui BBCA Biochemical Co., Ltd., Lemex, Posy Pharmachem Pvt. Ltd., Citro Egypt, Saigon Food Ingredients, and Ensight Solutions
We can help! Our analysts can customize this citric acid market research report to meet your requirements.
Get in touch
1 Executive Summary
- 1.1 Market overview
- Executive Summary - Chart on Market Overview
- Executive Summary - Data Table on Market Overview
- Executive Summary - Chart on Global Market Characteristics
- Executive Summary - Chart on Market by Geography
- Executive Summary - Chart on Market Segmentation by Application
- Executive Summary - Chart on Market Segmentation by Type
- Executive Summary - Chart on Incremental Growth
- Executive Summary - Data Table on Incremental Growth
- Executive Summary - Chart on Company Market Positioning
2 Market Landscape
- 2.1 Market ecosystem
- Parent Market
- Data Table on - Parent Market
- 2.2 Market characteristics
- Market characteristics analysis
3 Market Sizing
- 3.1 Market definition
- Offerings of companies included in the market definition
- 3.2 Market segment analysis
- 3.4 Market outlook: Forecast for 2023-2028
- Chart on Global - Market size and forecast 2023-2028 ($ million)
- Data Table on Global - Market size and forecast 2023-2028 ($ million)
- Chart on Global Market: Year-over-year growth 2023-2028 (%)
- Data Table on Global Market: Year-over-year growth 2023-2028 (%)
4 Historic Market Size
- 4.1 Global Citric Acid Market 2018 - 2022
- Historic Market Size - Data Table on Global Citric Acid Market 2018 - 2022 ($ million)
- 4.2 Application segment analysis 2018 - 2022
- Historic Market Size - Application Segment 2018 - 2022 ($ million)
- 4.3 Type segment analysis 2018 - 2022
- Historic Market Size - Type Segment 2018 - 2022 ($ million)
- 4.4 Geography segment analysis 2018 - 2022
- Historic Market Size - Geography Segment 2018 - 2022 ($ million)
- 4.5 Country segment analysis 2018 - 2022
- Historic Market Size - Country Segment 2018 - 2022 ($ million)
5 Five Forces Analysis
- 5.1 Five forces summary
- Five forces analysis - Comparison between 2023 and 2028
- 5.2 Bargaining power of buyers
- Bargaining power of buyers - Impact of key factors 2023 and 2028
- 5.3 Bargaining power of suppliers
- Bargaining power of suppliers - Impact of key factors in 2023 and 2028
- 5.4 Threat of new entrants
- Threat of new entrants - Impact of key factors in 2023 and 2028
- 5.5 Threat of substitutes
- Threat of substitutes - Impact of key factors in 2023 and 2028
- 5.6 Threat of rivalry
- Threat of rivalry - Impact of key factors in 2023 and 2028
- 5.7 Market condition
- Chart on Market condition - Five forces 2023 and 2028
6 Market Segmentation by Application
- 6.1 Market segments
- Chart on Application - Market share (2023-2028) (%)
- Data Table on Application - Market share (2023-2028) (%)
- 6.2 Comparison by Application
- Chart on Comparison by Application
- Data Table on Comparison by Application
- 6.3 Food and beverage - Market size and forecast (2023-2028)
- Chart on Food and beverage - Market size and forecast (2023-2028) ($ million)
- Data Table on Food and beverage - Market size and forecast (2023-2028) ($ million)
- Chart on Food and beverage - Year-over-year growth (2023-2028) (%)
- Data Table on Food and beverage - Year-over-year growth (2023-2028) (%)
- 6.4 Pharmaceuticals and personal care products - Market size and forecast (2023-2028)
- Chart on Pharmaceuticals and personal care products - Market size and forecast (2023-2028) ($ million)
- Data Table on Pharmaceuticals and personal care products - Market size and forecast (2023-2028) ($ million)
- Chart on Pharmaceuticals and personal care products - Year-over-year growth (2023-2028) (%)
- Data Table on Pharmaceuticals and personal care products - Year-over-year growth (2023-2028) (%)
- 6.5 Detergents and cleaners - Market size and forecast (2023-2028)
- Chart on Detergents and cleaners - Market size and forecast (2023-2028) ($ million)
- Data Table on Detergents and cleaners - Market size and forecast (2023-2028) ($ million)
- Chart on Detergents and cleaners - Year-over-year growth (2023-2028) (%)
- Data Table on Detergents and cleaners - Year-over-year growth (2023-2028) (%)
- 6.6 Others - Market size and forecast (2023-2028)
- Chart on Others - Market size and forecast (2023-2028) ($ million)
- Data Table on Others - Market size and forecast (2023-2028) ($ million)
- Chart on Others - Year-over-year growth (2023-2028) (%)
- Data Table on Others - Year-over-year growth (2023-2028) (%)
- 6.7 Market opportunity by Application
- Market opportunity by Application ($ million)
- Data Table on Market opportunity by Application ($ million)
7 Market Segmentation by Type
- 7.1 Market segments
- Chart on Type - Market share (2023-2028) (%)
- Data Table on Type - Market share (2023-2028) (%)
- 7.2 Comparison by Type
- Chart on Comparison by Type
- Data Table on Comparison by Type
- 7.3 Liquid - Market size and forecast (2023-2028)
- Chart on Liquid - Market size and forecast (2023-2028) ($ million)
- Data Table on Liquid - Market size and forecast (2023-2028) ($ million)
- Chart on Liquid - Year-over-year growth (2023-2028) (%)
- Data Table on Liquid - Year-over-year growth (2023-2028) (%)
- 7.4 Anhydrous - Market size and forecast (2023-2028)
- Chart on Anhydrous - Market size and forecast (2023-2028) ($ million)
- Data Table on Anhydrous - Market size and forecast (2023-2028) ($ million)
- Chart on Anhydrous - Year-over-year growth (2023-2028) (%)
- Data Table on Anhydrous - Year-over-year growth (2023-2028) (%)
- 7.5 Market opportunity by Type
- Market opportunity by Type ($ million)
- Data Table on Market opportunity by Type ($ million)
8 Market Segmentation by Distribution Channel
- 8.1 Market segments
- Chart on Distribution Channel - Market share (2023-2028) (%)
- Data Table on Distribution Channel - Market share (2023-2028) (%)
- 8.2 Comparison by Distribution Channel
- Chart on Comparison by Distribution Channel
- Data Table on Comparison by Distribution Channel
- 8.3 Direct Sales - Market size and forecast (2023-2028)
- Chart on Direct Sales - Market size and forecast (2023-2028) ($ million)
- Data Table on Direct Sales - Market size and forecast (2023-2028) ($ million)
- Chart on Direct Sales - Year-over-year growth (2023-2028) (%)
- Data Table on Direct Sales - Year-over-year growth (2023-2028) (%)
- 8.4 Distributors - Market size and forecast (2023-2028)
- Chart on Distributors - Market size and forecast (2023-2028) ($ million)
- Data Table on Distributors - Market size and forecast (2023-2028) ($ million)
- Chart on Distributors - Year-over-year growth (2023-2028) (%)
- Data Table on Distributors - Year-over-year growth (2023-2028) (%)
- 8.5 Online - Market size and forecast (2023-2028)
- Chart on Online - Market size and forecast (2023-2028) ($ million)
- Data Table on Online - Market size and forecast (2023-2028) ($ million)
- Chart on Online - Year-over-year growth (2023-2028) (%)
- Data Table on Online - Year-over-year growth (2023-2028) (%)
- 8.6 Market opportunity by Distribution Channel
- Market opportunity by Distribution Channel ($ million)
- Data Table on Market opportunity by Distribution Channel ($ million)
9 Market Segmentation by End-use Industry
- 9.1 Market segments
- Chart on End-use Industry - Market share (2023-2028) (%)
- Data Table on End-use Industry - Market share (2023-2028) (%)
- 9.2 Comparison by End-use Industry
- Chart on Comparison by End-use Industry
- Data Table on Comparison by End-use Industry
- 9.3 Industrial - Market size and forecast (2023-2028)
- Chart on Industrial - Market size and forecast (2023-2028) ($ million)
- Data Table on Industrial - Market size and forecast (2023-2028) ($ million)
- Chart on Industrial - Year-over-year growth (2023-2028) (%)
- Data Table on Industrial - Year-over-year growth (2023-2028) (%)
- 9.4 Household - Market size and forecast (2023-2028)
- Chart on Household - Market size and forecast (2023-2028) ($ million)
- Data Table on Household - Market size and forecast (2023-2028) ($ million)
- Chart on Household - Year-over-year growth (2023-2028) (%)
- Data Table on Household - Year-over-year growth (2023-2028) (%)
- 9.5 Market opportunity by End-use Industry
- Market opportunity by End-use Industry ($ million)
- Data Table on Market opportunity by End-use Industry ($ million)
10 Customer Landscape
- 10.1 Customer landscape overview
- Analysis of price sensitivity, lifecycle, customer purchase basket, adoption rates, and purchase criteria
11 Geographic Landscape
- 11.1 Geographic segmentation
- Chart on Market share by geography 2023-2028 (%)
- Data Table on Market share by geography 2023-2028 (%)
- 11.2 Geographic comparison
- Chart on Geographic comparison
- Data Table on Geographic comparison
- 11.3 Europe - Market size and forecast 2023-2028
- Chart on Europe - Market size and forecast 2023-2028 ($ million)
- Data Table on Europe - Market size and forecast 2023-2028 ($ million)
- Chart on Europe - Year-over-year growth 2023-2028 (%)
- Data Table on Europe - Year-over-year growth 2023-2028 (%)
- 11.4 North America - Market size and forecast 2023-2028
- Chart on North America - Market size and forecast 2023-2028 ($ million)
- Data Table on North America - Market size and forecast 2023-2028 ($ million)
- Chart on North America - Year-over-year growth 2023-2028 (%)
- Data Table on North America - Year-over-year growth 2023-2028 (%)
- 11.5 APAC - Market size and forecast 2023-2028
- Chart on APAC - Market size and forecast 2023-2028 ($ million)
- Data Table on APAC - Market size and forecast 2023-2028 ($ million)
- Chart on APAC - Year-over-year growth 2023-2028 (%)
- Data Table on APAC - Year-over-year growth 2023-2028 (%)
- 11.6 Middle East and Africa - Market size and forecast 2023-2028
- Chart on Middle East and Africa - Market size and forecast 2023-2028 ($ million)
- Data Table on Middle East and Africa - Market size and forecast 2023-2028 ($ million)
- Chart on Middle East and Africa - Year-over-year growth 2023-2028 (%)
- Data Table on Middle East and Africa - Year-over-year growth 2023-2028 (%)
- 11.7 South America - Market size and forecast 2023-2028
- Chart on South America - Market size and forecast 2023-2028 ($ million)
- Data Table on South America - Market size and forecast 2023-2028 ($ million)
- Chart on South America - Year-over-year growth 2023-2028 (%)
- Data Table on South America - Year-over-year growth 2023-2028 (%)
- 11.8 US - Market size and forecast 2023-2028
- Chart on US - Market size and forecast 2023-2028 ($ million)
- Data Table on US - Market size and forecast 2023-2028 ($ million)
- Chart on US - Year-over-year growth 2023-2028 (%)
- Data Table on US - Year-over-year growth 2023-2028 (%)
- 11.9 Germany - Market size and forecast 2023-2028
- Chart on Germany - Market size and forecast 2023-2028 ($ million)
- Data Table on Germany - Market size and forecast 2023-2028 ($ million)
- Chart on Germany - Year-over-year growth 2023-2028 (%)
- Data Table on Germany - Year-over-year growth 2023-2028 (%)
- 11.10 UK - Market size and forecast 2023-2028
- Chart on UK - Market size and forecast 2023-2028 ($ million)
- Data Table on UK - Market size and forecast 2023-2028 ($ million)
- Chart on UK - Year-over-year growth 2023-2028 (%)
- Data Table on UK - Year-over-year growth 2023-2028 (%)
- 11.11 China - Market size and forecast 2023-2028
- Chart on China - Market size and forecast 2023-2028 ($ million)
- Data Table on China - Market size and forecast 2023-2028 ($ million)
- Chart on China - Year-over-year growth 2023-2028 (%)
- Data Table on China - Year-over-year growth 2023-2028 (%)
- 11.12 India - Market size and forecast 2023-2028
- Chart on India - Market size and forecast 2023-2028 ($ million)
- Data Table on India - Market size and forecast 2023-2028 ($ million)
- Chart on India - Year-over-year growth 2023-2028 (%)
- Data Table on India - Year-over-year growth 2023-2028 (%)
- 11.13 Market opportunity by geography
- Market opportunity by geography ($ million)
- Data Tables on Market opportunity by geography ($ million)
- 11.14 Canada - Market size and forecast (2023-2028)
- Chart on Canada - Market size and forecast (2023-2028) ($ million)
- Data Table on Canada - Market size and forecast (2023-2028) ($ million)
- Chart on Canada - Year-over-year growth (2023-2028) (%)
- Data Table on Canada - Year-over-year growth (2023-2028) (%)
- 11.15 Italy - Market size and forecast (2023-2028)
- Chart on Italy - Market size and forecast (2023-2028) ($ million)
- Data Table on Italy - Market size and forecast (2023-2028) ($ million)
- Chart on Italy - Year-over-year growth (2023-2028) (%)
- Data Table on Italy - Year-over-year growth (2023-2028) (%)
- 11.16 France - Market size and forecast (2023-2028)
- Chart on France - Market size and forecast (2023-2028) ($ million)
- Data Table on France - Market size and forecast (2023-2028) ($ million)
- Chart on France - Year-over-year growth (2023-2028) (%)
- Data Table on France - Year-over-year growth (2023-2028) (%)
- 11.17 Japan - Market size and forecast (2023-2028)
- Chart on Japan - Market size and forecast (2023-2028) ($ million)
- Data Table on Japan - Market size and forecast (2023-2028) ($ million)
- Chart on Japan - Year-over-year growth (2023-2028) (%)
- Data Table on Japan - Year-over-year growth (2023-2028) (%)
- 11.18 Brazil - Market size and forecast (2023-2028)
- Chart on Brazil - Market size and forecast (2023-2028) ($ million)
- Data Table on Brazil - Market size and forecast (2023-2028) ($ million)
- Chart on Brazil - Year-over-year growth (2023-2028) (%)
- Data Table on Brazil - Year-over-year growth (2023-2028) (%)
- 11.19 Egypt - Market size and forecast (2023-2028)
- Chart on Egypt - Market size and forecast (2023-2028) ($ million)
- Data Table on Egypt - Market size and forecast (2023-2028) ($ million)
- Chart on Egypt - Year-over-year growth (2023-2028) (%)
- Data Table on Egypt - Year-over-year growth (2023-2028) (%)
- 11.20 UAE - Market size and forecast (2023-2028)
- Chart on UAE - Market size and forecast (2023-2028) ($ million)
- Data Table on UAE - Market size and forecast (2023-2028) ($ million)
- Chart on UAE - Year-over-year growth (2023-2028) (%)
- Data Table on UAE - Year-over-year growth (2023-2028) (%)
- 11.21 Oman - Market size and forecast (2023-2028)
- Chart on Oman - Market size and forecast (2023-2028) ($ million)
- Data Table on Oman - Market size and forecast (2023-2028) ($ million)
- Chart on Oman - Year-over-year growth (2023-2028) (%)
- Data Table on Oman - Year-over-year growth (2023-2028) (%)
- 11.22 Argentina - Market size and forecast (2023-2028)
- Chart on Argentina - Market size and forecast (2023-2028) ($ million)
- Data Table on Argentina - Market size and forecast (2023-2028) ($ million)
- Chart on Argentina - Year-over-year growth (2023-2028) (%)
- Data Table on Argentina - Year-over-year growth (2023-2028) (%)
- 11.23 KSA - Market size and forecast (2023-2028)
- Chart on KSA - Market size and forecast (2023-2028) ($ million)
- Data Table on KSA - Market size and forecast (2023-2028) ($ million)
- Chart on KSA - Year-over-year growth (2023-2028) (%)
- Data Table on KSA - Year-over-year growth (2023-2028) (%)
- 11.24 UAE - Market size and forecast (2023-2028)
- Chart on UAE - Market size and forecast (2023-2028) ($ million)
- Data Table on UAE - Market size and forecast (2023-2028) ($ million)
- Chart on UAE - Year-over-year growth (2023-2028) (%)
- Data Table on UAE - Year-over-year growth (2023-2028) (%)
- 11.25 Brazil - Market size and forecast (2023-2028)
- Chart on Brazil - Market size and forecast (2023-2028) ($ million)
- Data Table on Brazil - Market size and forecast (2023-2028) ($ million)
- Chart on Brazil - Year-over-year growth (2023-2028) (%)
- Data Table on Brazil - Year-over-year growth (2023-2028) (%)
- 11.26 Rest of World (ROW) - Market size and forecast (2023-2028)
- Chart on Rest of World (ROW) - Market size and forecast (2023-2028) ($ million)
- Data Table on Rest of World (ROW) - Market size and forecast (2023-2028) ($ million)
- Chart on Rest of World (ROW) - Year-over-year growth (2023-2028) (%)
- Data Table on Rest of World (ROW) - Year-over-year growth (2023-2028) (%)
12 Drivers, Challenges, and Opportunity/Restraints
- 12.3 Impact of drivers and challenges
- Impact of drivers and challenges in 2023 and 2028
- 12.4 Market opportunities/restraints
13 Competitive Landscape
- 13.2 Competitive Landscape
- Overview on criticality of inputs and factors of differentiation
- 13.3 Landscape disruption
- Overview on factors of disruption
- 13.4 Industry risks
- Impact of key risks on business
14 Competitive Analysis
- 14.2 Market positioning of companies
- Matrix on companies position and classification
- 14.3 Cargill
- Cargill - Overview
- Cargill - Product / Service
- Cargill - Key offerings
- 14.4 Archer Daniels Midland Company
- Archer Daniels Midland Company - Overview
- Archer Daniels Midland Company - Product / Service
- Archer Daniels Midland Company - Key offerings
- 14.5 Tate & Lyle
- Tate & Lyle - Overview
- Tate & Lyle - Product / Service
- Tate & Lyle - Key offerings
- 14.6 Jungbunzlauer Suisse AG
- Jungbunzlauer Suisse AG - Overview
- Jungbunzlauer Suisse AG - Product / Service
- Jungbunzlauer Suisse AG - Key offerings
- 14.7 Cofco Biochemical
- Cofco Biochemical - Overview
- Cofco Biochemical - Product / Service
- Cofco Biochemical - Key offerings
- 14.8 Weifang Ensign Industry Co., Ltd.
- Weifang Ensign Industry Co., Ltd. - Overview
- Weifang Ensign Industry Co., Ltd. - Product / Service
- Weifang Ensign Industry Co., Ltd. - Key offerings
- 14.9 Gadot Biochemical Industries
- Gadot Biochemical Industries - Overview
- Gadot Biochemical Industries - Product / Service
- Gadot Biochemical Industries - Key offerings
- 14.10 Citrique Belge
- Citrique Belge - Overview
- Citrique Belge - Product / Service
- Citrique Belge - Key offerings
- 14.11 Sudzucker AG
- Sudzucker AG - Overview
- Sudzucker AG - Product / Service
- Sudzucker AG - Key offerings
- 14.12 Metagenics
- Metagenics - Overview
- Metagenics - Product / Service
- Metagenics - Key offerings
- 14.13 Huangshi Xinghua Biochemical Co., Ltd.
- Huangshi Xinghua Biochemical Co., Ltd. - Overview
- Huangshi Xinghua Biochemical Co., Ltd. - Product / Service
- Huangshi Xinghua Biochemical Co., Ltd. - Key offerings
- 14.14 TTCA Co., Ltd.
- TTCA Co., Ltd. - Overview
- TTCA Co., Ltd. - Product / Service
- TTCA Co., Ltd. - Key offerings
- 14.15 RZBC Group
- RZBC Group - Overview
- RZBC Group - Product / Service
- RZBC Group - Key offerings
- 14.16 Shandong Juxian Hongde Citric Acid Co., Ltd.
- Shandong Juxian Hongde Citric Acid Co., Ltd. - Overview
- Shandong Juxian Hongde Citric Acid Co., Ltd. - Product / Service
- Shandong Juxian Hongde Citric Acid Co., Ltd. - Key offerings
- 14.17 Anhui BBCA Biochemical Co., Ltd.
- Anhui BBCA Biochemical Co., Ltd. - Overview
- Anhui BBCA Biochemical Co., Ltd. - Product / Service
- Anhui BBCA Biochemical Co., Ltd. - Key offerings
- 14.18 Lemex
- Lemex - Overview
- Lemex - Product / Service
- Lemex - Key offerings
- 14.19 Posy Pharmachem Pvt. Ltd.
- Posy Pharmachem Pvt. Ltd. - Overview
- Posy Pharmachem Pvt. Ltd. - Product / Service
- Posy Pharmachem Pvt. Ltd. - Key offerings
- 14.20 Citro Egypt
- Citro Egypt - Overview
- Citro Egypt - Product / Service
- Citro Egypt - Key offerings
- 14.21 Saigon Food Ingredients
- Saigon Food Ingredients - Overview
- Saigon Food Ingredients - Product / Service
- Saigon Food Ingredients - Key offerings
- 14.22 Ensight Solutions
- Ensight Solutions - Overview
- Ensight Solutions - Product / Service
- Ensight Solutions - Key offerings
- 14.23 Anmol Chemicals Group
- Anmol Chemicals Group - Overview
- Anmol Chemicals Group - Product / Service
- Anmol Chemicals Group - Key offerings
- 14.24 Archer Daniels Midland Co.
- Archer Daniels Midland Co. - Overview
- Archer Daniels Midland Co. - Product / Service
- Archer Daniels Midland Co. - Key offerings
- 14.25 Cargill Inc.
- Cargill Inc. - Overview
- Cargill Inc. - Product / Service
- Cargill Inc. - Key offerings
- 14.26 Citribel NV
- Citribel NV - Overview
- Citribel NV - Product / Service
- Citribel NV - Key offerings
- 14.27 COFCO Corp.
- COFCO Corp. - Overview
- COFCO Corp. - Product / Service
- COFCO Corp. - Key offerings
- 14.28 Dastech International Inc.
- Dastech International Inc. - Overview
- Dastech International Inc. - Product / Service
- Dastech International Inc. - Key offerings
- 14.29 Foodchem International Corp.
- Foodchem International Corp. - Overview
- Foodchem International Corp. - Product / Service
- Foodchem International Corp. - Key offerings
- 14.30 Gadot Biochemical Industries Ltd.
- Gadot Biochemical Industries Ltd. - Overview
- Gadot Biochemical Industries Ltd. - Product / Service
- Gadot Biochemical Industries Ltd. - Key offerings
- 14.31 Hemadri Chemicals
- Hemadri Chemicals - Overview
- Hemadri Chemicals - Product / Service
- Hemadri Chemicals - Key offerings
- 14.32 Huangshi Xinghua Biochemical Co. Ltd.
- Huangshi Xinghua Biochemical Co. Ltd. - Overview
- Huangshi Xinghua Biochemical Co. Ltd. - Product / Service
- Huangshi Xinghua Biochemical Co. Ltd. - Key offerings
- 14.33 Jungbunzlauer Suisse AG
- Jungbunzlauer Suisse AG - Overview
- Jungbunzlauer Suisse AG - Product / Service
- Jungbunzlauer Suisse AG - Key offerings
- 14.34 Kenko Corp.
- Kenko Corp. - Overview
- Kenko Corp. - Product / Service
- Kenko Corp. - Key offerings
- 14.35 KIC Chemicals Inc.
- KIC Chemicals Inc. - Overview
- KIC Chemicals Inc. - Product / Service
- KIC Chemicals Inc. - Key offerings
- 14.36 MP Biomedicals Inc.
- MP Biomedicals Inc. - Overview
- MP Biomedicals Inc. - Product / Service
- MP Biomedicals Inc. - Key offerings
- 14.37 Niram Chemicals
- Niram Chemicals - Overview
- Niram Chemicals - Product / Service
- Niram Chemicals - Key offerings
- 14.38 Paras Chemical Industries
- Paras Chemical Industries - Overview
- Paras Chemical Industries - Product / Service
- Paras Chemical Industries - Key offerings
- 14.39 RZBC Group Co. Ltd.
- RZBC Group Co. Ltd. - Overview
- RZBC Group Co. Ltd. - Product / Service
- RZBC Group Co. Ltd. - Key offerings
- 14.40 Shandong Lemon Biochemical Co. Ltd.
- Shandong Lemon Biochemical Co. Ltd. - Overview
- Shandong Lemon Biochemical Co. Ltd. - Product / Service
- Shandong Lemon Biochemical Co. Ltd. - Key offerings
- 14.41 Tate and Lyle PLC
- Tate and Lyle PLC - Overview
- Tate and Lyle PLC - Product / Service
- Tate and Lyle PLC - Key offerings
- 14.42 Weifang Ensign Industry Co. Ltd.
- Weifang Ensign Industry Co. Ltd. - Overview
- Weifang Ensign Industry Co. Ltd. - Product / Service
- Weifang Ensign Industry Co. Ltd. - Key offerings
15 Appendix
- 15.2 Inclusions and exclusions checklist
- Inclusions checklist
- Exclusions checklist
- 15.3 Currency conversion rates for US$
- Currency conversion rates for US$
- 15.4 Research methodology
- 15.7 Validation techniques employed for market sizing
- Validation techniques employed for market sizing
- 15.9 360 degree market analysis
- 360 degree market analysis
- 15.10 List of abbreviations