US Organic Tea Market Analysis, Size, and Forecast 2025-2029

US Organic Tea Market Analysis, Size, and Forecast 2025-2029

Published: Dec 2024 143 Pages SKU: IRTNTR72268

Market Overview at a Glance

$93.9 Mn
Market Opportunity
5.2%
CAGR
4.8
YoY growth 2024-2025(%)

US Organic Tea Market Size 2025-2029 

The US organic tea market size is forecast to increase by USD 93.9 million, at a CAGR of 5.2% between 2024 and 2029.

  • The Organic Tea Market in the US is driven by the increasing awareness and recognition of the health benefits associated with consuming organic tea. This shift towards healthier beverage options is particularly noticeable in the rising demand for organic Matcha green tea, known for its high antioxidant content and potential health advantages. However, the market faces a significant challenge with the potential health risks of overconsumption of tea, including caffeine-related side effects and the possibility of heavy metal contamination in non-organic teas. Companies seeking to capitalize on market opportunities should focus on offering high-quality organic tea products, transparent sourcing, and clear labeling to meet the growing consumer demand for healthier and ethically-sourced beverage options.
  • Meanwhile, navigating the challenge of overconsumption requires continuous research and innovation to develop organic teas with lower caffeine content or alternative sources of antioxidants. By addressing these market dynamics, companies can effectively position themselves in the competitive organic tea landscape and cater to the evolving preferences of health-conscious consumers.

What will be the size of the US Organic Tea Market during the forecast period?

Organic Tea Market in US Size

Explore in-depth regional segment analysis with market size data - historical 2019-2023 and forecasts 2025-2029 - in the full report.  
 Request Free Sample

  • In the dynamic organic tea market in the US, producers are continually seeking ways to improve labor efficiency and analyze production costs to stay competitive. Branding strategies and crop rotation are essential for differentiating offerings and ensuring a consistent supply of high-quality tea varietals. Climate change adaptation is a critical consideration for tea farmers, with water conservation methods and soil erosion prevention key to mitigating risks. Customer satisfaction is paramount, and tea companies employ various strategies, including shelf-life extension, sales channel optimization, and pricing strategies, to meet consumer demands. Processing technology and brand building are crucial for market penetration, with packaging innovations and traceability technologies enhancing transparency and trust.
  • Sales forecasting and risk management are essential components of effective business strategies, while organic compost production, customer relationship management, integrated pest management, and weed management practices contribute to sustainable farming. Fertilizer application, beneficial insect introduction, pest control strategies, tea yield optimization, and quality control systems are all integral parts of the organic tea production process.

How is this market segmented?

The market research report provides comprehensive data (region-wise segment analysis), with forecasts and estimates in "USD million" for the period 2025-2029, as well as historical data from 2019-2023 for the following segments.

  • Product
    • Organic herbal tea
    • Organic green tea
    • Organic black tea
  • Distribution Channel
    • Supermarket and hypermarket
    • Health food stores
    • Independent retailers
    • Others
  • Packaging
    • Plastic Containers
    • Aluminium Tin
    • Paper Boards
    • Others
  • End-User
    • Health-Conscious Consumers
    • General Consumers
    • Foodservice
  • Form
    • Loose Leaf
    • Tea Bags
    • Ready-to-Drink
  • Geography
    • North America
      • US

By Product Insights

The organic herbal tea segment is estimated to witness significant growth during the forecast period.

The organic herbal tea market in the US is experiencing significant growth due to increasing consumer preference for organic and eco-friendly products. This trend is driven by the health benefits associated with organic tea and the desire for sustainable farming practices. Herbs used in organic herbal tea have medicinal properties, making the product a popular choice among consumers. Arbor Teas, a Michigan-based company, offers a range of organic herbal teas, including Organic Chamomile, Organic Crimson Berry Fruit Tisane, Organic Orange Spice Lemongrass Tisane, Organic Peppermint, and Organic Yerba Mate. These teas cater to diverse consumer demands, reflecting the market's evolving patterns.

Tea harvesting techniques play a crucial role in preserving the tea's flavor stability. Organic tea farming ensures that no synthetic fertilizers or pesticides are used, promoting soil health indicators. Tea leaves are processed using various methods, such as oxidation and drying, to enhance their flavor compounds and aroma profile. Tea packaging materials must ensure product freshness and prevent microbial contamination. Tea brewing parameters, such as water temperature and steeping time, affect the tea's flavor and antioxidant properties. Sensory evaluation methods are used to assess tea quality, ensuring consistent product differentiation. Price elasticity and retail shelf life are essential considerations for companies in this market.

Organic certification standards and fair trade certification further add to the product's appeal. Sustainable tea cultivation practices and water usage efficiency are essential for the long-term growth of the organic herbal tea market. Tea waste management is another critical issue, with companies exploring innovative ways to reduce waste and promote circular economy principles. Quality control measures, such as pesticide residue testing and microbial contamination control, are essential to maintain consumer trust and preference.

Organic Tea Market in US Size

Download Free Sample Report

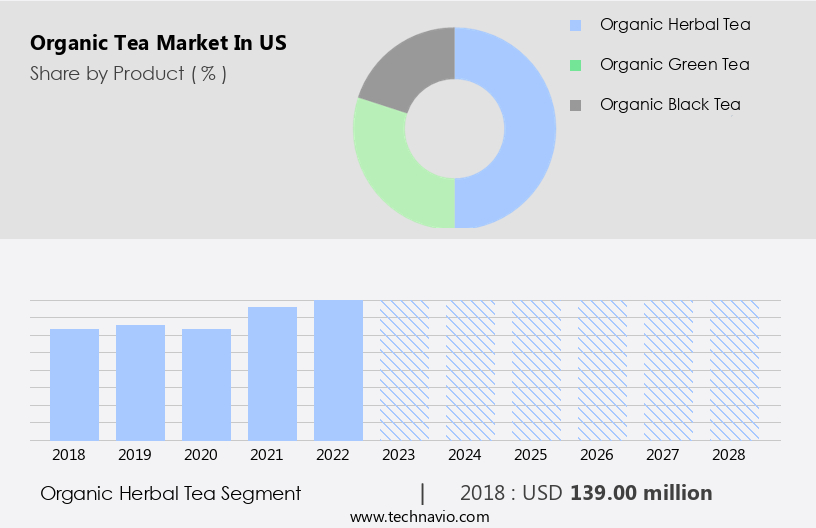
The Organic herbal tea segment was valued at  USD 144.50 million in 2019 and showed a gradual increase during the forecast period.

Market Dynamics

Our researchers analyzed the data with 2024 as the base year, along with the key drivers, trends, and challenges. A holistic analysis of drivers will help companies refine their marketing strategies to gain a competitive advantage.

B2B tea supply strategies utilize sustainable tea technologies for premium markets. Organic tea prospects 2025 include herbal teas for cafes and organic tea blends, boosting demand. Tea logistics analytics optimize distribution, while organic tea benchmarks spotlight Numi Organic Tea. Sustainable tea sourcing aligns with wellness beverage trends. Tea regulations 2025-2029 steer organic tea demand in California 2025. Premium tea offerings and organic tea forecasts fuel expansion. Teas for corporate wellness and custom tea formulations target niches. Organic tea hurdles and innovations address supply constraints, with tea supplier networks and tea cost tactics enhancing profitability. Organic tea insights and sustainable beverage breakthroughs accelerate momentum.

What are the US Organic Tea Market drivers leading to the rise in adoption of the Industry?

  • The organic tea market is driven primarily by the increasing recognition of its health benefits. Organic tea consumption continues to gain popularity in the market due to its numerous health benefits. Tea products, infused with herbs and medicinal plant extracts, offer protection against various health issues. Two notable examples are hibiscus tea and yerba mate. Hibiscus tea, rich in vitamin C and flavonoids, is known for its ability to reduce blood sugar levels, lower blood pressure, aid in digestion, and keep the liver healthy. Hibiscus tea consumption can also help alleviate menstrual cramps. On the other hand, yerba mate, which is rich in antioxidants and nutrients, provides energy and immunity boost, improves mental focus and physical performance, and helps in losing body fat and weight.
  • Additionally, it lowers the risk of heart diseases. To cater to the growing demand for organic tea, companies focus on water usage efficiency, tea waste management, and sustainable tea cultivation practices. Tea quality assessment is another crucial factor that differentiates companies in the market. Retail shelf life and organic certification standards also play a significant role in product differentiation. Distribution channels are expanding to include e-commerce platforms and specialty stores to cater to diverse consumer preferences. Overall, the organic tea market is driven by the increasing health consciousness of consumers and the growing awareness of the benefits of organic tea.

What are the US Organic Tea Market trends shaping the Industry?

  • The increasing popularity of organic Matcha green tea represents a significant market trend. This premium tea variety, known for its rich antioxidant properties, is experiencing a surge in demand due to growing consumer awareness and preference for healthier beverage options.
  • Organic Matcha green tea, a Japanese-style powdered green tea, is experiencing growing demand due to its numerous health benefits. Consumers are drawn to this tea for its combination of theanine and caffeine, which promotes mental alertness and focus. Additionally, organic Matcha green tea is rich in antioxidant catechins, offering anti-inflammatory health benefits. Women, in particular, value this tea for its potential skin health advantages. The production of organic Matcha green tea involves careful harvesting techniques, ensuring the tea leaves are picked at the peak of maturity. The tea leaves undergo specific processing methods, such as tea leaf processing and tea oxidation, to preserve tea flavor stability.
  • The use of organic farming practices ensures the tea is free from synthetic fertilizers and pesticides, enhancing its natural flavor and nutritional value. Tea packaging materials play a crucial role in maintaining the tea's freshness and flavor. Consumer behavior trends favor sustainable and eco-friendly packaging. Supply chain traceability is also a priority, with consumers seeking transparency regarding the origin and production methods of their tea. Tea cup testing is an essential step in the quality assessment of organic Matcha green tea. This process ensures the tea meets specific taste, aroma, and color standards. Overall, the organic Matcha green tea market is driven by consumer preferences for healthier, more sustainable, and naturally produced food and beverage options.

How does US Organic Tea Market faces challenges face during its growth?

  • The overconsumption of tea poses a significant challenge to the industry's growth, as excessive consumption can negatively impact both consumers' health and the sustainability of tea production. 
  • Organic tea has gained significant popularity in the health-conscious market due to its numerous health benefits. The organic tea farming process ensures the absence of synthetic fertilizers and pesticides, preserving the tea's natural antioxidant properties and flavor compounds. Tea drying methods also play a crucial role in maintaining the tea's quality. The tea brewing parameters and sensory evaluation methods are essential to enhance the tea aroma profile and ensure consistent quality. Microbial contamination control and quality control measures are integral to the production process to maintain the purity and safety of organic tea. Organic tea is rich in antioxidants, which help protect the body from free radicals and reduce the risk of chronic diseases.
  • The tea flavor compounds contribute to its unique taste and aroma, making it a preferred beverage for many. Maintaining the ideal brewing parameters and sensory evaluation methods is essential to preserve the tea's aroma profile and ensure consistent quality. Microbial contamination and quality control measures are crucial to maintain the purity and safety of organic tea. Excessive consumption of tea, however, can have adverse effects. The high caffeine content can lead to dehydration, bloating, and nutrient deficiencies. Therefore, it is recommended to limit daily tea intake to three cups to avoid potential health risks.

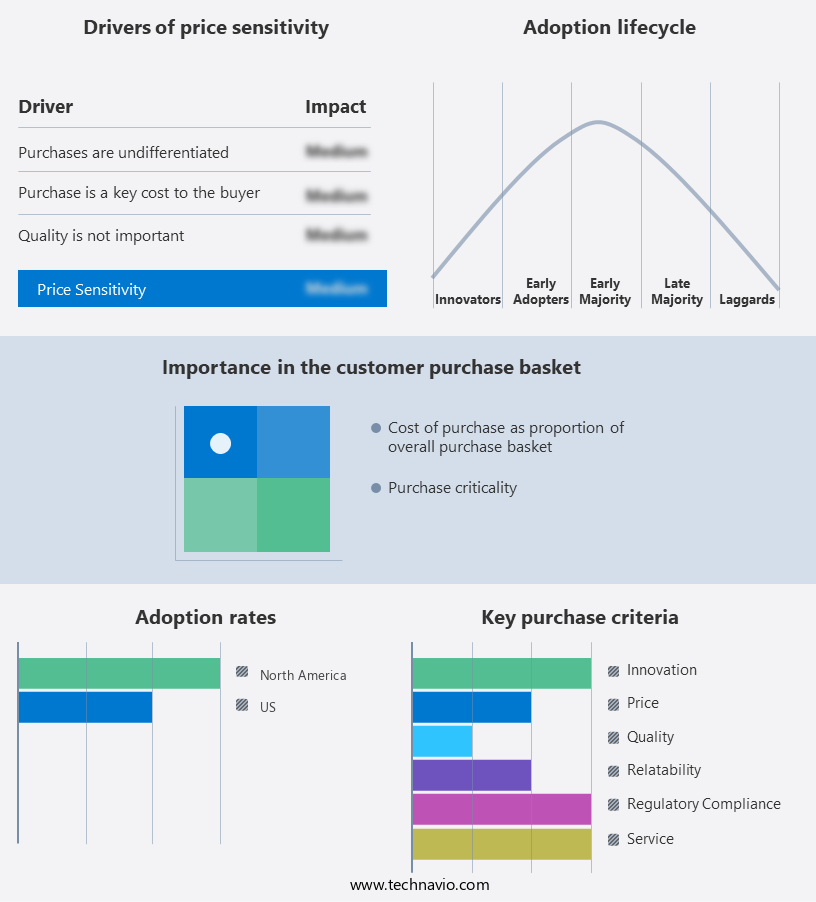
Exclusive US Organic Tea Market Customer Landscape

The market forecasting report includes the adoption lifecycle of the market, covering from the innovator's stage to the laggard's stage. It focuses on adoption rates in different regions based on penetration. Furthermore, the report also includes key purchase criteria and drivers of price sensitivity to help companies evaluate and develop their market growth analysis strategies.

Organic Tea Market in US Share by Geography

 Customer Landscape

Key Companies & Market Insights

Companies are implementing various strategies, such as strategic alliances, market forecast partnerships, mergers and acquisitions, geographical expansion, and product/service launches, to enhance their presence in the market.

The market research and growth report includes detailed analyses of the competitive landscape of the market and information about key companies, including:

  • Arbor Teas
  • Big Heart Tea Co.
  • Cup of Te
  • Davidsons Organics
  • Divinitea
  • East West Tea Co. LLC
  • Equal Exchange
  • Five Mountains
  • Heavenly Tea Inc.
  • Indigo Tea Co.
  • Kai Organic Tea
  • Numi Inc.
  • ORIENTIS GOURMET Group
  • Revolution Tea LLC
  • Rishi Tea and Botanicals
  • The Art of Tea LLC
  • The Hain Celestial Group Inc.
  • The Path of Tea
  • The Republic of Tea Inc.
  • Two Leaves and a Bud Inc.

Qualitative and quantitative analysis of companies has been conducted to help clients understand the wider business environment as well as the strengths and weaknesses of key market players. Data is qualitatively analyzed to categorize companies as pure play, category-focused, industry-focused, and diversified; it is quantitatively analyzed to categorize companies as dominant, leading, strong, tentative, and weak.

Recent Development and News in Organic Tea Market In US

  • In January 2024, Tazo Tea, a Starbucks Corporation brand, introduced an organic matcha green tea line in response to growing consumer demand for organic and sustainable tea options (Starbucks Corporation Press Release). In March 2024, Lipton, a Unilever brand, announced a strategic partnership with Climate Focus, a non-profit organization, to improve the sustainability of their tea supply chain and meet increasing consumer expectations for eco-friendly practices (Unilever Press Release).
  • In April 2024, Nestle, the world's largest food and beverage company, completed the acquisition of a 68% stake in the organic tea brand, Traditional Medicinals, for an undisclosed amount, expanding their presence in the organic tea market (Nestle Press Release). In May 2025, the USDA (United States Department of Agriculture) announced new regulations to strengthen organic tea certification standards, ensuring that all imported organic tea meets the same stringent requirements as domestically produced organic tea, bolstering consumer trust and confidence in the organic tea market (USDA Press Release).

Research Analyst Overview

The organic tea market in the US continues to evolve, with dynamic market activities shaping its landscape. Harvesting techniques, a crucial factor, are continually refined to ensure optimal tea flavor stability. Organic tea farming employs sustainable methods, such as soil health indicators and natural fertilizers, to enhance tea plant nutrition. Tea flavor compounds and aroma profile are influenced by oxidation methods and brewing parameters. Tea leaf processing, from withering to rolling and fermentation, impacts flavor development. Supply chain traceability and fair trade certification are essential for consumer trust. Tea packaging materials, from biodegradable plastics to traditional paper, are under scrutiny for their environmental impact.

Consumer behavior, driven by health consciousness and ethical considerations, influences brand positioning and price elasticity. Tea cup testing, sensory evaluation methods, and microbial contamination control are crucial quality control measures. Pesticide residue testing and tea antioxidant properties are essential for organic certification. Tea drying methods, such as sun drying and pan firing, affect tea's flavor and aroma. Tea storage conditions, temperature, and humidity, impact tea flavor stability. Tea waste management and water usage efficiency are essential for sustainable tea cultivation. Tea caffeine content and polyphenol analysis are essential for product differentiation. Quality assessment, distribution channels, and retail shelf life are critical factors for market success.

Brand positioning, price elasticity, and consumer preference are interconnected. Sustainable tea cultivation, tea oxidation methods, and tea leaf processing are ongoing areas of research and development. The organic tea market's continuous dynamism underscores its potential for growth and innovation.

Dive into Technavio's robust research methodology, blending expert interviews, extensive data synthesis, and validated models for unparalleled Organic Tea Market in US insights. See full methodology.

Market Scope

Report Coverage

Details

Page number

143

Base year

2024

Historic period

2019-2023

Forecast period

2025-2029

Growth momentum & CAGR

Accelerate at a CAGR of 5.2%

Market growth 2025-2029

USD 93.9 million

Market structure

Fragmented

YoY growth 2024-2025(%)

4.8

Competitive landscape

Leading Companies, Market Positioning of Companies, Competitive Strategies, and Industry Risks

Request Free Sample

What are the Key Data Covered in this Market Research Report?

  • CAGR of the market during the forecast period
  • Detailed information on factors that will drive the market growth and forecasting between 2025 and 2029
  • Precise estimation of the size of the market  and its contribution of the market in focus to the parent market
  • Accurate predictions about upcoming market growth and trends and changes in consumer behaviour
  • Growth of the market across US
  • Thorough analysis of the market's competitive landscape and detailed information about companies
  • Comprehensive analysis of factors that will challenge the growth of market companies

We can help! Our analysts can customize this market research report to meet your requirements Get in touch

1 Executive Summary

  • 1.1 Market overview
    • Executive Summary - Chart on Market Overview
    • Executive Summary - Data Table on Market Overview
    • Executive Summary - Chart on Country Market Characteristics
    • Executive Summary - Chart on Market Segmentation by Product
    • Executive Summary - Chart on Market Segmentation by Distribution Channel
    • Executive Summary - Chart on Company Market Positioning

2 Technavio Analysis

  • 2.1 Analysis of price sensitivity, lifecycle, customer purchase basket, adoption rates, and purchase criteria
    • Analysis of price sensitivity, lifecycle, customer purchase basket, adoption rates, and purchase criteria
  • 2.2 Criticality of inputs and Factors of differentiation
    • Overview on criticality of inputs and factors of differentiation
  • 2.3 Factors of disruption
    • Overview on factors of disruption
  • 2.4 Impact of drivers and challenges
    • Impact of drivers and challenges in 2024 and 2029

3 Market Landscape

  • 3.1 Market ecosystem
    • Parent Market
    • Data Table on - Parent Market
  • 3.2 Market characteristics
    • Market characteristics analysis
  • 3.3 Value chain analysis
    • Value chain analysis

4 Market Sizing

  • 4.1 Market definition
    • Offerings of companies included in the market definition
  • 4.2 Market segment analysis
    • Market segments
  • 4.3 Market size 2024
    • 4.4 Market outlook: Forecast for 2024-2029
      • Chart on US - Market size and forecast 2024-2029 ($ million)
      • Data Table on US - Market size and forecast 2024-2029 ($ million)
      • Chart on US: Year-over-year growth 2024-2029 (%)
      • Data Table on US: Year-over-year growth 2024-2029 (%)

    5 Historic Market Size

    • 5.1 Organic Tea Market in US 2019 - 2023
      • Historic Market Size - Data Table on Organic Tea Market in US 2019 - 2023 ($ million)
    • 5.2 Product segment analysis 2019 - 2023
      • Historic Market Size - Product Segment 2019 - 2023 ($ million)
    • 5.3 Distribution Channel segment analysis 2019 - 2023
      • Historic Market Size - Distribution Channel Segment 2019 - 2023 ($ million)

    6 Qualitative Analysis

    • 6.1 The AI impact on Organic Tea Market in US

      7 Five Forces Analysis

      • 7.1 Five forces summary
        • Five forces analysis - Comparison between 2024 and 2029
      • 7.2 Bargaining power of buyers
        • Bargaining power of buyers - Impact of key factors 2024 and 2029
      • 7.3 Bargaining power of suppliers
        • Bargaining power of suppliers - Impact of key factors in 2024 and 2029
      • 7.4 Threat of new entrants
        • Threat of new entrants - Impact of key factors in 2024 and 2029
      • 7.5 Threat of substitutes
        • Threat of substitutes - Impact of key factors in 2024 and 2029
      • 7.6 Threat of rivalry
        • Threat of rivalry - Impact of key factors in 2024 and 2029
      • 7.7 Market condition
        • Chart on Market condition - Five forces 2024 and 2029

      8 Market Segmentation by Product

      • 8.1 Market segments
        • Chart on Product - Market share (2024-2029) (%)
        • Data Table on Product - Market share (2024-2029) (%)
      • 8.2 Comparison by Product
        • Chart on Comparison by Product
        • Data Table on Comparison by Product
      • 8.3 Organic herbal tea - Market size and forecast (2024-2029)
        • Chart on Organic herbal tea - Market size and forecast (2024-2029) ($ million)
        • Data Table on Organic herbal tea - Market size and forecast (2024-2029) ($ million)
        • Chart on Organic herbal tea - Year-over-year growth (2024-2029) (%)
        • Data Table on Organic herbal tea - Year-over-year growth (2024-2029) (%)
      • 8.4 Organic green tea - Market size and forecast (2024-2029)
        • Chart on Organic green tea - Market size and forecast (2024-2029) ($ million)
        • Data Table on Organic green tea - Market size and forecast (2024-2029) ($ million)
        • Chart on Organic green tea - Year-over-year growth (2024-2029) (%)
        • Data Table on Organic green tea - Year-over-year growth (2024-2029) (%)
      • 8.5 Organic black tea - Market size and forecast (2024-2029)
        • Chart on Organic black tea - Market size and forecast (2024-2029) ($ million)
        • Data Table on Organic black tea - Market size and forecast (2024-2029) ($ million)
        • Chart on Organic black tea - Year-over-year growth (2024-2029) (%)
        • Data Table on Organic black tea - Year-over-year growth (2024-2029) (%)
      • 8.6 Market opportunity by Product
        • Market opportunity by Product ($ million)
        • Data Table on Market opportunity by Product ($ million)

      9 Market Segmentation by Distribution Channel

      • 9.1 Market segments
        • Chart on Distribution Channel - Market share (2024-2029) (%)
        • Data Table on Distribution Channel - Market share (2024-2029) (%)
      • 9.2 Comparison by Distribution Channel
        • Chart on Comparison by Distribution Channel
        • Data Table on Comparison by Distribution Channel
      • 9.3 Supermarket and hypermarket - Market size and forecast (2024-2029)
        • Chart on Supermarket and hypermarket - Market size and forecast (2024-2029) ($ million)
        • Data Table on Supermarket and hypermarket - Market size and forecast (2024-2029) ($ million)
        • Chart on Supermarket and hypermarket - Year-over-year growth (2024-2029) (%)
        • Data Table on Supermarket and hypermarket - Year-over-year growth (2024-2029) (%)
      • 9.4 Health food stores - Market size and forecast (2024-2029)
        • Chart on Health food stores - Market size and forecast (2024-2029) ($ million)
        • Data Table on Health food stores - Market size and forecast (2024-2029) ($ million)
        • Chart on Health food stores - Year-over-year growth (2024-2029) (%)
        • Data Table on Health food stores - Year-over-year growth (2024-2029) (%)
      • 9.5 Independent retailers - Market size and forecast (2024-2029)
        • Chart on Independent retailers - Market size and forecast (2024-2029) ($ million)
        • Data Table on Independent retailers - Market size and forecast (2024-2029) ($ million)
        • Chart on Independent retailers - Year-over-year growth (2024-2029) (%)
        • Data Table on Independent retailers - Year-over-year growth (2024-2029) (%)
      • 9.6 Others - Market size and forecast (2024-2029)
        • Chart on Others - Market size and forecast (2024-2029) ($ million)
        • Data Table on Others - Market size and forecast (2024-2029) ($ million)
        • Chart on Others - Year-over-year growth (2024-2029) (%)
        • Data Table on Others - Year-over-year growth (2024-2029) (%)
      • 9.7 Market opportunity by Distribution Channel
        • Market opportunity by Distribution Channel ($ million)
        • Data Table on Market opportunity by Distribution Channel ($ million)

      10 Market Segmentation by Packaging

      • 10.1 Market segments
        • Chart on Packaging - Market share (2024-2029) (%)
        • Data Table on Packaging - Market share (2024-2029) (%)
      • 10.2 Comparison by Packaging
        • Chart on Comparison by Packaging
        • Data Table on Comparison by Packaging
      • 10.3 Plastic Containers - Market size and forecast (2024-2029)
        • Chart on Plastic Containers - Market size and forecast (2024-2029) ($ million)
        • Data Table on Plastic Containers - Market size and forecast (2024-2029) ($ million)
        • Chart on Plastic Containers - Year-over-year growth (2024-2029) (%)
        • Data Table on Plastic Containers - Year-over-year growth (2024-2029) (%)
      • 10.4 Aluminium Tin - Market size and forecast (2024-2029)
        • Chart on Aluminium Tin - Market size and forecast (2024-2029) ($ million)
        • Data Table on Aluminium Tin - Market size and forecast (2024-2029) ($ million)
        • Chart on Aluminium Tin - Year-over-year growth (2024-2029) (%)
        • Data Table on Aluminium Tin - Year-over-year growth (2024-2029) (%)
      • 10.5 Paper Boards - Market size and forecast (2024-2029)
        • Chart on Paper Boards - Market size and forecast (2024-2029) ($ million)
        • Data Table on Paper Boards - Market size and forecast (2024-2029) ($ million)
        • Chart on Paper Boards - Year-over-year growth (2024-2029) (%)
        • Data Table on Paper Boards - Year-over-year growth (2024-2029) (%)
      • 10.6 Others - Market size and forecast (2024-2029)
        • Chart on Others - Market size and forecast (2024-2029) ($ million)
        • Data Table on Others - Market size and forecast (2024-2029) ($ million)
        • Chart on Others - Year-over-year growth (2024-2029) (%)
        • Data Table on Others - Year-over-year growth (2024-2029) (%)
      • 10.7 Market opportunity by Packaging
        • Market opportunity by Packaging ($ million)
        • Data Table on Market opportunity by Packaging ($ million)

      11 Market Segmentation by End-User

      • 11.1 Market segments
        • Chart on End-User - Market share (2024-2029) (%)
        • Data Table on End-User - Market share (2024-2029) (%)
      • 11.2 Comparison by End-User
        • Chart on Comparison by End-User
        • Data Table on Comparison by End-User
      • 11.3 Health-Conscious Consumers - Market size and forecast (2024-2029)
        • Chart on Health-Conscious Consumers - Market size and forecast (2024-2029) ($ million)
        • Data Table on Health-Conscious Consumers - Market size and forecast (2024-2029) ($ million)
        • Chart on Health-Conscious Consumers - Year-over-year growth (2024-2029) (%)
        • Data Table on Health-Conscious Consumers - Year-over-year growth (2024-2029) (%)
      • 11.4 General Consumers - Market size and forecast (2024-2029)
        • Chart on General Consumers - Market size and forecast (2024-2029) ($ million)
        • Data Table on General Consumers - Market size and forecast (2024-2029) ($ million)
        • Chart on General Consumers - Year-over-year growth (2024-2029) (%)
        • Data Table on General Consumers - Year-over-year growth (2024-2029) (%)
      • 11.5 Foodservice - Market size and forecast (2024-2029)
        • Chart on Foodservice - Market size and forecast (2024-2029) ($ million)
        • Data Table on Foodservice - Market size and forecast (2024-2029) ($ million)
        • Chart on Foodservice - Year-over-year growth (2024-2029) (%)
        • Data Table on Foodservice - Year-over-year growth (2024-2029) (%)
      • 11.6 Market opportunity by End-User
        • Market opportunity by End-User ($ million)
        • Data Table on Market opportunity by End-User ($ million)

      12 Market Segmentation by Form

      • 12.1 Market segments
        • Chart on Form - Market share (2024-2029) (%)
        • Data Table on Form - Market share (2024-2029) (%)
      • 12.2 Comparison by Form
        • Chart on Comparison by Form
        • Data Table on Comparison by Form
      • 12.3 Loose Leaf - Market size and forecast (2024-2029)
        • Chart on Loose Leaf - Market size and forecast (2024-2029) ($ million)
        • Data Table on Loose Leaf - Market size and forecast (2024-2029) ($ million)
        • Chart on Loose Leaf - Year-over-year growth (2024-2029) (%)
        • Data Table on Loose Leaf - Year-over-year growth (2024-2029) (%)
      • 12.4 Tea Bags - Market size and forecast (2024-2029)
        • Chart on Tea Bags - Market size and forecast (2024-2029) ($ million)
        • Data Table on Tea Bags - Market size and forecast (2024-2029) ($ million)
        • Chart on Tea Bags - Year-over-year growth (2024-2029) (%)
        • Data Table on Tea Bags - Year-over-year growth (2024-2029) (%)
      • 12.5 Ready-to-Drink - Market size and forecast (2024-2029)
        • Chart on Ready-to-Drink - Market size and forecast (2024-2029) ($ million)
        • Data Table on Ready-to-Drink - Market size and forecast (2024-2029) ($ million)
        • Chart on Ready-to-Drink - Year-over-year growth (2024-2029) (%)
        • Data Table on Ready-to-Drink - Year-over-year growth (2024-2029) (%)
      • 12.6 Market opportunity by Form
        • Market opportunity by Form ($ million)
        • Data Table on Market opportunity by Form ($ million)

      13 Customer Landscape

      • 13.1 Customer landscape overview
        • Analysis of price sensitivity, lifecycle, customer purchase basket, adoption rates, and purchase criteria

      14 Drivers, Challenges, and Opportunity/Restraints

      • 14.1 Market drivers
        • 14.2 Market challenges
          • 14.3 Impact of drivers and challenges
            • Impact of drivers and challenges in 2024 and 2029
          • 14.4 Market opportunities/restraints

            15 Competitive Landscape

            • 15.1 Overview
              • 15.2 Competitive Landscape
                • Overview on criticality of inputs and factors of differentiation
              • 15.3 Landscape disruption
                • Overview on factors of disruption
              • 15.4 Industry risks
                • Impact of key risks on business

              16 Competitive Analysis

              • 16.1 Companies profiled
                • Companies covered
              • 16.2 Company ranking index
                • Company ranking index
              • 16.3 Market positioning of companies
                • Matrix on companies position and classification
              • 16.4 Arbor Teas
                • Arbor Teas - Overview
                • Arbor Teas - Product / Service
                • Arbor Teas - Key offerings
                • SWOT
              • 16.5 Davidsons Organics
                • Davidsons Organics - Overview
                • Davidsons Organics - Product / Service
                • Davidsons Organics - Key offerings
                • SWOT
              • 16.6 East West Tea Co. LLC
                • East West Tea Co. LLC - Overview
                • East West Tea Co. LLC - Product / Service
                • East West Tea Co. LLC - Key offerings
                • SWOT
              • 16.7 Equal Exchange
                • Equal Exchange - Overview
                • Equal Exchange - Product / Service
                • Equal Exchange - Key offerings
                • SWOT
              • 16.8 Five Mountains
                • Five Mountains - Overview
                • Five Mountains - Product / Service
                • Five Mountains - Key offerings
                • SWOT
              • 16.9 Heavenly Tea Inc.
                • Heavenly Tea Inc. - Overview
                • Heavenly Tea Inc. - Product / Service
                • Heavenly Tea Inc. - Key offerings
                • SWOT
              • 16.10 Numi Inc.
                • Numi Inc. - Overview
                • Numi Inc. - Product / Service
                • Numi Inc. - Key offerings
                • SWOT
              • 16.11 Rishi Tea and Botanicals
                • Rishi Tea and Botanicals - Overview
                • Rishi Tea and Botanicals - Product / Service
                • Rishi Tea and Botanicals - Key offerings
                • SWOT
              • 16.12 The Art of Tea LLC
                • The Art of Tea LLC - Overview
                • The Art of Tea LLC - Product / Service
                • The Art of Tea LLC - Key offerings
                • SWOT
              • 16.13 The Hain Celestial Group Inc.
                • The Hain Celestial Group Inc. - Overview
                • The Hain Celestial Group Inc. - Business segments
                • The Hain Celestial Group Inc. - Key news
                • The Hain Celestial Group Inc. - Key offerings
                • The Hain Celestial Group Inc. - Segment focus
                • SWOT

              17 Appendix

              • 17.1 Scope of the report
                • 17.2 Inclusions and exclusions checklist
                  • Inclusions checklist
                  • Exclusions checklist
                • 17.3 Currency conversion rates for US$
                  • Currency conversion rates for US$
                • 17.4 Research methodology
                  • Research methodology
                • 17.5 Data procurement
                  • Information sources
                • 17.6 Data validation
                  • Data validation
                • 17.7 Validation techniques employed for market sizing
                  • Validation techniques employed for market sizing
                • 17.8 Data synthesis
                  • Data synthesis
                • 17.9 360 degree market analysis
                  • 360 degree market analysis
                • 17.10 List of abbreviations
                  • List of abbreviations

                Research Methodology

                Technavio presents a detailed picture of the market by way of study, synthesis, and summation of data from multiple sources. The analysts have presented the various facets of the market with a particular focus on identifying the key industry influencers. The data thus presented is comprehensive, reliable, and the result of extensive research, both primary and secondary.

                INFORMATION SOURCES

                Primary sources

                • Manufacturers and suppliers
                • Channel partners
                • Industry experts
                • Strategic decision makers

                Secondary sources

                • Industry journals and periodicals
                • Government data
                • Financial reports of key industry players
                • Historical data
                • Press releases

                DATA ANALYSIS

                Data Synthesis

                • Collation of data
                • Estimation of key figures
                • Analysis of derived insights

                Data Validation

                • Triangulation with data models
                • Reference against proprietary databases
                • Corroboration with industry experts

                REPORT WRITING

                Qualitative

                • Market drivers
                • Market challenges
                • Market trends
                • Five forces analysis

                Quantitative

                • Market size and forecast
                • Market segmentation
                • Geographical insights
                • Competitive landscape

                Interested in this report?

                Get your sample now to see our research methodology and insights!

                Download Now

                Frequently Asked Questions

                Organic Tea market growth will increase by $ 93.9 mn during 2025-2029.

                The Organic Tea market is expected to grow at a CAGR of 5.2% during 2025-2029.

                Organic Tea market is segmented by Product( Organic herbal tea, Organic green tea, Organic black tea) Distribution Channel( Supermarket and hypermarket, Health food stores, Independent retailers, Others) Packaging( Plastic Containers, Aluminium Tin, Paper Boards, Others)

                Arbor Teas, Big Heart Tea Co., Cup of Te, Davidsons Organics, Divinitea, East West Tea Co. LLC, Equal Exchange, Five Mountains, Heavenly Tea Inc., Indigo Tea Co., Kai Organic Tea, Numi Inc., ORIENTIS GOURMET Group, Revolution Tea LLC, Rishi Tea and Botanicals, The Art of Tea LLC, The Hain Celestial Group Inc., The Path of Tea, The Republic of Tea Inc., Two Leaves and a Bud Inc. are a few of the key vendors in the Organic Tea market.

                North America will register the highest growth rate of 100% among the other regions. Therefore, the Organic Tea market in North America is expected to garner significant business opportunities for the vendors during the forecast period.

                US

                • Increasing health benefits of organic teaConsumers prefer to consume organic tea over other beverages because it contains herbs and medicinal plant extracts that are beneficial for the body. Tea products infused with healthy ingredients protect against cold and improve digestion and immunity. Vendors are offering tea products containing hibiscus flower petals is the driving factor this market.
                • which help in minimizing blood sugar and blood pressure levels.Yerba mate: It is rich in antioxidants and nutrients is the driving factor this market.
                • boosts energy and immunity is the driving factor this market.
                • improves mental focus and physical performance is the driving factor this market.
                • helps to lose body fat and weight is the driving factor this market.
                • and lowers blood sugar levels and the risk of heart diseases.Hibiscus tea: It is rich in vitamin C and contains flavonoids is the driving factor this market.
                • reduces blood sugar levels is the driving factor this market.
                • lowers blood pressure is the driving factor this market.
                • aids in digestion is the driving factor this market.
                • helps in reducing menstrual cramps is the driving factor this market.
                • and keeps the liver healthy.Lemongrass tea: It is rich in inflammation-fighting compounds such as disorienting and chlorogenic acid is the driving factor this market.
                • helps in relieving anxiety and pain is the driving factor this market.
                • lowers cholesterol levels is the driving factor this market.
                • prevents infection is the driving factor this market.
                • boosts oral health is the driving factor this market.
                • and increases the red blood cell count.Chamomile tea: It is rich in flavonoids is the driving factor this market.
                • helps in reducing menstrual pain is the driving factor this market.
                • lowers blood sugar levels is the driving factor this market.
                • and helps with relaxation and sleep.Similarly is the driving factor this market.
                • tea products containing ginger is the driving factor this market.
                • citrus is the driving factor this market.
                • and mint help to relax a tired body. The growing consumer awareness about the availability of such tea products and their benefits will boost the sales of these products. This demand for low-calorie tea will lead to the expansion of the organic tea market in US during the forecast period. is the driving factor this market.

                The Organic Tea market vendors should focus on grabbing business opportunities from the Organic herbal tea segment as it accounted for the largest market share in the base year.
                RIA - Research AI Assistant
                Ask RIA