Organic Wine Market Analysis, Size, and Forecast 2026-2030: Europe (Germany, UK, and France), North America (US, Canada, and Mexico), APAC (China, Japan, and India), South America (Brazil and Argentina), Middle East and Africa (Saudi Arabia, UAE, and South Africa), and Rest of World (ROW)

Organic Wine Market Analysis, Size, and Forecast 2026-2030:
Europe (Germany, UK, and France), North America (US, Canada, and Mexico), APAC (China, Japan, and India), South America (Brazil and Argentina), Middle East and Africa (Saudi Arabia, UAE, and South Africa), and Rest of World (ROW)

Published: May 2026 283 Pages SKU: IRTNTR44953

Market Overview at a Glance

$7.50 B
Market Opportunity
9.9%
CAGR 2025 - 2030
37.9%
Europe Growth
$8.11 B
Organic still wine segment 2024

Organic Wine Market Size 2026-2030

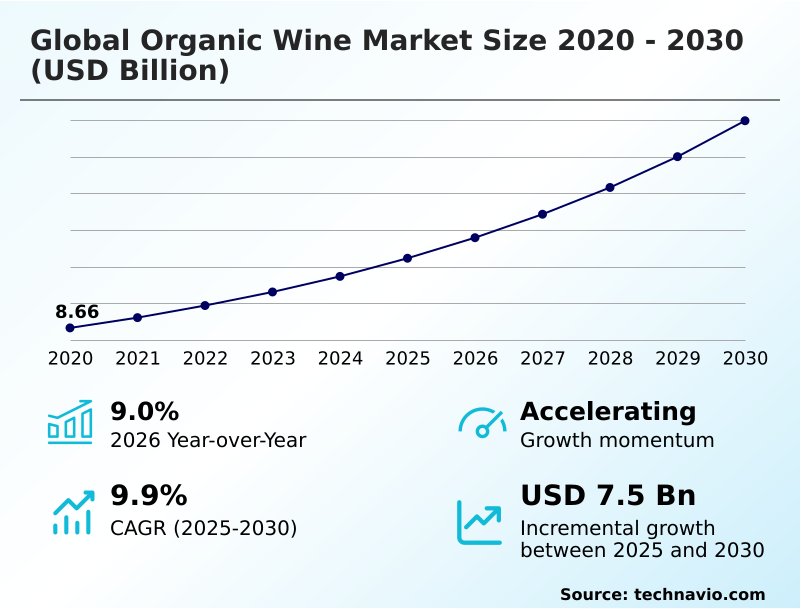
The Organic Wine Market size was valued at USD 12.46 billion in 2025, growing at a CAGR of 9.9% during the forecast period 2026-2030.

Major Market Trends & Insights

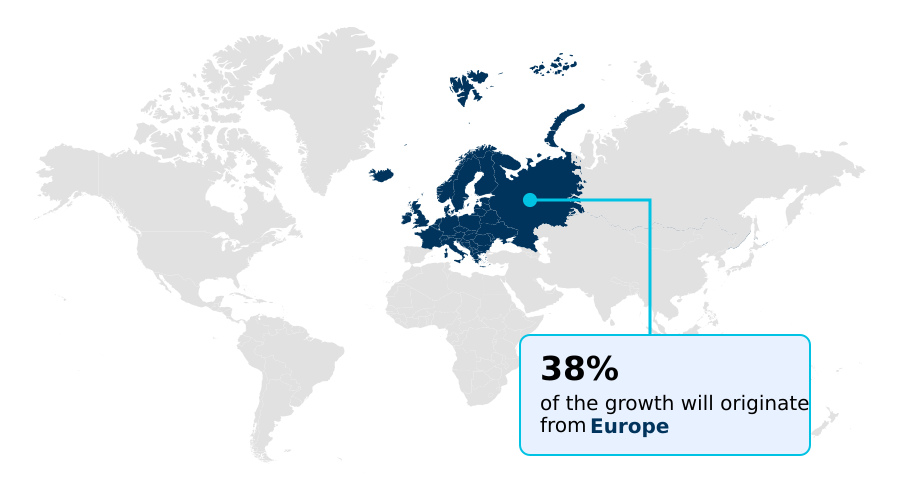
  • Europe dominated the market and accounted for a 37.9% growth during the forecast period.
  • By Product - Organic still wine segment was valued at USD 8.11 billion in 2024
  • By Distribution Channel - Offline segment accounted for the largest market revenue share in 2024

Market Size & Forecast

  • Historic Market Opportunities 2020-2024: USD 11.30 billion
  • Market Future Opportunities 2025-2030: USD 7.50 billion
  • CAGR from 2025 to 2030 : 9.9%

Market Summary

  • The organic wine market is expanding steadily, with an annual growth rate consistently above 8%, as consumer demand for sustainably sourced products reshapes the beverage industry. Europe currently accounts for over 36% of the market, closely followed by North America, reflecting strong consumer health awareness in developed economies.
  • A key driver is the rising preference for natural beverages, which promotes clean labels and supply chain transparency. For example, a mid-sized winery implementing chemical-free farming and biodynamic farming can leverage digital storytelling to connect with consumers, justifying a 15% price premium over conventional counterparts.
  • However, growth is constrained by significant challenges, including high production costs and limited organic grape supply, which can narrow profit margins and slow the pace of vineyard conversion. The adoption of sustainable viticulture is therefore crucial for long-term success.

What will be the Size of the Organic Wine Market during the forecast period?

Get Key Insights on Market Forecast (PDF) Request Free Sample

How is the Organic Wine Market Segmented?

The organic wine industry research report provides comprehensive data (region-wise segment analysis), with forecasts and analysis for the period 2026-2030, as well as historical data from 2020-2024 for the following segments.

  • Product
    • Organic still wine
    • Organic sparkling wine
  • Distribution channel
    • Offline
    • Online
  • Product type
    • Red organic wine
    • White organic wine
  • Geography
    • Europe
      • Germany
      • UK
      • France
    • North America
      • US
      • Canada
      • Mexico
    • APAC
      • China
      • Japan
      • India
    • South America
      • Brazil
      • Argentina
    • Middle East and Africa
      • Saudi Arabia
      • UAE
      • South Africa
    • Rest of World (ROW)

How is the Organic Wine Market Segmented by Product?

The organic still wine segment is estimated to witness significant growth during the forecast period.

The organic still wine segment, which accounts for over 70% of total revenue, dominates the market due to strong consumer preference for traditional varietals that offer clear terroir expression.

This segment's growth is outpacing organic sparkling wine by a ratio of more than 2-to-1, driven by perceived health benefits and alignment with the farm-to-table movement.

While the offline channel remains the primary sales route, online distribution channels saw a 15% higher growth rate for organic still wines, fueled by digital storytelling and demand for supply chain transparency.

Producers are also leveraging eco-friendly packaging to appeal to an eco-conscious consumerism base, with these initiatives improving brand authenticity.

Request Free Sample

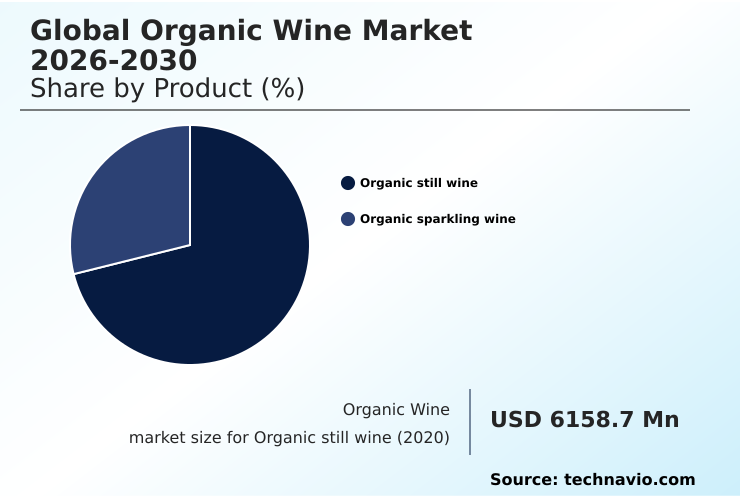
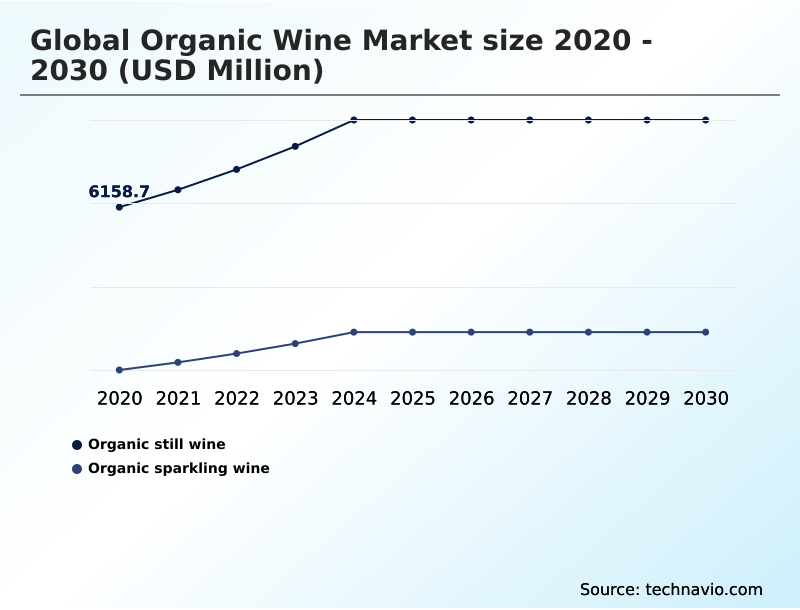
The Organic still wine segment was valued at USD 8.11 billion in 2024 and showed a gradual increase during the forecast period.

Request Free Sample

How demand for the Organic Wine market is rising in the leading region?

Europe is estimated to contribute 37.9% to the growth of the global market during the forecast period.Technavio’s analysts have elaborately explained the regional trends and drivers that shape the market during the forecast period.

See How Organic Wine Market demand is rising in Europe Request Free Sample

Europe leads the global organic wine market, commanding 37.9% of the growth opportunity, slightly ahead of North America's 34%. This is driven by stringent food safety regulations and deep-rooted consumer health awareness.

Within Europe, Germany leads with a market size over 1.5 times that of France, due to strong retail support and a mature consumer base.

In contrast, the North American market, dominated by the US with a market nearly three times the size of Canada's, is driven by a strong premiumization trend and the expansion of direct-to-consumer sales channels.

Regional strategies differ significantly; European producers often focus on terroir expression and traditional viticulture practices, whereas North American wineries increasingly invest in climate-resilient viticulture and innovative eco-friendly packaging to attract a younger demographic.

What are the key Drivers, Trends, and Challenges in the Organic Wine Market?

Our researchers analyzed the data with 2025 as the base year, along with the key drivers, trends, and challenges. A holistic analysis of drivers will help companies refine their marketing strategies to gain a competitive advantage.

  • Consumers increasingly seek answers to specific questions, such as the benefits of organic red wine vs conventional, to make informed purchasing decisions. Research indicates that certain organic red wines can contain up to 30% more health-beneficial polyphenols due to vineyard practices that stress the grapevines naturally.
  • For those with sensitivities, the search for the best organic wine without added sulfites has become a key purchasing driver, pushing producers toward minimal intervention winemaking. Similarly, discerning buyers want to know how to find high-quality biodynamic wines, a segment that commands a 10-15% price premium over standard organic offerings due to its holistic farming principles and strict certification.
  • These consumer trends are unfolding against a backdrop of significant industry challenges. The impact of climate change on organic vineyards is a critical concern, forcing growers to adopt regenerative agriculture and water-efficient irrigation to ensure long-term viability.
  • A thorough organic wine production cost analysis reveals that while expenses for labor and certification are higher, reduced spending on synthetic inputs and the potential for premium pricing can offset these costs, making sustainable viticulture a financially viable model for producers committed to brand authenticity and eco-conscious consumerism.

What are the key market drivers leading to the rise in the adoption of Organic Wine Industry?

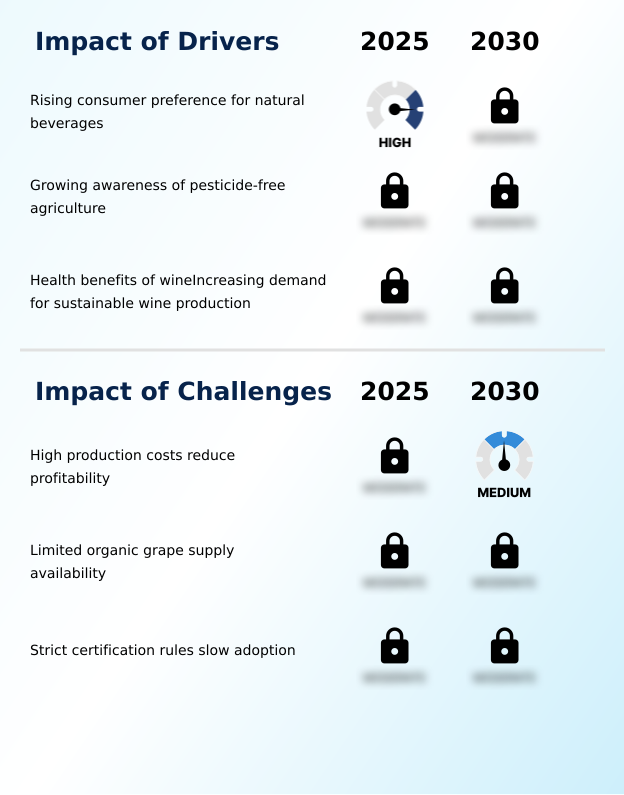
  • The rising consumer preference for natural and clean label beverages stands as a primary driver for the organic wine market's growth.

  • Rising consumer preference for natural and clean label beverages is a foundational driver, with over 60% of younger consumers willing to pay a 15% premium for products aligned with their wellness values.
  • This demand is reinforced by a growing awareness of the benefits of pesticide-free cultivation, which directly supports the principles of sustainable viticulture and agricultural sustainability.
  • Consumers are increasingly educated about the link between chemical-free farming and personal health, leading them to actively seek out organic certifications as a proxy for safety and quality.
  • This shift in purchasing criteria compels producers to adopt more transparent and environmentally responsible practices.

What are the market trends shaping the Organic Wine Industry?

  • The increasing distribution of organic wines through duty-free retail stores is an emerging trend. This is driven by global travelers' growing preference for premium, sustainable alcohol offerings.

  • The expansion of online distribution channels is fundamentally reshaping market access, enabling small producers to achieve brand authenticity with direct-to-consumer sales models that bypass traditional retail gatekeepers. This digital shift has contributed to a 25% increase in market reach for some boutique wineries.
  • Concurrently, the increasing prominence of private label development by major retailers is a significant trend; these brands now account for over 10% of organic wine sales in supermarkets and are growing 5% faster than their branded counterparts. This is fueled by improving consumer trust metrics in store brands and affordability.
  • A third trend is the strategic placement within duty-free retail expansion, positioning organic wine as a premium, sustainable gift and travel purchase.

What challenges does the Organic Wine Industry face during its growth?

  • High production costs associated with chemical-free farming and stringent certification rules present a key challenge to profitability and wider market adoption.

  • High production costs remain the most significant challenge, reducing profitability and slowing market expansion. Organic viticulture, which mandates chemical-free farming, often results in yields that are up to 20% lower than conventional methods and increases labor costs significantly. Compounding this issue is the limited organic grape supply, creating production bottlenecks and price volatility.
  • Furthermore, navigating the complex and strict certification rules presents a substantial barrier, with compliance and audit expenses adding an average of 5% to a winery's annual overhead. These financial pressures make it difficult for smaller producers to transition to organic practices.

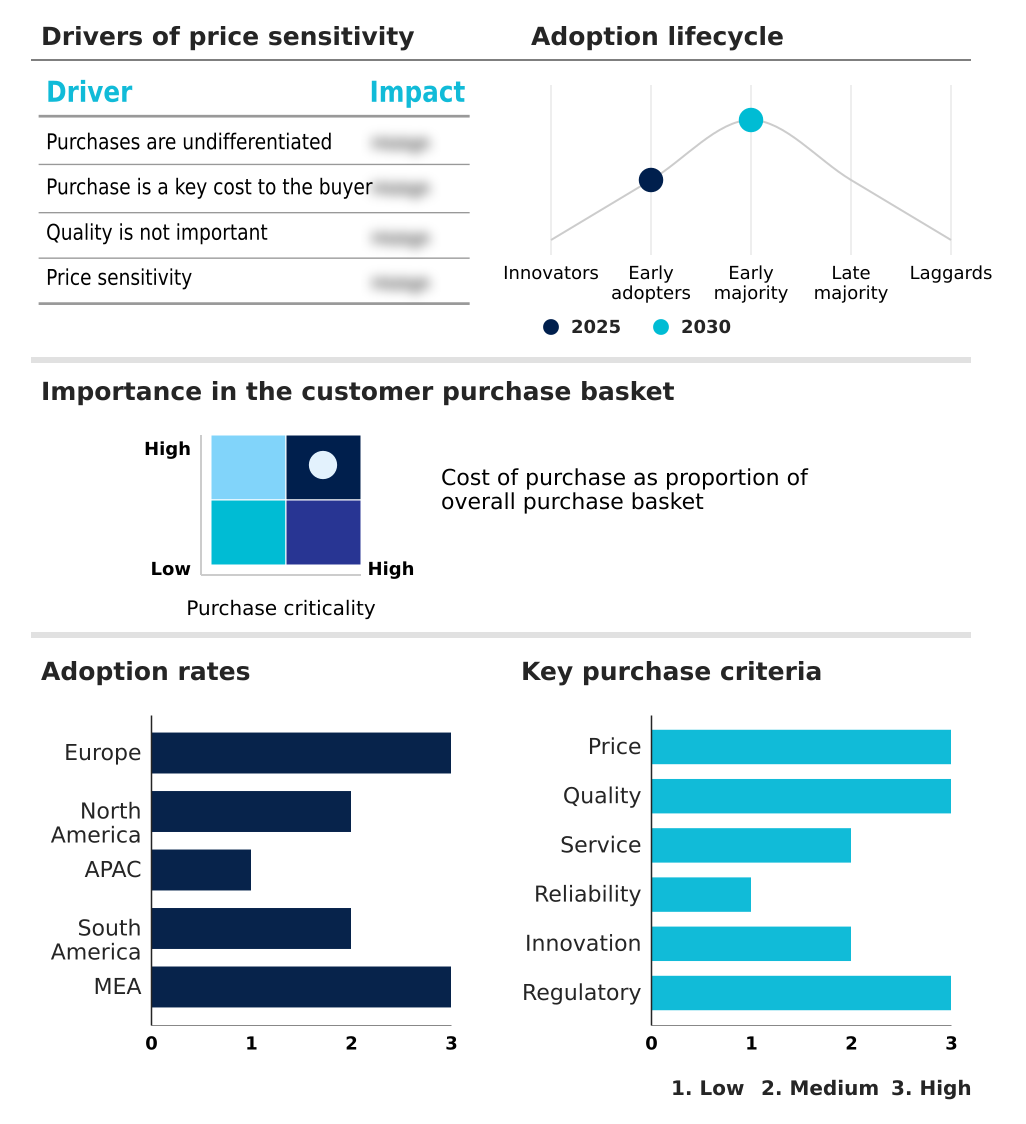
Exclusive Technavio Analysis on Customer Landscape

The organic wine market forecasting report includes the adoption lifecycle of the market, covering from the innovator’s stage to the laggard’s stage. It focuses on adoption rates in different regions based on penetration. Furthermore, the organic wine market report also includes key purchase criteria and drivers of price sensitivity to help companies evaluate and develop their market growth analysis strategies.

Customer Landscape of Organic Wine Industry

Competitive Landscape

Companies are implementing various strategies, such as strategic alliances, organic wine market forecast, partnerships, mergers and acquisitions, geographical expansion, and product/service launches, to enhance their presence in the industry.

Avondale - Production focuses on handcrafted, premium-quality organic wines, emphasizing unique varietal expressions derived from sustainable viticulture and biodynamic farming principles.

The industry research and growth report includes detailed analyses of the competitive landscape of the market and information about key companies, including:

  • Avondale
  • Banfi Vintners
  • Boisset Family Estates
  • Bonterra Organic Vineyards
  • Boutinot Ltd.
  • Bronco Wine Co.
  • Casella Wines Pty Ltd.
  • Charlie and Echo
  • Emiliana Organic Vineyards
  • Frey Vineyards
  • Grands Vignobles En Mediterranee SARL
  • Grgich Hills Estate
  • Harris Organic Wines
  • Jackson Family Wines Inc.
  • King Estate Winery
  • Organic Wine Pty Ltd.
  • Radford Dale Pty Ltd.
  • The Organic Wine Co.
  • Vintage Roots Ltd.
  • Winc

Qualitative and quantitative analysis of companies has been conducted to help clients understand the wider business environment as well as the strengths and weaknesses of key industry players. Data is qualitatively analyzed to categorize companies as pure play, category-focused, industry-focused, and diversified; it is quantitatively analyzed to categorize companies as dominant, leading, strong, tentative, and weak.

Market Intelligence Radar: High-Impact Developments & Growth Signals

  • In the Brewers industry, the significant increase in craft beer production, driven by microbreweries introducing innovative flavors, has created a consumer expectation for artisanal quality and variety, directly bolstering demand for small-batch and terroir-driven organic wine.
  • The rapid shift in alcohol consumption patterns toward premium and super-premium beer, which is up by over 10% in some demographics, has primed consumers to accept higher price points for high-quality alcoholic beverages, benefiting the premiumization trend in the organic wine market.
  • Growing consumer demand for gluten-free and low-calorie alcoholic beverages has established a strong health and wellness precedent, creating a direct tailwind for organic wine, which is perceived as a cleaner, more natural alternative that enhances consumer health awareness.
  • The expansion of online sales channels for alcoholic beverages, which has improved consumer access to a wider variety of products, has enabled small and medium-sized organic wineries to bypass traditional retail gatekeepers and build direct-to-consumer sales models.

Dive into Technavio’s robust research methodology, blending expert interviews, extensive data synthesis, and validated models for unparalleled Organic Wine Market insights. See full methodology.

Market Scope
Page number 283
Base year 2025
Historic period 2020-2024
Forecast period 2026-2030
Growth momentum & CAGR Accelerate at a CAGR of 9.9%
Market growth 2026-2030 USD 7503.2 million
Market structure Fragmented
YoY growth 2025-2026(%) 9.0%
Key countries Germany, UK, France, Italy, Spain, The Netherlands, US, Canada, Mexico, China, Japan, India, South Korea, Australia, Indonesia, Brazil, Argentina, Chile, Saudi Arabia, UAE, South Africa, Israel and Turkey
Competitive landscape Leading Companies, Market Positioning of Companies, Competitive Strategies, and Industry Risks

Request Free Sample

Research Analyst Overview

  • The organic wine market ecosystem is a complex interplay of stakeholders, beginning with growers who adhere to strict organic certification standards for viticulture practices, which increases production costs by an average of 15% compared to conventional methods. Wineries and producers transform these grapes, focusing on minimal intervention winemaking to preserve terroir expression.
  • Distribution is bifurcated; while the offline channel of retailers and restaurants still accounts for over 85% of sales volume, online distribution channels and direct-to-consumer sales models are growing 20% faster, driven by consumer demand for supply chain transparency and digital storytelling.
  • Regulatory bodies enforce labeling laws, while end-consumers, increasingly focused on sustainability and holistic wellness, drive demand, creating a feedback loop that pressures the entire value chain toward greater environmental and social responsibility.

What are the Key Data Covered in this Organic Wine Market Research and Growth Report?

  • What is the expected growth of the Organic Wine Market between 2026 and 2030?

    • The Organic Wine Market is expected to grow by USD 7.50 billion during 2026-2030, registering a CAGR of 9.9%. Year-over-year growth in 2026 is estimated at 9.0%%. This acceleration is shaped by rising consumer preference for natural beverages, which is intensifying demand across multiple end-use verticals covered in the report.

  • What segmentation does the market report cover?

    • The report is segmented by Product (Organic still wine, and Organic sparkling wine), Distribution Channel (Offline, and Online), Product Type (Red organic wine, and White organic wine) and Geography (Europe, North America, APAC, South America, Middle East and Africa). Among these, the Organic still wine segment is estimated to witness significant growth during the forecast period, driven by rising adoption across key application areas. Each segment includes detailed qualitative and quantitative analysis, along with historical data from 2020-2024 and forecasts through 2030 with year-over-year growth rates.

  • Which regions are analyzed in the report?

    • The report covers Europe, North America, APAC, South America and Middle East and Africa. Europe is estimated to contribute 37.9% to market growth during the forecast period. Country-level analysis includes Germany, UK, France, Italy, Spain, The Netherlands, US, Canada, Mexico, China, Japan, India, South Korea, Australia, Indonesia, Brazil, Argentina, Chile, Saudi Arabia, UAE, South Africa, Israel and Turkey, with dedicated market size tables and year-over-year growth for each.

  • What are the key growth drivers and market challenges?

    • The primary driver is rising consumer preference for natural beverages, which is accelerating investment and industry demand. The main challenge is high production costs reduce profitability, creating operational barriers for key market participants. The report quantifies the impact of each driver and challenge across 2026 and 2030 with comparative analysis.

  • Who are the major players in the Organic Wine Market?

    • Key vendors include Avondale, Banfi Vintners, Boisset Family Estates, Bonterra Organic Vineyards, Boutinot Ltd., Bronco Wine Co., Casella Wines Pty Ltd., Charlie and Echo, Emiliana Organic Vineyards, Frey Vineyards, Grands Vignobles En Mediterranee SARL, Grgich Hills Estate, Harris Organic Wines, Jackson Family Wines Inc., King Estate Winery, Organic Wine Pty Ltd., Radford Dale Pty Ltd., The Organic Wine Co., Vintage Roots Ltd. and Winc. The report provides qualitative and quantitative analysis categorizing companies as dominant, leading, strong, tentative, and weak based on their market positioning. Company profiles include business segment analysis, SWOT assessment, key offerings, and recent strategic developments.

Market Research Insights

  • The competitive landscape is characterized by strategic consolidation and a focus on sustainability, with large players accounting for nearly 40% of market innovations. Key vendors such as Bronco Wine Co.
  • are expanding their market footprint through acquisitions, while pioneers like Emiliana Organic Vineyards reinforce their leadership through recognized achievements in regenerative agriculture, including advanced composting projects that improve soil health by over 25%. These actions directly address consumer demand for brand authenticity and corporate social responsibility. This focus on sustainable viticulture helps producers differentiate in a crowded market.
  • However, the entire industry faces the challenge of high production costs, compelling companies to optimize vineyard management and supply chain logistics to maintain profitability.

We can help! Our analysts can customize this organic wine market research report to meet your requirements.

Get in touch

1. Executive Summary

1.1 Market overview

Executive Summary - Chart on Market Overview
Executive Summary - Data Table on Market Overview
Executive Summary - Chart on Global Market Characteristics
Executive Summary - Chart on Market by Geography
Executive Summary - Chart on Market Segmentation by Product
Executive Summary - Chart on Market Segmentation by Distribution Channel
Executive Summary - Chart on Market Segmentation by Product Type
Executive Summary - Chart on Incremental Growth
Executive Summary - Data Table on Incremental Growth
Executive Summary - Chart on Company Market Positioning

2. Technavio Analysis

2.1 Analysis of price sensitivity, lifecycle, customer purchase basket, adoption rates, and purchase criteria

2.2 Criticality of inputs and Factors of differentiation

Chart on Overview on criticality of inputs and factors of differentiation

2.3 Factors of disruption

Chart on Overview on factors of disruption

2.4 Impact of drivers and challenges

Chart on Impact of drivers and challenges in 2025 and 2030

3. Market Landscape

3.1 Market ecosystem

Chart on Parent Market
Data Table on - Parent Market

3.2 Market characteristics

Chart on Market characteristics analysis

3.3 Value chain analysis

Chart on Value chain analysis

4. Market Sizing

4.1 Market definition

Data Table on Offerings of companies included in the market definition

4.2 Market segment analysis

Market segments

4.3 Market size 2025

4.4 Market outlook: Forecast for 2025-2030

Chart on Global - Market size and forecast 2025-2030 ($ million)
Data Table on Global - Market size and forecast 2025-2030 ($ million)
Chart on Global Market: Year-over-year growth 2025-2030 (%)
Data Table on Global Market: Year-over-year growth 2025-2030 (%)

5. Historic Market Size

5.1 Global Organic Wine Market 2020 - 2024

Historic Market Size - Data Table on Global Organic Wine Market 2020 - 2024 ($ million)

5.2 Product segment analysis 2020 - 2024

Historic Market Size - Product Segment 2020 - 2024 ($ million)

5.3 Distribution Channel segment analysis 2020 - 2024

Historic Market Size - Distribution Channel Segment 2020 - 2024 ($ million)

5.4 Product Type segment analysis 2020 - 2024

Historic Market Size - Product Type Segment 2020 - 2024 ($ million)

5.5 Geography segment analysis 2020 - 2024

Historic Market Size - Geography Segment 2020 - 2024 ($ million)

5.6 Country segment analysis 2020 - 2024

Historic Market Size - Country Segment 2020 - 2024 ($ million)

6. Qualitative Analysis

6.1 The AI impact on Global Organic Wine Market

6.2 Impact of Geopolitical Conflicts on Global Organic Wine Market

7. Five Forces Analysis

7.1 Five forces summary

Five forces analysis - Comparison between 2025 and 2030

7.2 Bargaining power of buyers

Bargaining power of buyers - Impact of key factors 2025 and 2030

7.3 Bargaining power of suppliers

Bargaining power of suppliers - Impact of key factors in 2025 and 2030

7.4 Threat of new entrants

Threat of new entrants - Impact of key factors in 2025 and 2030

7.5 Threat of substitutes

Threat of substitutes - Impact of key factors in 2025 and 2030

7.6 Threat of rivalry

Threat of rivalry - Impact of key factors in 2025 and 2030

7.7 Market condition

Chart on Market condition - Five forces 2025 and 2030

8. Market Segmentation by Product

8.1 Market segments

Chart on Product - Market share 2025-2030 (%)
Data Table on Product - Market share 2025-2030 (%)

8.2 Comparison by Product

Chart on Comparison by Product
Data Table on Comparison by Product

8.3 Organic still wine - Market size and forecast 2025-2030

Chart on Organic still wine - Market size and forecast 2025-2030 ($ million)
Data Table on Organic still wine - Market size and forecast 2025-2030 ($ million)
Chart on Organic still wine - Year-over-year growth 2025-2030 (%)
Data Table on Organic still wine - Year-over-year growth 2025-2030 (%)

8.4 Organic sparkling wine - Market size and forecast 2025-2030

Chart on Organic sparkling wine - Market size and forecast 2025-2030 ($ million)
Data Table on Organic sparkling wine - Market size and forecast 2025-2030 ($ million)
Chart on Organic sparkling wine - Year-over-year growth 2025-2030 (%)
Data Table on Organic sparkling wine - Year-over-year growth 2025-2030 (%)

8.5 Market opportunity by Product

Market opportunity by Product ($ million)
Data Table on Market opportunity by Product ($ million)

9. Market Segmentation by Distribution Channel

9.1 Market segments

Chart on Distribution Channel - Market share 2025-2030 (%)
Data Table on Distribution Channel - Market share 2025-2030 (%)

9.2 Comparison by Distribution Channel

Chart on Comparison by Distribution Channel
Data Table on Comparison by Distribution Channel

9.3 Offline - Market size and forecast 2025-2030

Chart on Offline - Market size and forecast 2025-2030 ($ million)
Data Table on Offline - Market size and forecast 2025-2030 ($ million)
Chart on Offline - Year-over-year growth 2025-2030 (%)
Data Table on Offline - Year-over-year growth 2025-2030 (%)

9.4 Online - Market size and forecast 2025-2030

Chart on Online - Market size and forecast 2025-2030 ($ million)
Data Table on Online - Market size and forecast 2025-2030 ($ million)
Chart on Online - Year-over-year growth 2025-2030 (%)
Data Table on Online - Year-over-year growth 2025-2030 (%)

9.5 Market opportunity by Distribution Channel

Market opportunity by Distribution Channel ($ million)
Data Table on Market opportunity by Distribution Channel ($ million)

10. Market Segmentation by Product Type

10.1 Market segments

Chart on Product Type - Market share 2025-2030 (%)
Data Table on Product Type - Market share 2025-2030 (%)

10.2 Comparison by Product Type

Chart on Comparison by Product Type
Data Table on Comparison by Product Type

10.3 Red organic wine - Market size and forecast 2025-2030

Chart on Red organic wine - Market size and forecast 2025-2030 ($ million)
Data Table on Red organic wine - Market size and forecast 2025-2030 ($ million)
Chart on Red organic wine - Year-over-year growth 2025-2030 (%)
Data Table on Red organic wine - Year-over-year growth 2025-2030 (%)

10.4 White organic wine - Market size and forecast 2025-2030

Chart on White organic wine - Market size and forecast 2025-2030 ($ million)
Data Table on White organic wine - Market size and forecast 2025-2030 ($ million)
Chart on White organic wine - Year-over-year growth 2025-2030 (%)
Data Table on White organic wine - Year-over-year growth 2025-2030 (%)

10.5 Market opportunity by Product Type

Market opportunity by Product Type ($ million)
Data Table on Market opportunity by Product Type ($ million)

11. Customer Landscape

11.1 Customer landscape overview

Analysis of price sensitivity, lifecycle, customer purchase basket, adoption rates, and purchase criteria

12. Geographic Landscape

12.1 Geographic segmentation

Chart on Market share by geography 2025-2030 (%)
Data Table on Market share by geography 2025-2030 (%)

12.2 Geographic comparison

Chart on Geographic comparison
Data Table on Geographic comparison

12.3 Europe - Market size and forecast 2025-2030

Chart on Europe - Market size and forecast 2025-2030 ($ million)
Data Table on Europe - Market size and forecast 2025-2030 ($ million)
Chart on Europe - Year-over-year growth 2025-2030 (%)
Data Table on Europe - Year-over-year growth 2025-2030 (%)
Chart on Regional Comparison - Europe
Data Table on Regional Comparison - Europe

12.3.1 Germany - Market size and forecast 2025-2030

Chart on Germany - Market size and forecast 2025-2030 ($ million)
Data Table on Germany - Market size and forecast 2025-2030 ($ million)
Chart on Germany - Year-over-year growth 2025-2030 (%)
Data Table on Germany - Year-over-year growth 2025-2030 (%)

12.3.2 UK - Market size and forecast 2025-2030

Chart on UK - Market size and forecast 2025-2030 ($ million)
Data Table on UK - Market size and forecast 2025-2030 ($ million)
Chart on UK - Year-over-year growth 2025-2030 (%)
Data Table on UK - Year-over-year growth 2025-2030 (%)

12.3.3 France - Market size and forecast 2025-2030

Chart on France - Market size and forecast 2025-2030 ($ million)
Data Table on France - Market size and forecast 2025-2030 ($ million)
Chart on France - Year-over-year growth 2025-2030 (%)
Data Table on France - Year-over-year growth 2025-2030 (%)

12.3.4 Italy - Market size and forecast 2025-2030

Chart on Italy - Market size and forecast 2025-2030 ($ million)
Data Table on Italy - Market size and forecast 2025-2030 ($ million)
Chart on Italy - Year-over-year growth 2025-2030 (%)
Data Table on Italy - Year-over-year growth 2025-2030 (%)

12.3.5 Spain - Market size and forecast 2025-2030

Chart on Spain - Market size and forecast 2025-2030 ($ million)
Data Table on Spain - Market size and forecast 2025-2030 ($ million)
Chart on Spain - Year-over-year growth 2025-2030 (%)
Data Table on Spain - Year-over-year growth 2025-2030 (%)

12.3.6 The Netherlands - Market size and forecast 2025-2030

Chart on The Netherlands - Market size and forecast 2025-2030 ($ million)
Data Table on The Netherlands - Market size and forecast 2025-2030 ($ million)
Chart on The Netherlands - Year-over-year growth 2025-2030 (%)
Data Table on The Netherlands - Year-over-year growth 2025-2030 (%)

12.4 North America - Market size and forecast 2025-2030

Chart on North America - Market size and forecast 2025-2030 ($ million)
Data Table on North America - Market size and forecast 2025-2030 ($ million)
Chart on North America - Year-over-year growth 2025-2030 (%)
Data Table on North America - Year-over-year growth 2025-2030 (%)
Chart on Regional Comparison - North America
Data Table on Regional Comparison - North America

12.4.1 US - Market size and forecast 2025-2030

Chart on US - Market size and forecast 2025-2030 ($ million)
Data Table on US - Market size and forecast 2025-2030 ($ million)
Chart on US - Year-over-year growth 2025-2030 (%)
Data Table on US - Year-over-year growth 2025-2030 (%)

12.4.2 Canada - Market size and forecast 2025-2030

Chart on Canada - Market size and forecast 2025-2030 ($ million)
Data Table on Canada - Market size and forecast 2025-2030 ($ million)
Chart on Canada - Year-over-year growth 2025-2030 (%)
Data Table on Canada - Year-over-year growth 2025-2030 (%)

12.4.3 Mexico - Market size and forecast 2025-2030

Chart on Mexico - Market size and forecast 2025-2030 ($ million)
Data Table on Mexico - Market size and forecast 2025-2030 ($ million)
Chart on Mexico - Year-over-year growth 2025-2030 (%)
Data Table on Mexico - Year-over-year growth 2025-2030 (%)

12.5 APAC - Market size and forecast 2025-2030

Chart on APAC - Market size and forecast 2025-2030 ($ million)
Data Table on APAC - Market size and forecast 2025-2030 ($ million)
Chart on APAC - Year-over-year growth 2025-2030 (%)
Data Table on APAC - Year-over-year growth 2025-2030 (%)
Chart on Regional Comparison - APAC
Data Table on Regional Comparison - APAC

12.5.1 China - Market size and forecast 2025-2030

Chart on China - Market size and forecast 2025-2030 ($ million)
Data Table on China - Market size and forecast 2025-2030 ($ million)
Chart on China - Year-over-year growth 2025-2030 (%)
Data Table on China - Year-over-year growth 2025-2030 (%)

12.5.2 Japan - Market size and forecast 2025-2030

Chart on Japan - Market size and forecast 2025-2030 ($ million)
Data Table on Japan - Market size and forecast 2025-2030 ($ million)
Chart on Japan - Year-over-year growth 2025-2030 (%)
Data Table on Japan - Year-over-year growth 2025-2030 (%)

12.5.3 India - Market size and forecast 2025-2030

Chart on India - Market size and forecast 2025-2030 ($ million)
Data Table on India - Market size and forecast 2025-2030 ($ million)
Chart on India - Year-over-year growth 2025-2030 (%)
Data Table on India - Year-over-year growth 2025-2030 (%)

12.5.4 South Korea - Market size and forecast 2025-2030

Chart on South Korea - Market size and forecast 2025-2030 ($ million)
Data Table on South Korea - Market size and forecast 2025-2030 ($ million)
Chart on South Korea - Year-over-year growth 2025-2030 (%)
Data Table on South Korea - Year-over-year growth 2025-2030 (%)

12.5.5 Australia - Market size and forecast 2025-2030

Chart on Australia - Market size and forecast 2025-2030 ($ million)
Data Table on Australia - Market size and forecast 2025-2030 ($ million)
Chart on Australia - Year-over-year growth 2025-2030 (%)
Data Table on Australia - Year-over-year growth 2025-2030 (%)

12.5.6 Indonesia - Market size and forecast 2025-2030

Chart on Indonesia - Market size and forecast 2025-2030 ($ million)
Data Table on Indonesia - Market size and forecast 2025-2030 ($ million)
Chart on Indonesia - Year-over-year growth 2025-2030 (%)
Data Table on Indonesia - Year-over-year growth 2025-2030 (%)

12.6 South America - Market size and forecast 2025-2030

Chart on South America - Market size and forecast 2025-2030 ($ million)
Data Table on South America - Market size and forecast 2025-2030 ($ million)
Chart on South America - Year-over-year growth 2025-2030 (%)
Data Table on South America - Year-over-year growth 2025-2030 (%)
Chart on Regional Comparison - South America
Data Table on Regional Comparison - South America

12.6.1 Brazil - Market size and forecast 2025-2030

Chart on Brazil - Market size and forecast 2025-2030 ($ million)
Data Table on Brazil - Market size and forecast 2025-2030 ($ million)
Chart on Brazil - Year-over-year growth 2025-2030 (%)
Data Table on Brazil - Year-over-year growth 2025-2030 (%)

12.6.2 Argentina - Market size and forecast 2025-2030

Chart on Argentina - Market size and forecast 2025-2030 ($ million)
Data Table on Argentina - Market size and forecast 2025-2030 ($ million)
Chart on Argentina - Year-over-year growth 2025-2030 (%)
Data Table on Argentina - Year-over-year growth 2025-2030 (%)

12.6.3 Chile - Market size and forecast 2025-2030

Chart on Chile - Market size and forecast 2025-2030 ($ million)
Data Table on Chile - Market size and forecast 2025-2030 ($ million)
Chart on Chile - Year-over-year growth 2025-2030 (%)
Data Table on Chile - Year-over-year growth 2025-2030 (%)

12.7 Middle East and Africa - Market size and forecast 2025-2030

Chart on Middle East and Africa - Market size and forecast 2025-2030 ($ million)
Data Table on Middle East and Africa - Market size and forecast 2025-2030 ($ million)
Chart on Middle East and Africa - Year-over-year growth 2025-2030 (%)
Data Table on Middle East and Africa - Year-over-year growth 2025-2030 (%)
Chart on Regional Comparison - Middle East and Africa
Data Table on Regional Comparison - Middle East and Africa

12.7.1 Saudi Arabia - Market size and forecast 2025-2030

Chart on Saudi Arabia - Market size and forecast 2025-2030 ($ million)
Data Table on Saudi Arabia - Market size and forecast 2025-2030 ($ million)
Chart on Saudi Arabia - Year-over-year growth 2025-2030 (%)
Data Table on Saudi Arabia - Year-over-year growth 2025-2030 (%)

12.7.2 UAE - Market size and forecast 2025-2030

Chart on UAE - Market size and forecast 2025-2030 ($ million)
Data Table on UAE - Market size and forecast 2025-2030 ($ million)
Chart on UAE - Year-over-year growth 2025-2030 (%)
Data Table on UAE - Year-over-year growth 2025-2030 (%)

12.7.3 South Africa - Market size and forecast 2025-2030

Chart on South Africa - Market size and forecast 2025-2030 ($ million)
Data Table on South Africa - Market size and forecast 2025-2030 ($ million)
Chart on South Africa - Year-over-year growth 2025-2030 (%)
Data Table on South Africa - Year-over-year growth 2025-2030 (%)

12.7.4 Israel - Market size and forecast 2025-2030

Chart on Israel - Market size and forecast 2025-2030 ($ million)
Data Table on Israel - Market size and forecast 2025-2030 ($ million)
Chart on Israel - Year-over-year growth 2025-2030 (%)
Data Table on Israel - Year-over-year growth 2025-2030 (%)

12.7.5 Turkey - Market size and forecast 2025-2030

Chart on Turkey - Market size and forecast 2025-2030 ($ million)
Data Table on Turkey - Market size and forecast 2025-2030 ($ million)
Chart on Turkey - Year-over-year growth 2025-2030 (%)
Data Table on Turkey - Year-over-year growth 2025-2030 (%)

12.8 Market opportunity by geography

Market opportunity by geography ($ million)
Data Tables on Market opportunity by geography ($ million)

13. Drivers, Challenges, and Opportunity

13.1 Market drivers

Rising consumer preference for natural beverages
Growing awareness of pesticide‑free agriculture
Health benefits of wineIncreasing demand for sustainable wine production

13.2 Market challenges

High production costs reduce profitability
Limited organic grape supply availability
Strict certification rules slow adoption

13.3 Impact of drivers and challenges

Impact of drivers and challenges in 2025 and 2030

13.4 Market opportunities

Increasing distribution of organic wines through duty-free retail stores
Expansion of online distribution channels
Increasing prominence of private-label brands

14. Competitive Landscape

14.1 Overview

14.2

Overview on criticality of inputs and factors of differentiation

14.3 Landscape disruption

Overview on factors of disruption

14.4 Industry risks

Impact of key risks on business

15. Competitive Analysis

15.1 Companies profiled

Companies covered

15.2 Company ranking index

15.3 Market positioning of companies

Matrix on companies position and classification

15.4 Avondale

Avondale - Overview
Avondale - Product / Service
Avondale - Key offerings
SWOT

15.5 Banfi Vintners

Banfi Vintners - Overview
Banfi Vintners - Product / Service
Banfi Vintners - Key offerings
SWOT

15.6 Boisset Family Estates

Boisset Family Estates - Overview
Boisset Family Estates - Product / Service
Boisset Family Estates - Key offerings
SWOT

15.7 Bonterra Organic Vineyards

Bonterra Organic Vineyards - Overview
Bonterra Organic Vineyards - Product / Service
Bonterra Organic Vineyards - Key offerings
SWOT

15.8 Boutinot Ltd.

Boutinot Ltd. - Overview
Boutinot Ltd. - Product / Service
Boutinot Ltd. - Key offerings
SWOT

15.9 Bronco Wine Co.

Bronco Wine Co. - Overview
Bronco Wine Co. - Product / Service
Bronco Wine Co. - Key news
Bronco Wine Co. - Key offerings
SWOT

15.10 Casella Wines Pty Ltd.

Casella Wines Pty Ltd. - Overview
Casella Wines Pty Ltd. - Product / Service
Casella Wines Pty Ltd. - Key offerings
SWOT

15.11 Charlie and Echo

Charlie and Echo - Overview
Charlie and Echo - Product / Service
Charlie and Echo - Key offerings
SWOT

15.12 Emiliana Organic Vineyards

Emiliana Organic Vineyards - Overview
Emiliana Organic Vineyards - Product / Service
Emiliana Organic Vineyards - Key offerings
SWOT

15.13 Grands Vignobles En Mediterranee SARL

Grands Vignobles En Mediterranee SARL - Overview
Grands Vignobles En Mediterranee SARL - Product / Service
Grands Vignobles En Mediterranee SARL - Key offerings
SWOT

15.14 Harris Organic Wines

Harris Organic Wines - Overview
Harris Organic Wines - Product / Service
Harris Organic Wines - Key offerings
SWOT

15.15 Jackson Family Wines Inc.

Jackson Family Wines Inc. - Overview
Jackson Family Wines Inc. - Product / Service
Jackson Family Wines Inc. - Key offerings
SWOT

15.16 King Estate Winery

King Estate Winery - Overview
King Estate Winery - Product / Service
King Estate Winery - Key offerings
SWOT

15.17 Organic Wine Pty Ltd.

Organic Wine Pty Ltd. - Overview
Organic Wine Pty Ltd. - Product / Service
Organic Wine Pty Ltd. - Key offerings
SWOT

15.18 The Organic Wine Co.

The Organic Wine Co. - Overview
The Organic Wine Co. - Product / Service
The Organic Wine Co. - Key offerings
SWOT

16. Appendix

16.1 Scope of the report

Market definition
Objectives
Notes and caveats

16.2 Inclusions and exclusions checklist

Inclusions checklist
Exclusions checklist

16.3 Currency conversion rates for US$

16.4 Research methodology

16.5 Data procurement

Information sources

16.6 Data validation

16.7 Validation techniques employed for market sizing

16.8 Data synthesis

16.9 360 degree market analysis

16.10 List of abbreviations

Research Methodology

Technavio presents a detailed picture of the market by way of study, synthesis, and summation of data from multiple sources. The analysts have presented the various facets of the market with a particular focus on identifying the key industry influencers. The data thus presented is comprehensive, reliable, and the result of extensive research, both primary and secondary.

INFORMATION SOURCES

Primary sources

  • Manufacturers and suppliers
  • Channel partners
  • Industry experts
  • Strategic decision makers

Secondary sources

  • Industry journals and periodicals
  • Government data
  • Financial reports of key industry players
  • Historical data
  • Press releases

DATA ANALYSIS

Data Synthesis

  • Collation of data
  • Estimation of key figures
  • Analysis of derived insights

Data Validation

  • Triangulation with data models
  • Reference against proprietary databases
  • Corroboration with industry experts

REPORT WRITING

Qualitative

  • Market drivers
  • Market challenges
  • Market trends
  • Five forces analysis

Quantitative

  • Market size and forecast
  • Market segmentation
  • Geographical insights
  • Competitive landscape

Interested in this report?

Get your sample now to see our research methodology and insights!

Download Now

Frequently Asked Questions

Organic Wine market growth will increase by USD 7503.2 million during 2026-2030.

The Organic Wine market is expected to grow at a CAGR of 9.9% during 2026-2030.

Organic Wine market is segmented by Product (Organic still wine, Organic sparkling wine) Distribution channel (Offline, Online) Product type (Red organic wine, White organic wine)

Avondale, Banfi Vintners, Boisset Family Estates, Bonterra Organic Vineyards, Boutinot Ltd., Bronco Wine Co., Casella Wines Pty Ltd., Charlie and Echo, Emiliana Organic Vineyards, Frey Vineyards, Grands Vignobles En Mediterranee SARL, Grgich Hills Estate, Harris Organic Wines, Jackson Family Wines Inc., King Estate Winery, Organic Wine Pty Ltd., Radford Dale Pty Ltd., The Organic Wine Co., Vintage Roots Ltd., Winc are a few of the key vendors in the Organic Wine market.

Europe will register the highest growth rate of 37.9% among the other regions. Therefore, the Organic Wine market in Europe is expected to garner significant business opportunities for the vendors during the forecast period.

Germany, UK, France, Italy, Spain, The Netherlands, US, Canada, Mexico, China, Japan, India, South Korea, Australia, Indonesia, Brazil, Argentina, Chile, Saudi Arabia, UAE, South Africa, Israel, Turkey

  • Rising consumer preference for natural beverages is the driving factor this market.

The Organic Wine market vendors should focus on grabbing business opportunities from the Product segment as it accounted for the largest market share in the base year.
RIA - Research AI Assistant
Ask RIA