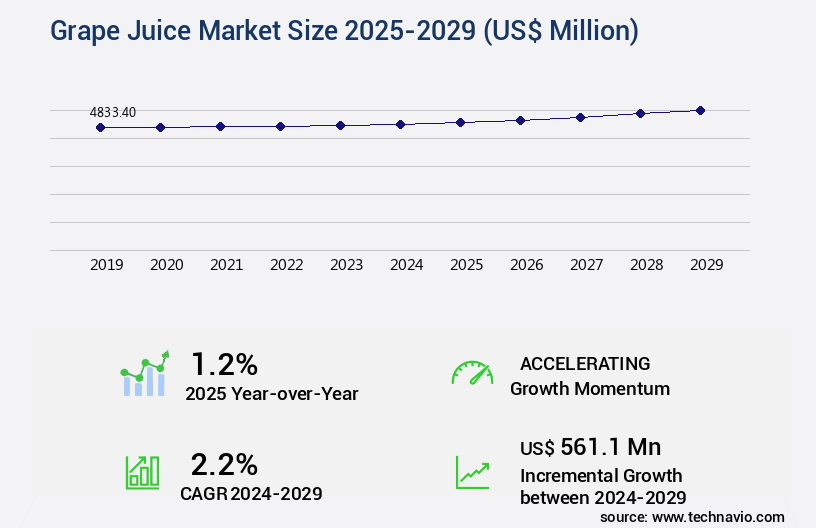
Grape Juice Market Size 2025-2029
The grape juice market size is valued to increase USD 561.1 million, at a CAGR of 2.2% from 2024 to 2029. Growing number of organized retail outlets will drive the grape juice market.
Major Market Trends & Insights
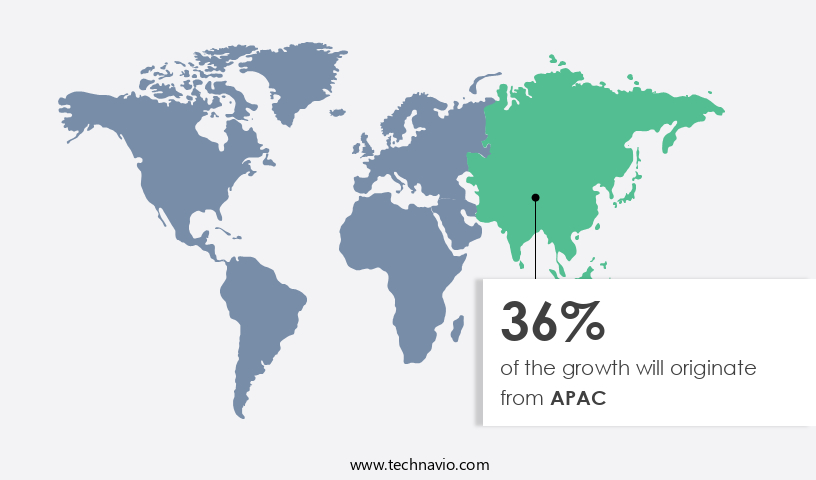
- APAC dominated the market and accounted for a 36% growth during the forecast period.
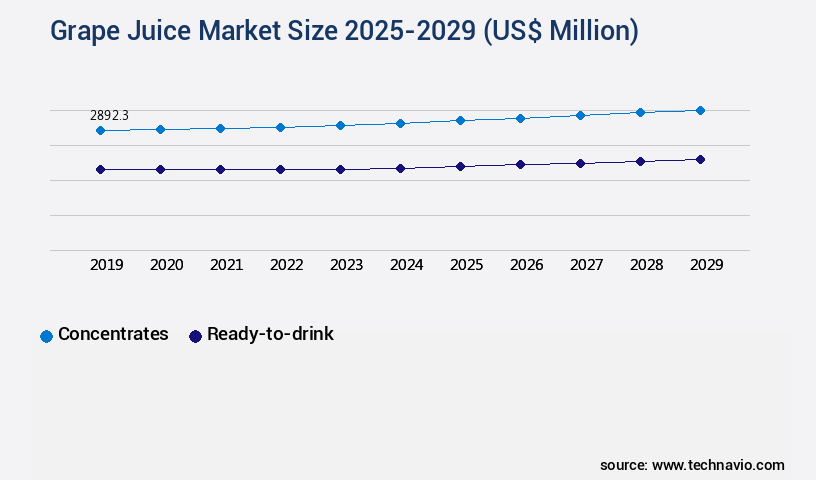
- By Product - Concentrates segment was valued at USD 2892.30 million in 2023
- By Type - Purple segment accounted for the largest market revenue share in 2023
Market Size & Forecast
- Market Opportunities: USD 14.73 million
- Market Future Opportunities: USD 561.10 million
- CAGR from 2024 to 2029 : 2.2%
Market Summary
- The market exhibits a significant expansion, driven by the increasing number of organized retail outlets and the rising consumer preference for healthier beverage options. Farmers are increasingly focusing on organic and non-genetically modified (non-GM) agriculture to cater to this trend. Strict regulations on grape juice manufacturing and packaging ensure product safety and quality, further bolstering market growth.
- This growth can be attributed to the increasing awareness of health benefits associated with organic and natural food and beverage products. The market's future direction lies in innovation, with companies exploring new flavors, fortified variants, and sustainable production methods to cater to evolving consumer demands.
What will be the Size of the Grape Juice Market during the forecast period?
Get Key Insights on Market Forecast (PDF) Request Free Sample
How is the Grape Juice Market Segmented ?
The grape juice industry research report provides comprehensive data (region-wise segment analysis), with forecasts and estimates in "USD million" for the period 2025-2029, as well as historical data from 2019-2023 for the following segments.
- Product
- Concentrates
- Ready-to-drink
- Type
- Purple
- White
- Distribution Channel
- Offline
- Online
- Geography
- North America
- US
- Canada
- Europe
- France
- Germany
- Italy
- UK
- APAC
- Australia
- China
- India
- South America
- Brazil
- Rest of World (ROW)
- North America
By Product Insights
The concentrates segment is estimated to witness significant growth during the forecast period.
The dynamic market is characterized by ongoing advancements in production techniques and quality control measures. Manufacturers are continually refining clarification processes through the application of aeration techniques and HPLC analysis to ensure optimal brix measurement and ph level control. Tartaric acid content and pectin enzyme activity are closely monitored to maintain desired flavor profiles and color stability. The bottling process is optimized using pasteurization methods and UV-vis spectroscopy to prevent oxidation and microbial contamination. Consumer acceptance testing and sensory attribute mapping are essential quality control parameters, with sugar content analysis and titration methods used to ensure accurate product formulation.
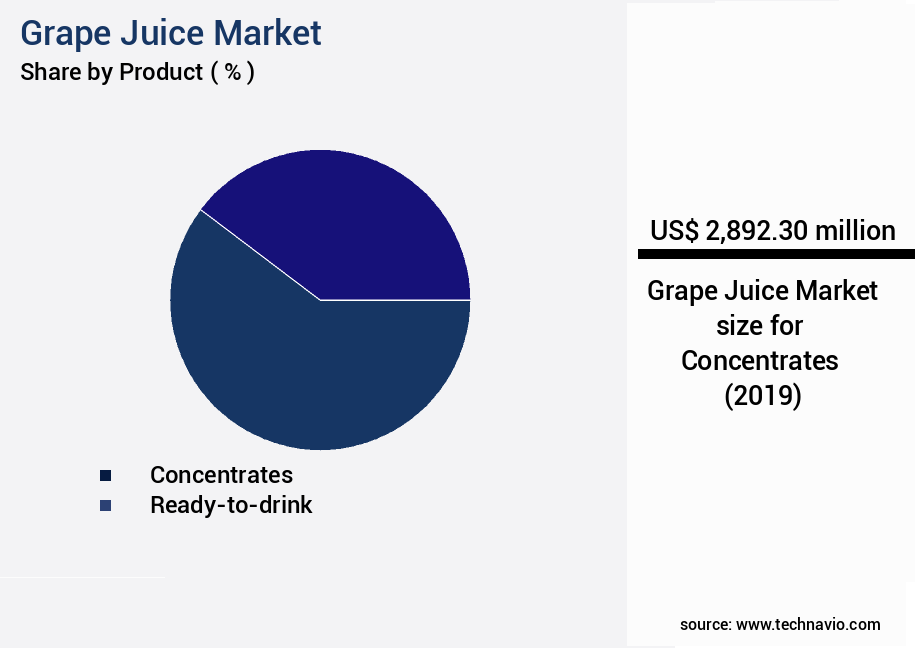
The Concentrates segment was valued at USD 2892.30 million in 2019 and showed a gradual increase during the forecast period.
Processing efficiency is a key focus, with juice extraction methods and filtration techniques continually evolving to maximize grape juice yield. The market's regulatory landscape is stringent, with adherence to quality index calculation and regulatory compliance a priority. Notably, the concentrates segment accounts for a significant market share, with a recent study reporting a 12% increase in demand due to their extended shelf life and versatility in food and beverage applications.
Regional Analysis
APAC is estimated to contribute 36% to the growth of the global market during the forecast period. Technavio's analysts have elaborately explained the regional trends and drivers that shape the market during the forecast period.
See How Grape Juice Market Demand is Rising in APAC Request Free Sample
The North American region dominates the market, accounting for approximately 3.4% of global wine exports by volume in 2024. Key contributing countries include the US, Canada, and Mexico. In the US, California is a leading grape producer, with other significant contributors being the District of Columbia (Washington) and New York. The US grape production has been robust, with North America's market expected to continue its growth trajectory.
The region's grape juice industry benefits from the increasing consumer preference for healthier beverage options and the growing popularity of organic and natural food products.
Market Dynamics
Our researchers analyzed the data with 2024 as the base year, along with the key drivers, trends, and challenges. A holistic analysis of drivers will help companies refine their marketing strategies to gain a competitive advantage.
The market is a significant sector in the beverage industry, with consumers seeking high-quality products that showcase the natural flavors and health benefits of grapes. The production of grape juice involves various processing techniques, each impacting its quality in distinct ways. Processing plays a crucial role in grape juice quality, with factors such as temperature affecting anthocyanin stability. Proper optimization of juice extraction parameters is essential to ensure that desirable sensory attributes and chemical composition correlate. Packaging materials and storage conditions also influence shelf life, while the relationship between acidity and color stability is a critical consideration. Filtration methods are evaluated for their impact on juice clarity, and determining optimal pasteurization parameters is essential for microbial control. Sensory analysis using descriptive analysis is crucial for assessing the sensory properties of grape juice. Different processing techniques can influence flavor compounds, and consumer acceptance of various juice types is evaluated through market research. Key chemical parameters are measured for quality control purposes, and instrumental and sensory methods are used to evaluate juice quality. The optimization of the juice extraction process for improved yield is a continuous focus, while storage conditions and enzyme treatments impact juice quality. Analysis of volatile compounds in grape juice is essential for understanding its flavor profile, and various juice clarification techniques are compared for their effectiveness. Determining the optimal level of sweetness for consumer preference is a critical factor in the market, as is ensuring the implementation of effective microbial control strategies to maintain product quality. Overall, the market demands a deep understanding of the intricacies of grape processing and the application of advanced technologies to produce high-quality, consumer-preferred products.
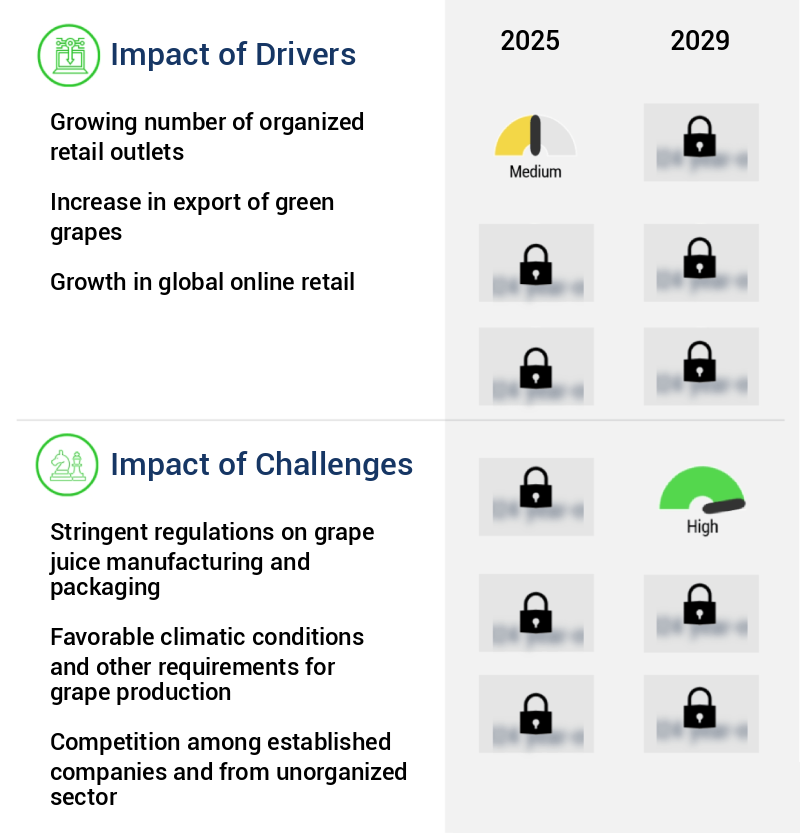
What are the key market drivers leading to the rise in the adoption of Grape Juice Industry?
- The increasing prevalence of well-organized retail outlets serves as the primary catalyst for market growth.
- Organized retailers have experienced significant growth in major markets like the US and India, benefiting companies in the international market. Supermarkets, hypermarkets, convenience stores, and discount stores now dominate the distribution and marketing landscape for grape juice. The expansion of urbanization in regions such as APAC and Latin America has contributed to a rise in the number of organized retailing outlets in these areas. In the US alone, the number of supermarkets and grocery stores increased by 1.5% in 2024, reaching approximately 77,021 establishments.
- Brazil, the UK, Germany, Italy, Spain, China, Canada, France, Australia, and Japan are among the countries with a high concentration of organized retailing, making them significant markets for grape juice.
What are the market trends shaping the Grape Juice Industry?
- The focus of farmers is shifting towards organic and non-Genetically Modified (GM) agriculture, representing an emerging market trend.
- The market is undergoing significant transformations, with various sectors adopting this natural beverage for diverse applications. Genetically modified crops, such as grapes, are increasingly being utilized by farmers to enhance both crop diversity and productivity. While some countries express concerns over the health implications of genetically modified products, they remain an integral part of the manufacturing process for numerous food and beverage items in other regions.
- Conversely, the rising consumer consciousness towards health benefits associated with organic produce is fueling the demand for grape juice derived from organically grown grapes. This dichotomy highlights the evolving nature of the market and its role in catering to the dynamic needs of the food and beverage industry.
What challenges does the Grape Juice Industry face during its growth?
- The stringent regulations governing the manufacturing and packaging processes of grape juice present a significant challenge to the industry's growth. Compliance with these regulations adds complexity and cost to the production process, potentially impacting the competitiveness of grape juice companies in the market.
- Grape juice, a popular beverage enjoyed worldwide, is subject to stringent regulations in various sectors. In the US, the USDA sets guidelines for product description, packaging, type, color, and flavor. For instance, grape juice must be prepared from a specific type of grape, and its packaging must adhere to certain size, material, and innovation requirements. Similarly, the European Union (EU) enforces Council Directive 2001/112/EC, which covers production, composition, and labeling. These regulations ensure the quality and safety of grape juice for human consumption.
- The market, driven by increasing health consciousness and consumer preference for natural beverages, is projected to expand significantly. For example, the EU market is expected to reach a value of around 2 billion liters by 2025, growing at a steady pace. The Asia Pacific region is also witnessing a surge in demand due to changing consumer preferences and growing health awareness.
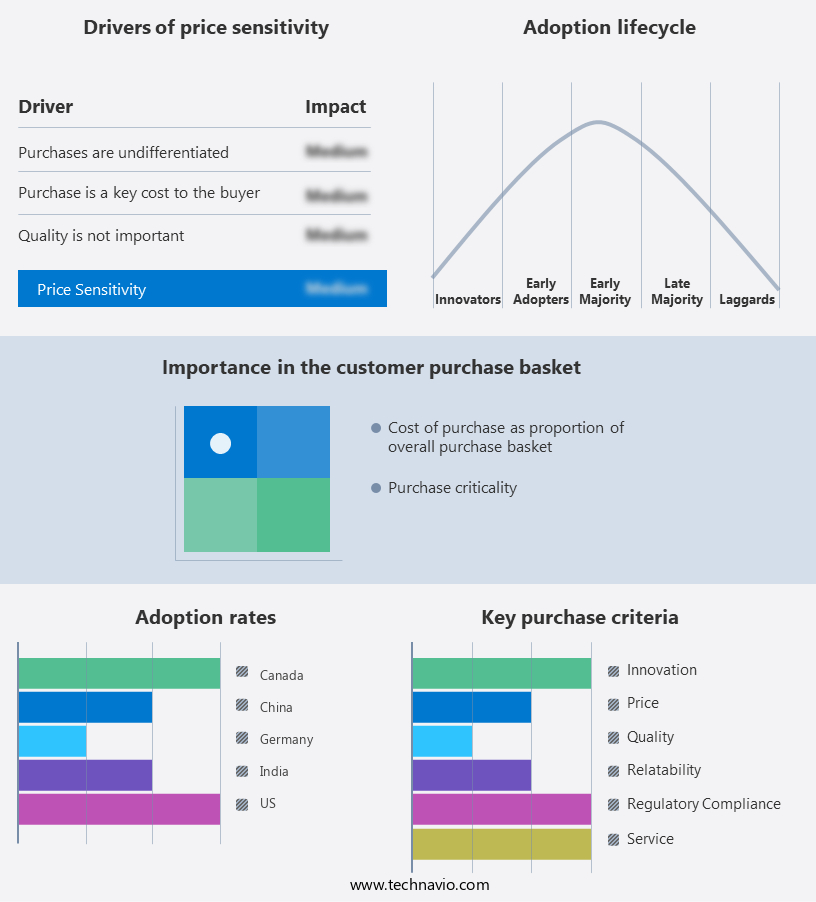
Exclusive Technavio Analysis on Customer Landscape
The grape juice market forecasting report includes the adoption lifecycle of the market, covering from the innovator's stage to the laggard's stage. It focuses on adoption rates in different regions based on penetration. Furthermore, the grape juice market report also includes key purchase criteria and drivers of price sensitivity to help companies evaluate and develop their market growth analysis strategies.
Customer Landscape of Grape Juice Industry
Competitive Landscape
Companies are implementing various strategies, such as strategic alliances, grape juice market forecast, partnerships, mergers and acquisitions, geographical expansion, and product/service launches, to enhance their presence in the industry.
Cantine Brusa 1888 Spa - This company specializes in producing a range of grape juices, including red and white varieties, as well as NFC (not from concentrate) grape juice and cooked must.
The industry research and growth report includes detailed analyses of the competitive landscape of the market and information about key companies, including:
- Cantine Brusa 1888 Spa
- Dabur India Ltd.
- De La Rosa Real Foods and Vineyards
- Eckes Granini Group GmbH
- G Patritti and Co. Ltd.
- Harvest Hill Beverage Co.
- Kayco Co.
- Kineta SA
- Langer Juice Co. Inc.
- Lassonde Industries Inc.
- Milne
- Nestle SA
- Ocean Spray Cranberries Inc.
- Odyssey International Import Export Pty Ltd.
- Paradise Juice Pvt. Ltd.
- PepsiCo Inc.
- Vina Montpellier S.A.
- Voelkel GmbH
- Welch Foods Inc.
Qualitative and quantitative analysis of companies has been conducted to help clients understand the wider business environment as well as the strengths and weaknesses of key industry players. Data is qualitatively analyzed to categorize companies as pure play, category-focused, industry-focused, and diversified; it is quantitatively analyzed to categorize companies as dominant, leading, strong, tentative, and weak.
Recent Development and News in Grape Juice Market
- In January 2024, PepsiCo's Tropicana brand launched a new line of organic grape juices in the US market, expanding its organic product offerings and catering to the growing consumer demand for healthier beverage options (Source: BusinessWire).
- In March 2024, Welch's, a leading grape juice producer, announced a strategic partnership with Amazon Fresh to make its products more readily available to online shoppers in the US, broadening its distribution channels and reaching a larger consumer base (Source: PR Newswire).
- In May 2024, Sun-Maid Growers of California, a major raisin producer, completed the acquisition of Sun-Rype Products, a Canadian fruit juice company, marking its entry into the Canadian market and diversifying its product portfolio (Source: BusinessWire).
- In April 2025, The European Commission approved the merger of two leading grape juice producers, Suntory Beverage & Food Europe and Refresco Gerber, creating a global market leader in fruit juice and concentrates, with an estimated combined market share of 35% (Source: Reuters).
Dive into Technavio's robust research methodology, blending expert interviews, extensive data synthesis, and validated models for unparalleled Grape Juice Market insights. See full methodology.
|
Market Scope |
|
|
Report Coverage |
Details |
|
Page number |
210 |
|
Base year |
2024 |
|
Historic period |
2019-2023 |
|
Forecast period |
2025-2029 |
|
Growth momentum & CAGR |
Accelerate at a CAGR of 2.2% |
|
Market growth 2025-2029 |
USD 561.1 million |
|
Market structure |
Fragmented |
|
YoY growth 2024-2025(%) |
1.2 |
|
Key countries |
US, China, Germany, Brazil, India, UK, Canada, Australia, France, and Italy |
|
Competitive landscape |
Leading Companies, Market Positioning of Companies, Competitive Strategies, and Industry Risks |
Research Analyst Overview
- The market continues to evolve, driven by advancements in production techniques and consumer preferences. Flavor compound analysis and clarification processes play a crucial role in enhancing the sensory experience of consumers. Aeration techniques and HPLC analysis enable winemakers to optimize pH level control, ensuring a desirable tartaric acid content. Filtration techniques, such as microfiltration and reverse osmosis, improve juice clarity and ensure consistent Brix measurement. Grape juice yield is influenced by various factors, including weather conditions and viticulture practices. For instance, a leading winery increased its yield by 10% through optimized irrigation and pruning techniques.
- Quality control parameters, such as acidity measurement techniques and sensory attribute mapping, are essential for maintaining consumer satisfaction and ensuring product consistency. Bottling process optimization and aroma profile determination are critical aspects of the juice production process. Titration methods and pH level control are essential for maintaining the desired balance of sugars and acids. Packaging material selection, color stability studies, and oxidation prevention methods are also crucial for ensuring the longevity and quality of the final product. Processing efficiency and pasteurization methods are essential for maintaining product safety and reducing waste. Malic acid content analysis and anthocyanin concentration studies help winemakers create unique and distinctive juice blends.
- Consumer acceptance testing and sugar content analysis are critical for ensuring product appeal and meeting market demands. Wine grape varieties, such as Cabernet Sauvignon and Merlot, dominate the market. However, emerging trends, such as the use of alternative grape varieties and organic production methods, are gaining popularity among consumers. Ongoing research in areas such as pectin enzyme activity and mass spectrometry is driving innovation and improving the overall quality of grape juice products.
What are the Key Data Covered in this Grape Juice Market Research and Growth Report?
-
What is the expected growth of the Grape Juice Market between 2025 and 2029?
-
USD 561.1 million, at a CAGR of 2.2%
-
-
What segmentation does the market report cover?
-
The report is segmented by Product (Concentrates and Ready-to-drink), Type (Purple and White), Distribution Channel (Offline and Online), and Geography (North America, APAC, Europe, South America, and Middle East and Africa)
-
-
Which regions are analyzed in the report?
-
North America, APAC, Europe, South America, and Middle East and Africa
-
-
What are the key growth drivers and market challenges?
-
Growing number of organized retail outlets, Stringent regulations on grape juice manufacturing and packaging
-
-
Who are the major players in the Grape Juice Market?
-
Cantine Brusa 1888 Spa, Dabur India Ltd., De La Rosa Real Foods and Vineyards, Eckes Granini Group GmbH, G Patritti and Co. Ltd., Harvest Hill Beverage Co., Kayco Co., Kineta SA, Langer Juice Co. Inc., Lassonde Industries Inc., Milne, Nestle SA, Ocean Spray Cranberries Inc., Odyssey International Import Export Pty Ltd., Paradise Juice Pvt. Ltd., PepsiCo Inc., Vina Montpellier S.A., Voelkel GmbH, and Welch Foods Inc.
-
Market Research Insights
- The market for grape juice is a dynamic and continually evolving industry, with ongoing advancements in processing techniques and consumer preferences. Two notable developments include cost reduction strategies and industry growth expectations. For instance, the implementation of energy-efficient equipment and optimization of process flow has led to significant savings in production costs. According to industry reports, this sector is projected to expand by approximately 5% annually in the coming years.
- An illustrative example of market dynamics at play is a leading juice manufacturer achieving a 10% increase in sales through the introduction of a new flavor enhancement technique. This innovation not only appealed to consumers but also contributed to the overall growth of the market.
We can help! Our analysts can customize this grape juice market research report to meet your requirements.
 RIA -
RIA - 
