OSAT Market Analysis APAC, North America, Europe, South America, Middle East and Africa - China, US, Taiwan, South Korea, Germany, Japan, Brazil, UK, France, Canada - Size and Forecast 2025-2029

OSAT Market Analysis APAC, North America, Europe, South America, Middle East and Africa - China, US, Taiwan, South Korea, Germany, Japan, Brazil, UK, France, Canada - Size and Forecast 2025-2029

Published: Jan 2025 192 Pages SKU: IRTNTR77631

Market Overview at a Glance

$28.47 B
Market Opportunity
9.4%
CAGR
7.2
YoY growth 2024-2025(%)

OSAT Market Size 2025-2029

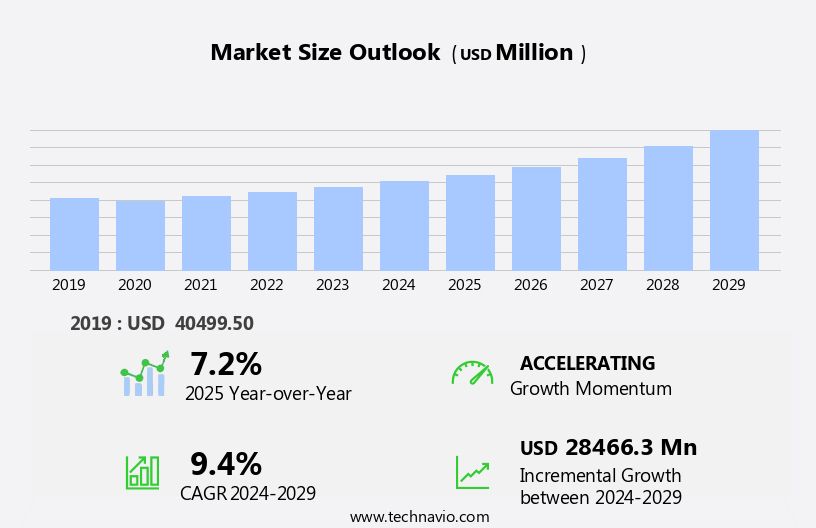
The osat market size is forecast to increase by USD 28.47 billion, at a CAGR of 9.4% between 2024 and 2029.

  • The market is experiencing significant growth, driven by advancements in chip packaging technology. This innovation enables the production of smaller, more efficient semiconductors, meeting the increasing demand for compact and powerful electronic devices. Furthermore, the market is witnessing an escalating trend of strategic partnerships and acquisitions among key players. These collaborations aim to expand market reach, enhance technological capabilities, and strengthen competitive positions. However, the OSAT industry faces a formidable challenge in the form of a semiconductor shortage. This scarcity poses a significant threat to the industry's growth, as it hampers the production capacity of OSATs and, consequently, the manufacturing of electronic devices that rely on these components.
  • Companies must navigate this challenge by exploring alternative semiconductor sources, investing in research and development, and fostering strong relationships with semiconductor manufacturers. By capitalizing on the opportunities presented by technological advancements and strategic collaborations while addressing the semiconductor shortage, OSATs can effectively drive growth and maintain a competitive edge in the market.

What will be the Size of the OSAT Market during the forecast period?

OSAT Market Size

Explore in-depth regional segment analysis with market size data - historical 2019-2023 and forecasts 2025-2029 - in the full report.  
Request Free Sample

The OSAT (Outsourced Semiconductor Assembly and Testing) market is characterized by continuous evolution and dynamic market activities. Seamlessly integrated processes such as test program development, semiconductor testing, system-level test, humidity testing, test escape rate reduction, time to market optimization, reliability testing, quality assurance, test coverage, report generation, parametric testing, data processing, and mixed-signal testing are integral to the OSAT landscape. The supply chain's intricacies necessitate ongoing process optimization, with entities focusing on yield improvement through defect density reduction, failure analysis, test engineering, and test equipment innovation. Environmental testing, including thermal, vibration, shock, and RF testing, plays a crucial role in ensuring product reliability.

Test time reduction and cost reduction are essential priorities, with test data management and equipment qualification crucial for efficient test program execution. The integration of advanced technologies like boundary scan, data acquisition, and root cause analysis further enhances the market's capabilities. The OSAT industry's continuous advancements cater to various sectors, including automotive, telecommunications, consumer electronics, and industrial applications, among others. The focus on cost reduction, product quality, and time to market ensures that OSAT providers remain at the forefront of technological innovation.

How is this OSAT Industry segmented?

The osat industry research report provides comprehensive data (region-wise segment analysis), with forecasts and estimates in "USD million" for the period 2025-2029, as well as historical data from 2019-2023 for the following segments.

  • Service
    • Assembly and packaging
    • Testing
  • End-user
    • Telecommunication
    • Consumer electronics
    • Industrial electronics
    • Automotive
    • Others
  • Geography
    • North America
      • US
      • Canada
    • Europe
      • France
      • Germany
      • UK
    • APAC
      • China
      • Japan
      • South Korea
      • Taiwan
    • South America
      • Brazil
    • Rest of World (ROW)

    By Service Insights

    The assembly and packaging segment is estimated to witness significant growth during the forecast period.

    The semiconductor industry relies heavily on OSAT (Outsourced Semiconductor Assembly and Testing) providers for critical production tasks, such as functional safety testing, logic testing, vibration testing, quality control, and supply chain management. These services are essential for the final stages of semiconductor production, including thermal testing, OSAT testing, IC testing, yield improvement, failure analysis, test engineering, test equipment maintenance, and defect density reduction. OSAT companies invest significantly in research and development to stay competitive in the market. The industry's dynamic nature demands continuous process optimization, leading to advancements in test time reduction, environmental testing, memory testing, yield enhancement, package testing, in-circuit testing, functional testing, product reliability, RF testing, test data management, optical testing, shock testing, test program development, semiconductor testing, system-level testing, humidity testing, test escape rate minimization, time to market acceleration, reliability testing, quality assurance, test coverage, report generation, parametric testing, data processing, mixed-signal testing, equipment qualification, analog testing, data acquisition, cost reduction, defect detection, cost of test minimization, and product quality enhancement.

    The growing demand for advanced electronic gadgets, smartphones, and IoT devices fuels the need for OSAT services. To cater to this demand, OSAT providers must invest in the latest test equipment and technologies, ensuring their clients' products meet the highest standards of performance and reliability.

    OSAT Market Size

    Request Free Sample

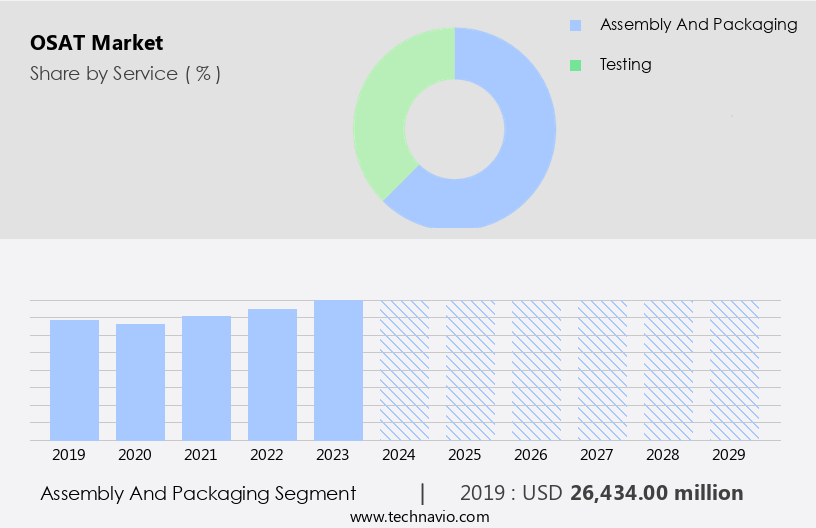
    The Assembly and packaging segment was valued at USD 26.43 billion in 2019 and showed a gradual increase during the forecast period.

    Regional Analysis

    APAC is estimated to contribute 63% to the growth of the global market during the forecast period.Technavio’s analysts have elaborately explained the regional trends and drivers that shape the market during the forecast period.

    OSAT Market Share by Geography

     Request Free Sample

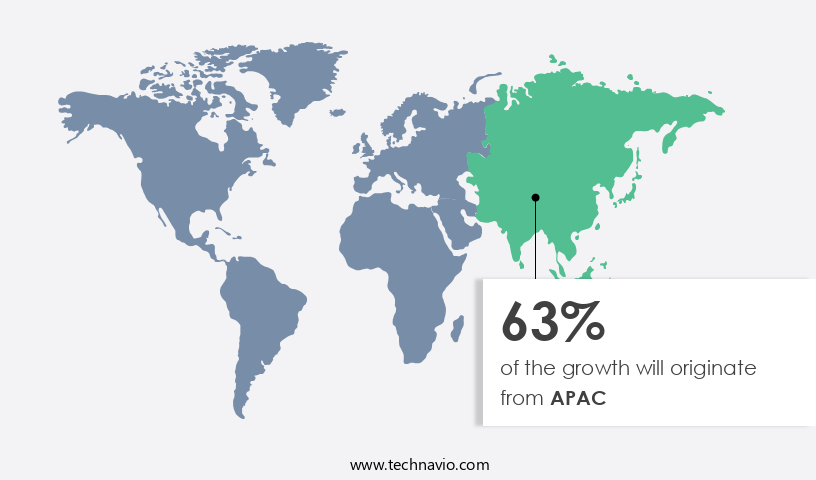
    The market in the APAC region is experiencing significant growth due to the rapid industrialization in developing countries and the increasing demand for semiconductors from various industries, including telecommunications, automotive, and electronics. Key countries, such as Taiwan, South Korea, Japan, and China, are driving market expansion as they host numerous semiconductor device manufacturers, benefiting from their strategic locations and access to affordable labor and raw material sources. The presence of end-user industries, particularly those producing consumer electronics and mobile devices, further fuels the demand for OSAT services in APAC. Functional safety testing, logic testing, and vibration testing are crucial aspects of OSAT services, ensuring the reliability and performance of semiconductor devices.

    Test time reduction, quality control, and supply chain optimization are essential for maintaining cost efficiency and meeting time-to-market demands. Thermal testing, OSAT testing, IC testing, yield improvement, failure analysis, test engineering, and test equipment are integral components of the OSAT process. Environmental testing, memory testing, yield enhancement, package test, in-circuit testing, functional testing, product reliability, RF testing, test data management, optical testing, process optimization, shock testing, test program development, semiconductor testing, system-level test, humidity testing, test escape rate, and reliability testing are all essential services offered by OSAT providers. Cost reduction, defect detection, cost of test, and product quality are primary concerns for OSAT customers.

    Probe card, final test, data analysis, boundary scan, root cause analysis, burn-in test, and wafer-level testing are advanced techniques employed by OSAT providers to enhance yield and improve overall product quality. Incorporating these services into the semiconductor manufacturing process enables companies to deliver high-performance, reliable, and cost-effective products to their customers.

    Market Dynamics

    Our researchers analyzed the data with 2024 as the base year, along with the key drivers, trends, and challenges. A holistic analysis of drivers will help companies refine their marketing strategies to gain a competitive advantage.

    The market, or Outsourced Semiconductor Assembly and Testing market, is a dynamic and innovative industry that offers comprehensive solutions for semiconductor manufacturing. This market caters to the assembly, testing, and packaging needs of semiconductor devices, ensuring their optimal functionality and performance. OSAT providers employ advanced technologies such as Automated Test Equipment (ATE), Wire Bonding, and Flip Chip technologies to deliver high-quality products. The market is driven by the increasing demand for miniaturization, higher performance, and lower power consumption in electronic devices. Moreover, the integration of IoT, AI, and 5G technologies is fueling the growth of this market. OSATs provide cost-effective and efficient solutions, enabling semiconductor companies to focus on their core competencies while OSATs handle the complex manufacturing processes. The market is a global industry with significant presence in regions like Asia Pacific, Europe, and North America.

    What are the key market drivers leading to the rise in the adoption of OSAT Industry?

    • The significant progress in the field of chip packaging technology is the primary catalyst fueling market growth. 

    • The OSAT (Outsourced Semiconductor Assembly and Testing) market is experiencing significant advancements, with the adoption of innovative chip packaging technologies driving growth. The emergence of 3D IC (Three-Dimensional Integrated Circuit) packaging is revolutionizing the industry by enabling miniaturization of electronic components through the use of vertically stacked ICs. This approach addresses the challenge of space constraints, resulting in smaller, more power-efficient, and cost-effective devices. Organic-substrate-interposer (OSiP) technology is gaining popularity due to its cost advantages over silicon interposer technology. In addition, RF (Radio Frequency) applications have demonstrated impressive results using live connectors, further enhancing the potential of OSAT services.
    • Testing plays a crucial role in this process, with functional safety testing, logic testing, vibration testing, thermal testing, IC testing, and yield improvement techniques being employed to ensure product quality. Test engineering and failure analysis are essential components of the testing process, utilizing advanced test equipment to optimize test time reduction and improve overall supply chain efficiency.

    What are the market trends shaping the OSAT Industry?

    • The trend in the market is characterized by an escalating number of strategic partnerships and acquisitions. This growth is driven by companies seeking to expand their reach and enhance their competitive position through collaborations and acquisitions.

    • OSAT (Outsource Semiconductor Assembly and Testing) market companies are strategically expanding their businesses through partnerships and acquisitions. These collaborations enable companies to gain access to new technologies, expand geographically, and enhance product offerings. For instance, on February 7, 2023, Aptos Technology, a leading semiconductor design and testing services company based in Taiwan, announced a partnership with Kaynes Semicon in India to establish a training and technology licensing center for semiconductor packaging and testing. This collaboration will strengthen Aptos Technology's presence in the Indian market and provide Kaynes Semicon with access to advanced testing and packaging technologies. Moreover, market participants are acquiring companies in related markets to broaden their capabilities in OSAT.
    • Testing services encompass various techniques such as in-circuit testing, functional testing, memory testing, package test, optical testing, RF testing, environmental testing, shock testing, process optimization, and test data management. These services are crucial for ensuring product reliability and quality. By acquiring companies specializing in these areas, OSAT companies can expand their service offerings and enhance their technological capabilities. In summary, the market is witnessing a wave of strategic partnerships and acquisitions as companies seek to expand their geographic reach, access new technologies, and optimize their processes for enhanced yield and product reliability.

    What challenges does the OSAT Industry face during its growth?

    • The semiconductor industry faces significant growth constraints due to the escalating shortage of these essential components. 

    • The semiconductor testing market is a critical component of the semiconductor industry, encompassing test program development, system-level testing, humidity testing, parametric testing, mixed-signal testing, and data processing. This market is driven by the increasing demand for reliable and high-quality semiconductor products, which necessitates rigorous testing to ensure product functionality and performance. The importance of test coverage and report generation in maintaining quality assurance is paramount, as test escape rates can significantly impact time to market and overall market competitiveness. Semiconductor testing market dynamics are influenced by various factors, including the cyclical nature of the semiconductor industry.
    • Excess production capacity, rapid obsolescence of products, and price erosion in digital ICs can lead to market disruptions and excess inventory levels. However, the high demand for semiconductors in various industries, such as automotive, consumer electronics, and industrial automation, ensures that semiconductor chips remain in short supply throughout 2022 and 2023. In summary, the semiconductor testing market plays a crucial role in ensuring the reliability and quality of semiconductor products. Testing encompasses various techniques, including system-level testing, humidity testing, parametric testing, mixed-signal testing, and data processing. Market dynamics are influenced by the cyclical nature of the semiconductor industry, which can lead to market disruptions but also ensure continued demand for semiconductor chips.

    Exclusive Customer Landscape

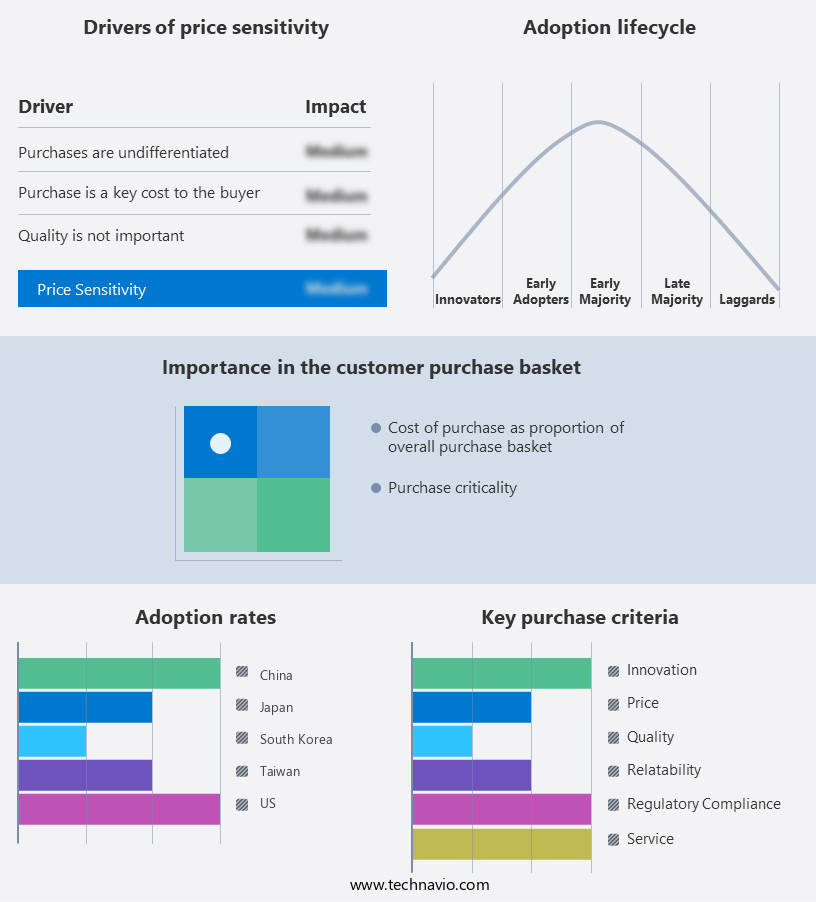
    The osat market forecasting report includes the adoption lifecycle of the market, covering from the innovator’s stage to the laggard’s stage. It focuses on adoption rates in different regions based on penetration. Furthermore, the osat market report also includes key purchase criteria and drivers of price sensitivity to help companies evaluate and develop their market growth analysis strategies.

    OSAT Market Share by Geography

     Customer Landscape

    Key Companies & Market Insights

    Companies are implementing various strategies, such as strategic alliances, osat market forecast, partnerships, mergers and acquisitions, geographical expansion, and product/service launches, to enhance their presence in the industry.

    Aehr Test Systems - The company specializes in Outsourced Semiconductor Assembly and Testing (OSAT) services, delivering turnkey solutions encompassing wafer sort, bump services, packaging, and test & burn-in processes for the global semiconductor industry.

    The industry research and growth report includes detailed analyses of the competitive landscape of the market and information about key companies, including:

    • Aehr Test Systems
    • Amkor Technology Inc.
    • ASE Technology Holding Co. Ltd.
    • Chipbond Technology Corp.
    • ChipMOS TECHNOLOGIES INC.
    • Cohu Inc.
    • Global Unichip Corp.
    • Great Wall Technologies Pvt Ltd.
    • HANA Micron Co. Ltd.
    • Jiangsu Changdian Technology Co. Ltd.
    • King Yuan Electronics Co. Ltd.
    • Lingsen Precision Industries Ltd.
    • Powertech Technology Inc.
    • Sigurd Microelectronics CORP.
    • Taiwan Semiconductor Manufacturing Co. Ltd.
    • Teradyne Inc.
    • Tongfu Microelectronics Co.
    • UTAC Holdings Ltd.
    • Walton Advanced Engineering Inc.

    Qualitative and quantitative analysis of companies has been conducted to help clients understand the wider business environment as well as the strengths and weaknesses of key industry players. Data is qualitatively analyzed to categorize companies as pure play, category-focused, industry-focused, and diversified; it is quantitatively analyzed to categorize companies as dominant, leading, strong, tentative, and weak.

    Recent Development and News in OSAT Market

    • In January 2024, Intel Corporation announced the launch of its new generation of FPGA-based OSAT (Ordered Semiconductor Assembly and Testing) services, which aimed to reduce turnaround time by 30% compared to traditional OSAT solutions (Intel Press Release, 2024).
    • In March 2024, Taiwan Semiconductor Manufacturing Company (TSMC) and Globalfoundries entered into a strategic partnership to expand their OSAT services, combining TSMC's advanced semiconductor manufacturing capabilities with Globalfoundries' OSAT expertise (TSMC Press Release, 2024).
    • In May 2024, Micron Technology raised USD3 billion in a funding round to expand its OSAT capacity and invest in research and development, aiming to increase its market share in the memory OSAT sector (Micron Technology Press Release, 2024).
    • In April 2025, the U.S. Government announced a USD10 billion investment in the CHIPS Act, a part of which would be allocated to support the growth of the OSAT industry and create jobs in the U.S. (White House Fact Sheet, 2025).

    Research Analyst Overview

    • The OSAT (Outsourced Semiconductor Assembly and Test) market experiences dynamic growth, driven by the integration of advanced technologies such as 3D packaging, sensor integration, and system-in-package (SIP) solutions. ICs (Integrated Circuits) undergo rigorous testing using test standards, including predictive maintenance and built-in self-test (BIST), to ensure regulatory compliance. Advanced packaging techniques, like 3D packaging and heterogeneous integration, necessitate the use of specialized materials, such as molding compound and high-density interconnects, to accommodate complex designs. Memory chips, digital-to-analog converters (DACs), and analog-to-digital converters (ADCs) are essential components undergoing these processes. Machine vision and data security are crucial aspects of the market, with AI and ML algorithms employed for automated inspection and quality control.
    • Cloud computing and big data analytics facilitate efficient data processing and real-time monitoring, enhancing overall productivity. Wire bonding and wafer sort remain essential processes in the OSAT industry, while automation software streamlines production and reduces human error. Thermal management and industry standards ensure reliable and consistent performance. The market continues to evolve, with emerging technologies like AI, ML, and cloud computing driving innovation and efficiency in the semiconductor industry.

    Dive into Technavio’s robust research methodology, blending expert interviews, extensive data synthesis, and validated models for unparalleled OSAT Market insights. See full methodology.

    Market Scope

    Report Coverage

    Details

    Page number

    192

    Base year

    2024

    Historic period

    2019-2023

    Forecast period

    2025-2029

    Growth momentum & CAGR

    Accelerate at a CAGR of 9.4%

    Market growth 2025-2029

    USD 28466.3 million

    Market structure

    Fragmented

    YoY growth 2024-2025(%)

    7.2

    Key countries

    China, US, Taiwan, South Korea, Germany, Japan, Brazil, UK, France, and Canada

    Competitive landscape

    Leading Companies, Market Positioning of Companies, Competitive Strategies, and Industry Risks

    Request Free Sample

    What are the Key Data Covered in this OSAT Market Research and Growth Report?

    • CAGR of the OSAT industry during the forecast period
    • Detailed information on factors that will drive the growth and forecasting between 2025 and 2029
    • Precise estimation of the size of the market and its contribution of the industry in focus to the parent market
    • Accurate predictions about upcoming growth and trends and changes in consumer behaviour
    • Growth of the market across APAC, North America, Europe, South America, and Middle East and Africa
    • Thorough analysis of the market’s competitive landscape and detailed information about companies
    • Comprehensive analysis of factors that will challenge the osat market growth of industry companies

    We can help! Our analysts can customize this osat market research report to meet your requirements.

    Get in touch


    1 Executive Summary

    • 1.1 Market overview
      • Executive Summary - Chart on Market Overview
      • Executive Summary - Data Table on Market Overview
      • Executive Summary - Chart on Global Market Characteristics
      • Executive Summary - Chart on Market by Geography
      • Executive Summary - Chart on Market Segmentation by Service
      • Executive Summary - Chart on Market Segmentation by End-user
      • Executive Summary - Chart on Incremental Growth
      • Executive Summary - Data Table on Incremental Growth
      • Executive Summary - Chart on Company Market Positioning

    2 Technavio Analysis

    • 2.1 Analysis of price sensitivity, lifecycle, customer purchase basket, adoption rates, and purchase criteria
      • Analysis of price sensitivity, lifecycle, customer purchase basket, adoption rates, and purchase criteria
    • 2.2 Criticality of inputs and Factors of differentiation
      • Overview on criticality of inputs and factors of differentiation
    • 2.3 Factors of disruption
      • Overview on factors of disruption
    • 2.4 Impact of drivers and challenges
      • Impact of drivers and challenges in 2024 and 2029

    3 Market Landscape

    • 3.1 Market ecosystem
      • Parent Market
      • Data Table on - Parent Market
    • 3.2 Market characteristics
      • Market characteristics analysis
    • 3.3 Value chain analysis
      • Value chain analysis

    4 Market Sizing

    • 4.1 Market definition
      • Offerings of companies included in the market definition
    • 4.2 Market segment analysis
      • Market segments
    • 4.3 Market size 2024
      • 4.4 Market outlook: Forecast for 2024-2029
        • Chart on Global - Market size and forecast 2024-2029 ($ million)
        • Data Table on Global - Market size and forecast 2024-2029 ($ million)
        • Chart on Global Market: Year-over-year growth 2024-2029 (%)
        • Data Table on Global Market: Year-over-year growth 2024-2029 (%)

      5 Historic Market Size

      • 5.1 Global OSAT Market 2019 - 2023
        • Historic Market Size - Data Table on Global OSAT Market 2019 - 2023 ($ million)
      • 5.2 Service segment analysis 2019 - 2023
        • Historic Market Size - Service Segment 2019 - 2023 ($ million)
      • 5.3 End-user segment analysis 2019 - 2023
        • Historic Market Size - End-user Segment 2019 - 2023 ($ million)
      • 5.4 Geography segment analysis 2019 - 2023
        • Historic Market Size - Geography Segment 2019 - 2023 ($ million)
      • 5.5 Country segment analysis 2019 - 2023
        • Historic Market Size - Country Segment 2019 - 2023 ($ million)

      6 Qualitative Analysis

      • 6.1 The AI Impact on Global OSAT Market

        7 Five Forces Analysis

        • 7.1 Five forces summary
          • Five forces analysis - Comparison between 2024 and 2029
        • 7.2 Bargaining power of buyers
          • Bargaining power of buyers - Impact of key factors 2024 and 2029
        • 7.3 Bargaining power of suppliers
          • Bargaining power of suppliers - Impact of key factors in 2024 and 2029
        • 7.4 Threat of new entrants
          • Threat of new entrants - Impact of key factors in 2024 and 2029
        • 7.5 Threat of substitutes
          • Threat of substitutes - Impact of key factors in 2024 and 2029
        • 7.6 Threat of rivalry
          • Threat of rivalry - Impact of key factors in 2024 and 2029
        • 7.7 Market condition
          • Chart on Market condition - Five forces 2024 and 2029

        8 Market Segmentation by Service

        • 8.1 Market segments
          • Chart on Service - Market share 2024-2029 (%)
          • Data Table on Service - Market share 2024-2029 (%)
        • 8.2 Comparison by Service
          • Chart on Comparison by Service
          • Data Table on Comparison by Service
        • 8.3 Assembly and packaging - Market size and forecast 2024-2029
          • Chart on Assembly and packaging - Market size and forecast 2024-2029 ($ million)
          • Data Table on Assembly and packaging - Market size and forecast 2024-2029 ($ million)
          • Chart on Assembly and packaging - Year-over-year growth 2024-2029 (%)
          • Data Table on Assembly and packaging - Year-over-year growth 2024-2029 (%)
        • 8.4 Testing - Market size and forecast 2024-2029
          • Chart on Testing - Market size and forecast 2024-2029 ($ million)
          • Data Table on Testing - Market size and forecast 2024-2029 ($ million)
          • Chart on Testing - Year-over-year growth 2024-2029 (%)
          • Data Table on Testing - Year-over-year growth 2024-2029 (%)
        • 8.5 Market opportunity by Service
          • Market opportunity by Service ($ million)
          • Data Table on Market opportunity by Service ($ million)

        9 Market Segmentation by End-user

        • 9.1 Market segments
          • Chart on End-user - Market share 2024-2029 (%)
          • Data Table on End-user - Market share 2024-2029 (%)
        • 9.2 Comparison by End-user
          • Chart on Comparison by End-user
          • Data Table on Comparison by End-user
        • 9.3 Telecommunication - Market size and forecast 2024-2029
          • Chart on Telecommunication - Market size and forecast 2024-2029 ($ million)
          • Data Table on Telecommunication - Market size and forecast 2024-2029 ($ million)
          • Chart on Telecommunication - Year-over-year growth 2024-2029 (%)
          • Data Table on Telecommunication - Year-over-year growth 2024-2029 (%)
        • 9.4 Consumer electronics - Market size and forecast 2024-2029
          • Chart on Consumer electronics - Market size and forecast 2024-2029 ($ million)
          • Data Table on Consumer electronics - Market size and forecast 2024-2029 ($ million)
          • Chart on Consumer electronics - Year-over-year growth 2024-2029 (%)
          • Data Table on Consumer electronics - Year-over-year growth 2024-2029 (%)
        • 9.5 Industrial electronics - Market size and forecast 2024-2029
          • Chart on Industrial electronics - Market size and forecast 2024-2029 ($ million)
          • Data Table on Industrial electronics - Market size and forecast 2024-2029 ($ million)
          • Chart on Industrial electronics - Year-over-year growth 2024-2029 (%)
          • Data Table on Industrial electronics - Year-over-year growth 2024-2029 (%)
        • 9.6 Automotive - Market size and forecast 2024-2029
          • Chart on Automotive - Market size and forecast 2024-2029 ($ million)
          • Data Table on Automotive - Market size and forecast 2024-2029 ($ million)
          • Chart on Automotive - Year-over-year growth 2024-2029 (%)
          • Data Table on Automotive - Year-over-year growth 2024-2029 (%)
        • 9.7 Others - Market size and forecast 2024-2029
          • Chart on Others - Market size and forecast 2024-2029 ($ million)
          • Data Table on Others - Market size and forecast 2024-2029 ($ million)
          • Chart on Others - Year-over-year growth 2024-2029 (%)
          • Data Table on Others - Year-over-year growth 2024-2029 (%)
        • 9.8 Market opportunity by End-user
          • Market opportunity by End-user ($ million)
          • Data Table on Market opportunity by End-user ($ million)

        10 Customer Landscape

        • 10.1 Customer landscape overview
          • Analysis of price sensitivity, lifecycle, customer purchase basket, adoption rates, and purchase criteria

        11 Geographic Landscape

        • 11.1 Geographic segmentation
          • Chart on Market share by geography 2024-2029 (%)
          • Data Table on Market share by geography 2024-2029 (%)
        • 11.2 Geographic comparison
          • Chart on Geographic comparison
          • Data Table on Geographic comparison
        • 11.3 APAC - Market size and forecast 2024-2029
          • Chart on APAC - Market size and forecast 2024-2029 ($ million)
          • Data Table on APAC - Market size and forecast 2024-2029 ($ million)
          • Chart on APAC - Year-over-year growth 2024-2029 (%)
          • Data Table on APAC - Year-over-year growth 2024-2029 (%)
        • 11.4 North America - Market size and forecast 2024-2029
          • Chart on North America - Market size and forecast 2024-2029 ($ million)
          • Data Table on North America - Market size and forecast 2024-2029 ($ million)
          • Chart on North America - Year-over-year growth 2024-2029 (%)
          • Data Table on North America - Year-over-year growth 2024-2029 (%)
        • 11.5 Europe - Market size and forecast 2024-2029
          • Chart on Europe - Market size and forecast 2024-2029 ($ million)
          • Data Table on Europe - Market size and forecast 2024-2029 ($ million)
          • Chart on Europe - Year-over-year growth 2024-2029 (%)
          • Data Table on Europe - Year-over-year growth 2024-2029 (%)
        • 11.6 South America - Market size and forecast 2024-2029
          • Chart on South America - Market size and forecast 2024-2029 ($ million)
          • Data Table on South America - Market size and forecast 2024-2029 ($ million)
          • Chart on South America - Year-over-year growth 2024-2029 (%)
          • Data Table on South America - Year-over-year growth 2024-2029 (%)
        • 11.7 Middle East and Africa - Market size and forecast 2024-2029
          • Chart on Middle East and Africa - Market size and forecast 2024-2029 ($ million)
          • Data Table on Middle East and Africa - Market size and forecast 2024-2029 ($ million)
          • Chart on Middle East and Africa - Year-over-year growth 2024-2029 (%)
          • Data Table on Middle East and Africa - Year-over-year growth 2024-2029 (%)
        • 11.8 China - Market size and forecast 2024-2029
          • Chart on China - Market size and forecast 2024-2029 ($ million)
          • Data Table on China - Market size and forecast 2024-2029 ($ million)
          • Chart on China - Year-over-year growth 2024-2029 (%)
          • Data Table on China - Year-over-year growth 2024-2029 (%)
        • 11.9 US - Market size and forecast 2024-2029
          • Chart on US - Market size and forecast 2024-2029 ($ million)
          • Data Table on US - Market size and forecast 2024-2029 ($ million)
          • Chart on US - Year-over-year growth 2024-2029 (%)
          • Data Table on US - Year-over-year growth 2024-2029 (%)
        • 11.10 Taiwan - Market size and forecast 2024-2029
          • Chart on Taiwan - Market size and forecast 2024-2029 ($ million)
          • Data Table on Taiwan - Market size and forecast 2024-2029 ($ million)
          • Chart on Taiwan - Year-over-year growth 2024-2029 (%)
          • Data Table on Taiwan - Year-over-year growth 2024-2029 (%)
        • 11.11 South Korea - Market size and forecast 2024-2029
          • Chart on South Korea - Market size and forecast 2024-2029 ($ million)
          • Data Table on South Korea - Market size and forecast 2024-2029 ($ million)
          • Chart on South Korea - Year-over-year growth 2024-2029 (%)
          • Data Table on South Korea - Year-over-year growth 2024-2029 (%)
        • 11.12 Germany - Market size and forecast 2024-2029
          • Chart on Germany - Market size and forecast 2024-2029 ($ million)
          • Data Table on Germany - Market size and forecast 2024-2029 ($ million)
          • Chart on Germany - Year-over-year growth 2024-2029 (%)
          • Data Table on Germany - Year-over-year growth 2024-2029 (%)
        • 11.13 Japan - Market size and forecast 2024-2029
          • Chart on Japan - Market size and forecast 2024-2029 ($ million)
          • Data Table on Japan - Market size and forecast 2024-2029 ($ million)
          • Chart on Japan - Year-over-year growth 2024-2029 (%)
          • Data Table on Japan - Year-over-year growth 2024-2029 (%)
        • 11.14 Brazil - Market size and forecast 2024-2029
          • Chart on Brazil - Market size and forecast 2024-2029 ($ million)
          • Data Table on Brazil - Market size and forecast 2024-2029 ($ million)
          • Chart on Brazil - Year-over-year growth 2024-2029 (%)
          • Data Table on Brazil - Year-over-year growth 2024-2029 (%)
        • 11.15 UK - Market size and forecast 2024-2029
          • Chart on UK - Market size and forecast 2024-2029 ($ million)
          • Data Table on UK - Market size and forecast 2024-2029 ($ million)
          • Chart on UK - Year-over-year growth 2024-2029 (%)
          • Data Table on UK - Year-over-year growth 2024-2029 (%)
        • 11.16 Canada - Market size and forecast 2024-2029
          • Chart on Canada - Market size and forecast 2024-2029 ($ million)
          • Data Table on Canada - Market size and forecast 2024-2029 ($ million)
          • Chart on Canada - Year-over-year growth 2024-2029 (%)
          • Data Table on Canada - Year-over-year growth 2024-2029 (%)
        • 11.17 France - Market size and forecast 2024-2029
          • Chart on France - Market size and forecast 2024-2029 ($ million)
          • Data Table on France - Market size and forecast 2024-2029 ($ million)
          • Chart on France - Year-over-year growth 2024-2029 (%)
          • Data Table on France - Year-over-year growth 2024-2029 (%)
        • 11.18 Market opportunity by geography
          • Market opportunity by geography ($ million)
          • Data Tables on Market opportunity by geography ($ million)

        12 Drivers, Challenges, and Opportunity/Restraints

        • 12.1 Market drivers
          • 12.2 Market challenges
            • 12.3 Impact of drivers and challenges
              • Impact of drivers and challenges in 2024 and 2029
            • 12.4 Market opportunities/restraints

              13 Competitive Landscape

              • 13.1 Overview
                • 13.2 Competitive Landscape
                  • Overview on criticality of inputs and factors of differentiation
                • 13.3 Landscape disruption
                  • Overview on factors of disruption
                • 13.4 Industry risks
                  • Impact of key risks on business

                14 Competitive Analysis

                • 14.1 Companies profiled
                  • Companies covered
                • 14.2 Company ranking index
                  • Company ranking index
                • 14.3 Market positioning of companies
                  • Matrix on companies position and classification
                • 14.4 Amkor Technology Inc.
                  • Amkor Technology Inc. - Overview
                  • Amkor Technology Inc. - Business segments
                  • Amkor Technology Inc. - Key news
                  • Amkor Technology Inc. - Key offerings
                  • Amkor Technology Inc. - Segment focus
                  • SWOT
                • 14.5 ASE Technology Holding Co. Ltd.
                  • ASE Technology Holding Co. Ltd. - Overview
                  • ASE Technology Holding Co. Ltd. - Business segments
                  • ASE Technology Holding Co. Ltd. - Key offerings
                  • ASE Technology Holding Co. Ltd. - Segment focus
                  • SWOT
                • 14.6 Chipbond Technology Corp.
                  • Chipbond Technology Corp. - Overview
                  • Chipbond Technology Corp. - Product / Service
                  • Chipbond Technology Corp. - Key offerings
                  • SWOT
                • 14.7 ChipMOS TECHNOLOGIES INC.
                  • ChipMOS TECHNOLOGIES INC. - Overview
                  • ChipMOS TECHNOLOGIES INC. - Business segments
                  • ChipMOS TECHNOLOGIES INC. - Key offerings
                  • ChipMOS TECHNOLOGIES INC. - Segment focus
                  • SWOT
                • 14.8 Global Unichip Corp.
                  • Global Unichip Corp. - Overview
                  • Global Unichip Corp. - Product / Service
                  • Global Unichip Corp. - Key offerings
                  • SWOT
                • 14.9 Great Wall Technologies Pvt Ltd.
                  • Great Wall Technologies Pvt Ltd. - Overview
                  • Great Wall Technologies Pvt Ltd. - Product / Service
                  • Great Wall Technologies Pvt Ltd. - Key offerings
                  • SWOT
                • 14.10 Jiangsu Changdian Technology Co. Ltd.
                  • Jiangsu Changdian Technology Co. Ltd. - Overview
                  • Jiangsu Changdian Technology Co. Ltd. - Product / Service
                  • Jiangsu Changdian Technology Co. Ltd. - Key offerings
                  • SWOT
                • 14.11 King Yuan Electronics Co. Ltd.
                  • King Yuan Electronics Co. Ltd. - Overview
                  • King Yuan Electronics Co. Ltd. - Product / Service
                  • King Yuan Electronics Co. Ltd. - Key offerings
                  • SWOT
                • 14.12 Lingsen Precision Industries Ltd.
                  • Lingsen Precision Industries Ltd. - Overview
                  • Lingsen Precision Industries Ltd. - Product / Service
                  • Lingsen Precision Industries Ltd. - Key offerings
                  • SWOT
                • 14.13 Powertech Technology Inc.
                  • Powertech Technology Inc. - Overview
                  • Powertech Technology Inc. - Business segments
                  • Powertech Technology Inc. - Key offerings
                  • Powertech Technology Inc. - Segment focus
                  • SWOT
                • 14.14 Sigurd Microelectronics CORP.
                  • Sigurd Microelectronics CORP. - Overview
                  • Sigurd Microelectronics CORP. - Product / Service
                  • Sigurd Microelectronics CORP. - Key offerings
                  • SWOT
                • 14.15 Taiwan Semiconductor Manufacturing Co. Ltd.
                  • Taiwan Semiconductor Manufacturing Co. Ltd. - Overview
                  • Taiwan Semiconductor Manufacturing Co. Ltd. - Product / Service
                  • Taiwan Semiconductor Manufacturing Co. Ltd. - Key news
                  • Taiwan Semiconductor Manufacturing Co. Ltd. - Key offerings
                  • SWOT
                • 14.16 Teradyne Inc.
                  • Teradyne Inc. - Overview
                  • Teradyne Inc. - Business segments
                  • Teradyne Inc. - Key news
                  • Teradyne Inc. - Key offerings
                  • Teradyne Inc. - Segment focus
                  • SWOT
                • 14.17 Tongfu Microelectronics Co.
                  • Tongfu Microelectronics Co. - Overview
                  • Tongfu Microelectronics Co. - Product / Service
                  • Tongfu Microelectronics Co. - Key offerings
                  • SWOT
                • 14.18 UTAC Holdings Ltd.
                  • UTAC Holdings Ltd. - Overview
                  • UTAC Holdings Ltd. - Product / Service
                  • UTAC Holdings Ltd. - Key offerings
                  • SWOT

                15 Appendix

                • 15.1 Scope of the report
                  • 15.2 Inclusions and exclusions checklist
                    • Inclusions checklist
                    • Exclusions checklist
                  • 15.3 Currency conversion rates for US$
                    • Currency conversion rates for US$
                  • 15.4 Research methodology
                    • Research methodology
                  • 15.5 Data procurement
                    • Information sources
                  • 15.6 Data validation
                    • Data validation
                  • 15.7 Validation techniques employed for market sizing
                    • Validation techniques employed for market sizing
                  • 15.8 Data synthesis
                    • Data synthesis
                  • 15.9 360 degree market analysis
                    • 360 degree market analysis
                  • 15.10 List of abbreviations
                    • List of abbreviations

                  Research Methodology

                  Technavio presents a detailed picture of the market by way of study, synthesis, and summation of data from multiple sources. The analysts have presented the various facets of the market with a particular focus on identifying the key industry influencers. The data thus presented is comprehensive, reliable, and the result of extensive research, both primary and secondary.

                  INFORMATION SOURCES

                  Primary sources

                  • Manufacturers and suppliers
                  • Channel partners
                  • Industry experts
                  • Strategic decision makers

                  Secondary sources

                  • Industry journals and periodicals
                  • Government data
                  • Financial reports of key industry players
                  • Historical data
                  • Press releases

                  DATA ANALYSIS

                  Data Synthesis

                  • Collation of data
                  • Estimation of key figures
                  • Analysis of derived insights

                  Data Validation

                  • Triangulation with data models
                  • Reference against proprietary databases
                  • Corroboration with industry experts

                  REPORT WRITING

                  Qualitative

                  • Market drivers
                  • Market challenges
                  • Market trends
                  • Five forces analysis

                  Quantitative

                  • Market size and forecast
                  • Market segmentation
                  • Geographical insights
                  • Competitive landscape

                  Interested in this report?

                  Get your sample now to see our research methodology and insights!

                  Download Now

                  Frequently Asked Questions

                  Osat market growth will increase by $ 28466.3 mn during 2025-2029 .

                  The Osat market is expected to grow at a CAGR of 9.4% during 2025-2029 .

                  Osat market is segmented by Service( Assembly and packaging, Testing, Testing) End-user( Telecommunication, Consumer electronics, Industrial electronics, Automotive, Others)

                  Aehr Test Systems, Amkor Technology Inc., ASE Technology Holding Co. Ltd., Chipbond Technology Corp., ChipMOS TECHNOLOGIES INC., Cohu Inc., Global Unichip Corp., Great Wall Technologies Pvt Ltd., HANA Micron Co. Ltd., Jiangsu Changdian Technology Co. Ltd., King Yuan Electronics Co. Ltd., Lingsen Precision Industries Ltd., Powertech Technology Inc., Sigurd Microelectronics CORP., Taiwan Semiconductor Manufacturing Co. Ltd., Teradyne Inc., Tongfu Microelectronics Co., UTAC Holdings Ltd., Walton Advanced Engineering Inc. are a few of the key vendors in the Osat market.

                  APAC will register the highest growth rate of 63% among the other regions. Therefore, the Osat market in APAC is expected to garner significant business opportunities for the vendors during the forecast period.

                  China, US, Taiwan, South Korea, Germany, Japan, Brazil, UK, France, Canada

                  • Advances in packaging of chipsThe global OSAT market has been seeing the emergence of a new method of chip packaging known as 3D IC. Using 3D packaging is the driving factor this market.
                  • foundries can reduce the size of electronic products with the help of miniaturized ICs. Moreover is the driving factor this market.
                  • 3D packaging allows the stacking of intelligence centers is the driving factor this market.
                  • which further addresses the challenge of space constraints. Such packaging techniques encourage electronic device manufacturers to develop advanced products that are much smaller in size is the driving factor this market.
                  • consume less power is the driving factor this market.
                  • and have an overall reduced product cost.Organic-substrate-interposer technology is highly adopted due to its low costs compared with silicon interposer technology. Some highly efficient radio frequency (RF) applications have been shown using live connectors. However is the driving factor this market.
                  • their effectiveness in the next-generation application is still being studied.Another widely used technology is silicon-via-interconnection or through-silicon via (TSV). TSV efficient interconnect techniques are used as an alternative to wire-bond and flip chips to create 3D packages and integrated 3D circuits. The 2.5/3D IC technology uses TSVs is the driving factor this market.
                  • which enable increased circuit compression is the driving factor this market.
                  • performance is the driving factor this market.
                  • and volume performance. 3D ICs are piled directly on top of each other is the driving factor this market.
                  • with interconnections being made by matching bond areas with TSVs. It also has an application on CMOS image sensors. TSVs are built into the back of the image sensor to create interconnectors is the driving factor this market.
                  • remove wire bonds is the driving factor this market.
                  • and allow for reduced form factor and high-density interconnects. Therefore is the driving factor this market.
                  • increasing advances in chip packaging are anticipated to drive the growth of the global OSAT market during the forecast period. is the driving factor this market.

                  The Osat market vendors should focus on grabbing business opportunities from the Assembly and packaging segment as it accounted for the largest market share in the base year.