Paint Pump Market Analysis, Size, and Forecast 2025-2029: North America (US and Canada), Europe (France, Germany, and UK), APAC (China, India, Japan, and South Korea), South America (Brazil), and Rest of World (ROW)

Paint Pump Market Analysis, Size, and Forecast 2025-2029:
North America (US and Canada), Europe (France, Germany, and UK), APAC (China, India, Japan, and South Korea), South America (Brazil), and Rest of World (ROW)

Published: May 2025 220 Pages SKU: IRTNTR80640

Market Overview at a Glance

$429.4 Mn
Market Opportunity
5.3%
CAGR
5.2
YoY growth 2024-2025(%)

Paint Pump Market Size 2025-2029

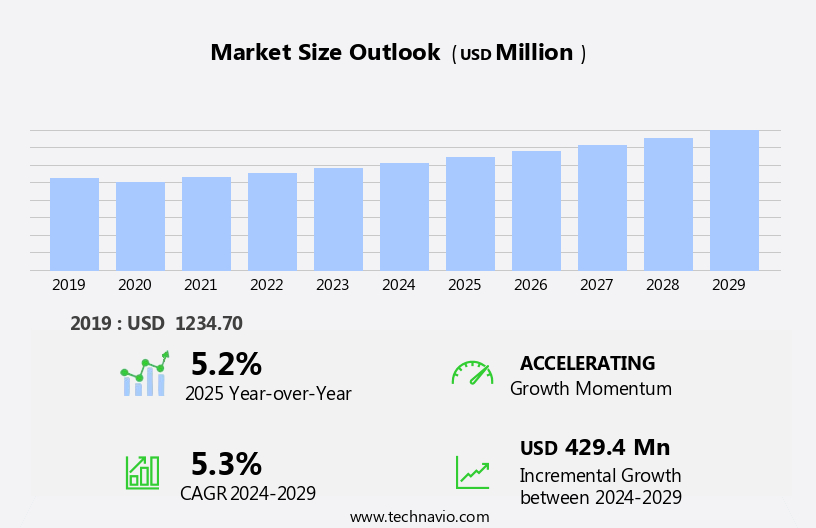
The paint pump market size is forecast to increase by USD 429.4 million at a CAGR of 5.3% between 2024 and 2029.

  • The market experiences robust growth, driven by the increasing demand for high-quality coatings in various industries such as automotive, construction, and industrial manufacturing. This trend is fueled by consumer preferences for superior paint finishes and durability. Moreover, the introduction of innovative products, including energy-efficient and eco-friendly pumps, is expanding market opportunities. However, the market faces challenges. Regulatory hurdles impact adoption due to stringent environmental regulations limiting the use of certain materials. Supply chain inconsistencies, particularly in raw material availability and pricing, temper growth potential.
  • To capitalize on market opportunities and navigate these challenges effectively, companies must focus on product innovation, regulatory compliance, and supply chain resilience. By addressing these factors, they can differentiate themselves and secure a competitive edge in the market. Furthermore, there is a notable trend towards the use of eco-friendly plasticizers, which are gaining popularity due to their reduced environmental impact. Additionally, stringent regulations on the emissions of volatile organic compounds (VOCs) in paints and coatings are compelling manufacturers to shift towards low-VOC and zero-VOC plasticizers. These

What will be the Size of the Paint Pump Market during the forecast period?

Paint Pump Market Size

 Request Free Sample

  • The market encompasses a diverse range of players, from manufacturers and suppliers to distributors and testing facilities. Paint pump testing is crucial for ensuring product quality and performance, driving innovation in the sector. Regulations governing paint pumps continue to evolve, necessitating frequent calibration and certification. Paint pump applications span various industries, including automotive, construction, and coatings. Trends in the market include advances in paint pump technology, such as improved warranty coverage and filter systems. Paint pump pricing remains a key consideration for buyers, leading to increased competition among suppliers. Research and development efforts focus on enhancing pump efficiency and reducing maintenance requirements. Key applications of paint plasticizers span across industries, including automotive technology, for improved impact resistance, scratch resistance, and chip resistance, and the construction sector for infrastructure projects requiring high durability and workability.
  • Spray gun accessories, like nozzles and filters, complement paint pumps in delivering optimal painting results. Paint pump manufacturers prioritize innovation to meet the evolving needs of their customers. Troubleshooting and warranty support are essential services offered by suppliers to maintain customer satisfaction. Certifications and regulations, such as ISO and CE markings, are crucial for ensuring product safety and compliance. Paint pump comparison tools help buyers make informed decisions based on features, performance, and pricing. Calibration services ensure that paint pumps maintain their accuracy and efficiency over time. Overall, the market is dynamic, with ongoing innovation and regulatory changes shaping its future.

How is this Paint Pump Industry segmented?

The paint pump industry research report provides comprehensive data (region-wise segment analysis), with forecasts and estimates in "USD million" for the period 2025-2029, as well as historical data from 2019-2023 for the following segments.

  • Type
    • Pneumatic pump
    • Electric pump
    • Hydraulic pump
  • Product Type
    • Piston pump
    • Positive displacement pump
    • Diaphragm pump
  • Power Output
    • Medium
    • High
    • Low
  • Geography
    • North America
      • US
      • Canada
    • Europe
      • France
      • Germany
      • UK
    • APAC
      • China
      • India
      • Japan
      • South Korea
    • South America
      • Brazil
    • Rest of World (ROW)

By Type Insights

The pneumatic pump segment is estimated to witness significant growth during the forecast period. Pneumatic pumps play a pivotal role in the dynamic market, offering unparalleled reliability and adaptability for various industrial applications. Powered by compressed air, these pumps are a preferred choice in sectors with potential hazards from electricity, such as automotive, construction, and industrial coating industries. Pneumatic pumps excel in handling high-viscosity coatings, including heavy-duty industrial paints, primers, and thick coatings, ensuring consistent flow and pressure. Their simplicity and robustness are significant advantages, as they eliminate the need for electrical components, making them suitable for explosive environments and areas with limited electrical power sources. Safety features are a crucial consideration in the market, and pneumatic pumps deliver on this front. These alternatives are used in various applications, including films, cables, wood, iron products, windows, floorings, doors, pipes, wires and cables, electrical devices, flooring, roofing, cladding, films and sheets, packed food, and beverages.

Quality control is ensured through paint filtration and spray pattern control, while material viscosity and coating thickness are maintained with ease. Maintenance and cleaning are simplified with pneumatic pumps, as they require minimal downtime and do not necessitate extensive maintenance procedures. Hose length and paint thinning are also considerations, with airless paint sprayers and spray booths offering solutions for extended hose lengths and precise paint thinning. In summary, the market is driven by the diverse applications of pneumatic pumps, which offer reliability, simplicity, and robustness in various industrial sectors. Their ability to handle high-viscosity coatings, ensure safety features, and offer cost-effective solutions make them an indispensable component in the evolving market. The market is expected to grow due to the increasing demand for sustainable construction materials, digitalization, and customer interactions in the coatings industry.

Paint Pump Market Size

Request Free Sample

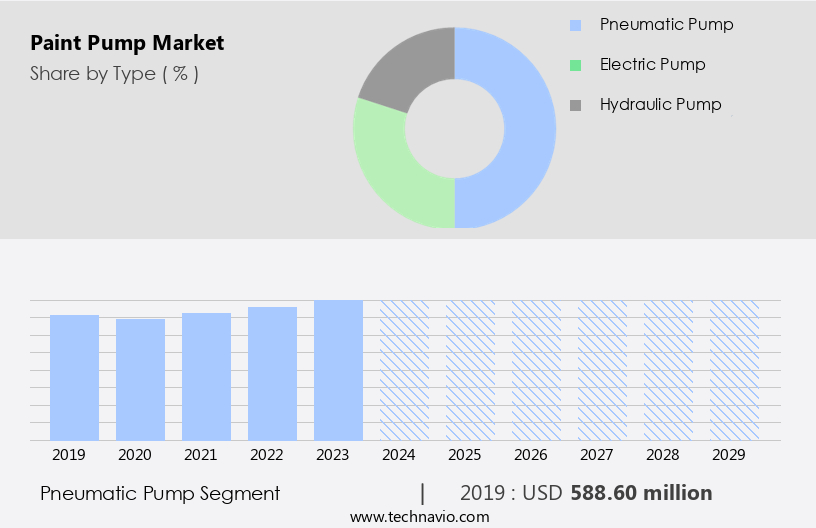
The Pneumatic pump segment was valued at USD 588.60 million in 2019 and showed a gradual increase during the forecast period. Pressure regulation ensures safe and efficient paint application, while spray tip sizes cater to various application rates. Automated painting systems and material handling systems integrate seamlessly with pneumatic pumps, enhancing production efficiency and reducing cycle time. In the architectural painting sector, pneumatic pumps contribute to noise reduction and cost optimization. Electric paint pumps offer energy efficiency and ease of use for smaller projects, while hydraulic paint pumps provide high power for heavy-duty applications. Wear resistance and paint agitation are essential features for industrial and concrete coating projects, ensuring long-lasting performance and uniform coating application. Pneumatic pumps are also instrumental in aerospace painting, marine painting, and robotic painting applications, where precision, pressure control, and material handling are essential.

Regional Analysis

APAC is estimated to contribute 39% to the growth of the global market during the forecast period. Technavio's analysts have elaborately explained the regional trends and drivers that shape the market during the forecast period. The Paint Pump Market is experiencing significant growth, driven by advancements in paint pump innovations and emerging paint pump trends. Manufacturers are focusing on paint pump calibration to ensure precision, while paint pump troubleshooting solutions improve operational efficiency. Compliance with paint pump regulations is crucial, making paint pump certifications a key factor in market success. Leading paint pump suppliers and paint pump distributors provide high-quality paint pump filters to enhance performance and durability. Industry experts are conducting paint pump research to develop cutting-edge technology, ensuring extended paint pump warranty periods for customer satisfaction. The evolving market demands sustainable and efficient solutions, reinforcing the need for continuous improvements in paint pump innovations and regulatory compliance. The future of paint pump trends looks promising.

Paint Pump Market Share by Geography

Download Free Sample Report

The Asia-Pacific (APAC) region is witnessing significant growth in various industries, leading to increased demand for paint pumps. These pumps play a vital role in the efficient and precise application of paints and coatings in manufacturing, automotive, and infrastructure projects. The industrial sector in China reported a 5.8% year-on-year increase in production in 2024, as per the National Bureau of Statistics. India's manufacturing sector is also thriving, with a gross value added of 14 trillion INR in the fiscal year 2023. Paint pumps are essential for metal coating, paint recirculation, and spray volume control. They offer cost optimization through pressure regulation, safety features, and automated painting systems.

Material handling is streamlined with the use of pneumatic and electric paint pumps, while wear resistance and paint agitation ensure consistent coating thickness. Industrial painting projects require noise reduction, production efficiency, and material viscosity management, all of which are facilitated by these pumps. Robotic painting and quality control are crucial in aerospace painting, marine painting, and construction projects. Paint filtration, spray distance, and paint nozzle size are critical factors for electrostatic painting and high-volume low-pressure (HVLP) applications. Surface preparation and wood finishing also benefit from the use of paint pumps. Paint thinning, cycle time reduction, chemical resistance, and hose length are essential considerations for various industries.

Airless paint sprayers, spray booths, flow control, and air-assisted airless technology are other features that enhance the functionality of paint pumps. Hydraulic paint pumps are commonly used in automotive painting, while project management software ensures efficient storage and transportation of materials. The demand for paint pumps is driven by the growth of various industries in the APAC region. These pumps offer numerous benefits, including cost optimization, safety features, pressure regulation, and material handling, making them indispensable for a wide range of applications.

Market Dynamics

Our researchers analyzed the data with 2024 as the base year, along with the key drivers, trends, and challenges. A holistic analysis of drivers will help companies refine their marketing strategies to gain a competitive advantage.

What are the Paint Pump market drivers leading to the rise in the adoption of Industry?

  • The increasing demand for top-tier coatings serves as the primary market catalyst. The market is experiencing significant growth due to the increasing demand for high-quality coatings in various industries, including construction, automotive, aerospace, and consumer goods. These industries prioritize superior surface finishes to enhance product durability and aesthetics, making paint pumps an essential component for even and consistent coating application. Paint pumps contribute to cost optimization by ensuring efficient use of materials through features like paint recirculation, pressure regulation, and adjustable spray volume and application rate. Additionally, automated painting systems and material handling equipment integrate pneumatic paint pumps for increased productivity and safety.
  • Safety features, such as automatic shut-off and pressure relief valves, ensure safe operation. The market's expansion is driven by the need for precise paint application, as high-quality coatings offer vital protection against environmental elements. Paint pumps' role in maintaining consistent spray tip sizes and application rates further supports the market's growth.

What are the Paint Pump market trends shaping the Industry?

  • The introduction of new products is a prevailing market trend. It is essential for businesses to stay informed and prepared for the launch of innovative offerings to remain competitive. The market is witnessing significant innovation as manufacturers focus on enhancing efficiency, minimizing downtime, and addressing industry-specific demands. New product launches incorporate advanced technologies for faster and precise paint application, addressing challenges such as material wastage, maintenance requirements, and operating costs. For instance, CIRCOR International introduced the Chameleon Pump on July 8, 2024, designed for the paints and coatings industry. This pump's primary focus is on reducing downtime, crucial in high-speed production environments. Operators in various industries, including construction, automotive, and industrial manufacturing, benefit from these advancements.
  • Electric paint pumps, wear resistance, paint agitation, noise reduction, production efficiency, marine painting, robotic painting, quality control, and material viscosity are essential considerations in this market. Manufacturers continually strive to meet these demands, ensuring their products cater to the unique needs of each industry.

How does Paint Pump market faces challenges face during its growth?

  • The escalating costs of raw materials pose a significant challenge to the industry's growth trajectory. The market is currently experiencing increased costs for raw materials, leading to higher production expenses and potential pricing strategies. Key materials used in paint pumps and coatings have seen significant price s due to various global factors, including supply chain disruptions and industry demand shifts. According to the World Bank, aluminum prices rose by 12.6% in April 2024, primarily due to increased demand from industries such as electric vehicles (EVs) and renewable energy infrastructure. This trend is expected to continue, as these industries require large amounts of aluminum for construction and manufacturing. Another factor is the growing preference for energy-efficient technologies, such as high-volume low-pressure (HVLP) and electrostatic painting, which can help reduce paint usage and improve overall efficiency.
  • Additionally, advancements in paint filtration, spray distance control, and paint nozzle technology enable better coating thickness consistency and cycle time reductions. Chemical resistance and hose length are also crucial considerations for paint pump selection, ensuring long-term durability and performance.

Exclusive Customer Landscape

The paint pump market forecasting report includes the adoption lifecycle of the market, covering from the innovator's stage to the laggard's stage. It focuses on adoption rates in different regions based on penetration. Furthermore, the paint pump market report also includes key purchase criteria and drivers of price sensitivity to help companies evaluate and develop their market growth analysis strategies.
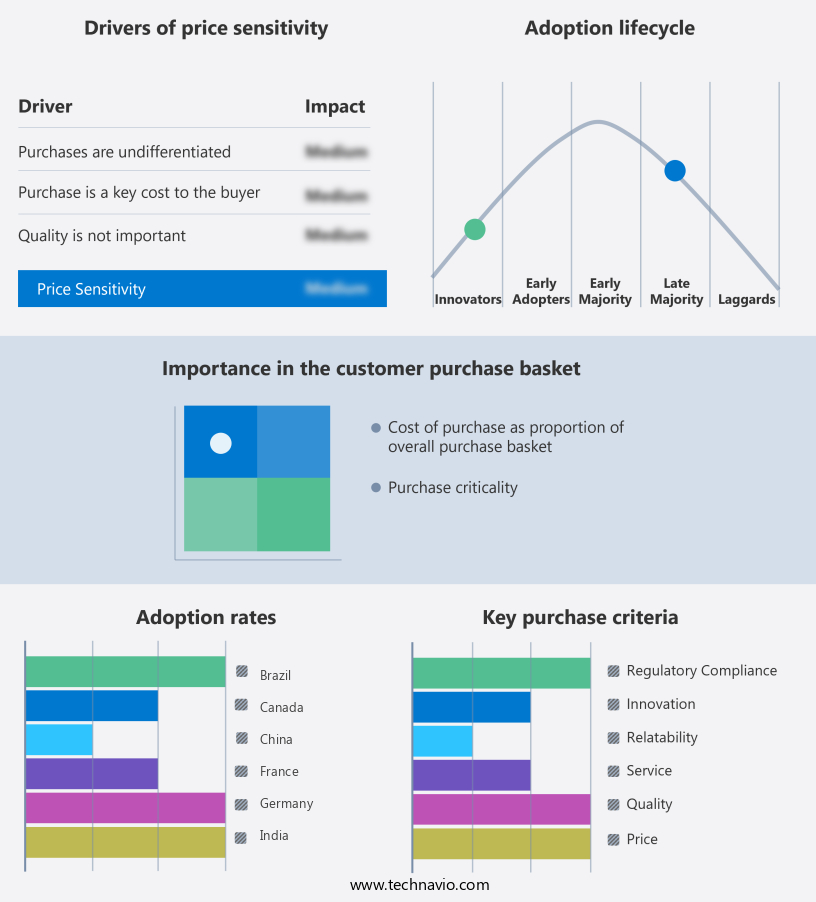
Paint Pump Market Share by Geography

 Customer Landscape

Key Companies & Market Insights

Companies are implementing various strategies, such as strategic alliances, paint pump market forecast, partnerships, mergers and acquisitions, geographical expansion, and product/service launches, to enhance their presence in the industry.

ANEST IWATA USA Inc - The company specializes in providing advanced paint pump solutions, encompassing low-pressure and diaphragm models.

The industry research and growth report includes detailed analyses of the competitive landscape of the market and information about key companies, including:

  • ANEST IWATA USA Inc
  • Argal Srl
  • Codinter Inc
  • DSTech Co. Ltd.
  • Fluimac S.r.l.
  • Graco Inc.
  • Krautzberger GmbH
  • Larius S.r.l
  • PSG Dover
  • Sagola
  • SAMES
  • SATA GmbH and Co. KG
  • Smart Coatings Equipments
  • Sulzer Ltd.
  • V. R. Coatings Pvt. Ltd.
  • Verder Liquids

Qualitative and quantitative analysis of companies has been conducted to help clients understand the wider business environment as well as the strengths and weaknesses of key industry players. Data is qualitatively analyzed to categorize companies as pure play, category-focused, industry-focused, and diversified; it is quantitatively analyzed to categorize companies as dominant, leading, strong, tentative, and weak.

Recent Development and News in Paint Pump Market

  • In February 2024, Graco Inc., a leading manufacturer of paint pumps and other fluid handling equipment, introduced its new XT5 Series paint pumps. These innovative pumps offer increased efficiency and durability, with the ability to handle a wider range of viscosities (Graco Inc. Press release).
  • In May 2025, Wacker Chemicals AG and BASF SE, two major players in the chemical industry, announced a strategic collaboration to develop and produce advanced coatings and adhesives using Wacker's dispersible polymer powders and BASF's paint pump systems (BASF SE press release).
  • In August 2024, PPG Industries, a global paint and coatings company, completed the acquisition of AkzoNobel's industrial coatings business for USD 2.61 billion. This acquisition significantly expanded PPG's global footprint and market share in the industrial coatings sector (PPG Industries press release).
  • In December 2025, the European Union passed new regulations on the use of certain chemicals in paints and coatings, including the restriction of certain phthalates and bisphenol A. This regulatory shift is expected to drive demand for alternative technologies and more environmentally friendly paint pump systems (European Chemicals Agency press release).

Research Analyst Overview

The market continues to evolve, driven by the diverse demands of various sectors. Operator training and maintenance and cleaning are crucial aspects of ensuring optimal performance and longevity for paint pumps. Electric paint pumps, with their energy efficiency and quiet operation, are gaining popularity. Wear resistance and paint agitation are essential features for industrial painting applications, while concrete coating requires high material viscosity handling. Noise reduction and production efficiency are key considerations for marine painting projects. Robotic painting systems offer quality control benefits and cycle time reduction in automated manufacturing processes. Paint pumps are integral to architectural painting, pneumatic and hydraulic models catering to different application requirements. Plasticizers are used in the production of medical devices and equipment due to their ability to enhance the flexibility and durability of the materials used in these applications.

Aerospace painting necessitates high chemical resistance and precise material handling. Safety features, pressure regulation, and spray tip size are essential for application rate control in various painting systems. Paint filtration and spray pattern control ensure consistent results in electrostatic painting. Construction painting projects require material handling solutions, while surface preparation and wood finishing applications necessitate specific spray distance and paint nozzle considerations. Energy efficiency, hose length, and airless paint sprayers are essential for cost optimization. Paint mixing and project management solutions further enhance the versatility of paint pump systems.

Dive into Technavio's strong research methodology, blending expert interviews, extensive data synthesis, and validated models for unparalleled Paint Pump Market insights. See full methodology.

Market Scope

Report Coverage

Details

Page number

220

Base year

2024

Historic period

2019-2023

Forecast period

2025-2029

Growth momentum & CAGR

Accelerate at a CAGR of 5.3%

Market growth 2025-2029

USD 429.4 million

Market structure

Fragmented

YoY growth 2024-2025(%)

5.2

Key countries

US, China, Germany, India, UK, Japan, Brazil, South Korea, France, and Canada

Competitive landscape

Leading Companies, Market Positioning of Companies, Competitive Strategies, and Industry Risks

Request Free Sample

What are the Key Data Covered in this Paint Pump Market Research and Growth Report?

  • CAGR of the Paint Pump industry during the forecast period
  • Detailed information on factors that will drive the growth and forecasting between 2025 and 2029
  • Precise estimation of the size of the market and its contribution of the industry in focus to the parent market
  • Accurate predictions about upcoming growth and trends and changes in consumer behaviour
  • Growth of the market across APAC, Europe, North America, South America, and Middle East and Africa
  • Thorough analysis of the market's competitive landscape and detailed information about companies
  • Comprehensive analysis of factors that will challenge the paint pump market growth of industry companies

We can help! Our analysts can customize this paint pump market research report to meet your requirements.

Get in touch

1 Executive Summary

  • 1.1 Market overview
    • Executive Summary - Chart on Market Overview
    • Executive Summary - Data Table on Market Overview
    • Executive Summary - Chart on Global Market Characteristics
    • Executive Summary - Chart on Market by Geography
    • Executive Summary - Chart on Market Segmentation by Type
    • Executive Summary - Chart on Market Segmentation by Product Type
    • Executive Summary - Chart on Market Segmentation by Power Output
    • Executive Summary - Chart on Incremental Growth
    • Executive Summary - Data Table on Incremental Growth
    • Executive Summary - Chart on Company Market Positioning

2 Technavio Analysis

  • 2.1 Analysis of price sensitivity, lifecycle, customer purchase basket, adoption rates, and purchase criteria
    • Analysis of price sensitivity, lifecycle, customer purchase basket, adoption rates, and purchase criteria
  • 2.2 Criticality of inputs and Factors of differentiation
    • Overview on criticality of inputs and factors of differentiation
  • 2.3 Factors of disruption
    • Overview on factors of disruption
  • 2.4 Impact of drivers and challenges
    • Impact of drivers and challenges in 2024 and 2029

3 Market Landscape

  • 3.1 Market ecosystem
    • Parent Market
    • Data Table on - Parent Market
  • 3.2 Market characteristics
    • Market characteristics analysis
  • 3.3 Value chain analysis
    • Value chain analysis

4 Market Sizing

  • 4.1 Market definition
    • Offerings of companies included in the market definition
  • 4.2 Market segment analysis
    • Market segments
  • 4.3 Market size 2024
    • 4.4 Market outlook: Forecast for 2024-2029
      • Chart on Global - Market size and forecast 2024-2029 ($ million)
      • Data Table on Global - Market size and forecast 2024-2029 ($ million)
      • Chart on Global Market: Year-over-year growth 2024-2029 (%)
      • Data Table on Global Market: Year-over-year growth 2024-2029 (%)

    5 Historic Market Size

    • 5.1 Global Paint Pump Market 2019 - 2023
      • Historic Market Size - Data Table on Global Paint Pump Market 2019 - 2023 ($ million)
    • 5.2 Type segment analysis 2019 - 2023
      • Historic Market Size - Type Segment 2019 - 2023 ($ million)
    • 5.3 Product Type segment analysis 2019 - 2023
      • Historic Market Size - Product Type Segment 2019 - 2023 ($ million)
    • 5.4 Power Output segment analysis 2019 - 2023
      • Historic Market Size - Power Output Segment 2019 - 2023 ($ million)
    • 5.5 Geography segment analysis 2019 - 2023
      • Historic Market Size - Geography Segment 2019 - 2023 ($ million)
    • 5.6 Country segment analysis 2019 - 2023
      • Historic Market Size - Country Segment 2019 - 2023 ($ million)

    6 Qualitative Analysis

    • 6.1 Impact Analysis of U.S. Tariff War on Global Paint Pump Market

      7 Five Forces Analysis

      • 7.1 Five forces summary
        • Five forces analysis - Comparison between 2024 and 2029
      • 7.2 Bargaining power of buyers
        • Bargaining power of buyers - Impact of key factors 2024 and 2029
      • 7.3 Bargaining power of suppliers
        • Bargaining power of suppliers - Impact of key factors in 2024 and 2029
      • 7.4 Threat of new entrants
        • Threat of new entrants - Impact of key factors in 2024 and 2029
      • 7.5 Threat of substitutes
        • Threat of substitutes - Impact of key factors in 2024 and 2029
      • 7.6 Threat of rivalry
        • Threat of rivalry - Impact of key factors in 2024 and 2029
      • 7.7 Market condition
        • Chart on Market condition - Five forces 2024 and 2029

      8 Market Segmentation by Type

      • 8.1 Market segments
        • Chart on Type - Market share 2024-2029 (%)
        • Data Table on Type - Market share 2024-2029 (%)
      • 8.2 Comparison by Type
        • Chart on Comparison by Type
        • Data Table on Comparison by Type
      • 8.3 Pneumatic pump - Market size and forecast 2024-2029
        • Chart on Pneumatic pump - Market size and forecast 2024-2029 ($ million)
        • Data Table on Pneumatic pump - Market size and forecast 2024-2029 ($ million)
        • Chart on Pneumatic pump - Year-over-year growth 2024-2029 (%)
        • Data Table on Pneumatic pump - Year-over-year growth 2024-2029 (%)
      • 8.4 Electric pump - Market size and forecast 2024-2029
        • Chart on Electric pump - Market size and forecast 2024-2029 ($ million)
        • Data Table on Electric pump - Market size and forecast 2024-2029 ($ million)
        • Chart on Electric pump - Year-over-year growth 2024-2029 (%)
        • Data Table on Electric pump - Year-over-year growth 2024-2029 (%)
      • 8.5 Hydraulic pump - Market size and forecast 2024-2029
        • Chart on Hydraulic pump - Market size and forecast 2024-2029 ($ million)
        • Data Table on Hydraulic pump - Market size and forecast 2024-2029 ($ million)
        • Chart on Hydraulic pump - Year-over-year growth 2024-2029 (%)
        • Data Table on Hydraulic pump - Year-over-year growth 2024-2029 (%)
      • 8.6 Market opportunity by Type
        • Market opportunity by Type ($ million)
        • Data Table on Market opportunity by Type ($ million)

      9 Market Segmentation by Product Type

      • 9.1 Market segments
        • Chart on Product Type - Market share 2024-2029 (%)
        • Data Table on Product Type - Market share 2024-2029 (%)
      • 9.2 Comparison by Product Type
        • Chart on Comparison by Product Type
        • Data Table on Comparison by Product Type
      • 9.3 Piston pump - Market size and forecast 2024-2029
        • Chart on Piston pump - Market size and forecast 2024-2029 ($ million)
        • Data Table on Piston pump - Market size and forecast 2024-2029 ($ million)
        • Chart on Piston pump - Year-over-year growth 2024-2029 (%)
        • Data Table on Piston pump - Year-over-year growth 2024-2029 (%)
      • 9.4 Positive displacement pump - Market size and forecast 2024-2029
        • Chart on Positive displacement pump - Market size and forecast 2024-2029 ($ million)
        • Data Table on Positive displacement pump - Market size and forecast 2024-2029 ($ million)
        • Chart on Positive displacement pump - Year-over-year growth 2024-2029 (%)
        • Data Table on Positive displacement pump - Year-over-year growth 2024-2029 (%)
      • 9.5 Diaphragm pump - Market size and forecast 2024-2029
        • Chart on Diaphragm pump - Market size and forecast 2024-2029 ($ million)
        • Data Table on Diaphragm pump - Market size and forecast 2024-2029 ($ million)
        • Chart on Diaphragm pump - Year-over-year growth 2024-2029 (%)
        • Data Table on Diaphragm pump - Year-over-year growth 2024-2029 (%)
      • 9.6 Market opportunity by Product Type
        • Market opportunity by Product Type ($ million)
        • Data Table on Market opportunity by Product Type ($ million)

      10 Market Segmentation by Power Output

      • 10.1 Market segments
        • Chart on Power Output - Market share 2024-2029 (%)
        • Data Table on Power Output - Market share 2024-2029 (%)
      • 10.2 Comparison by Power Output
        • Chart on Comparison by Power Output
        • Data Table on Comparison by Power Output
      • 10.3 Medium - Market size and forecast 2024-2029
        • Chart on Medium - Market size and forecast 2024-2029 ($ million)
        • Data Table on Medium - Market size and forecast 2024-2029 ($ million)
        • Chart on Medium - Year-over-year growth 2024-2029 (%)
        • Data Table on Medium - Year-over-year growth 2024-2029 (%)
      • 10.4 High - Market size and forecast 2024-2029
        • Chart on High - Market size and forecast 2024-2029 ($ million)
        • Data Table on High - Market size and forecast 2024-2029 ($ million)
        • Chart on High - Year-over-year growth 2024-2029 (%)
        • Data Table on High - Year-over-year growth 2024-2029 (%)
      • 10.5 Low - Market size and forecast 2024-2029
        • Chart on Low - Market size and forecast 2024-2029 ($ million)
        • Data Table on Low - Market size and forecast 2024-2029 ($ million)
        • Chart on Low - Year-over-year growth 2024-2029 (%)
        • Data Table on Low - Year-over-year growth 2024-2029 (%)
      • 10.6 Market opportunity by Power Output
        • Market opportunity by Power Output ($ million)
        • Data Table on Market opportunity by Power Output ($ million)

      11 Customer Landscape

      • 11.1 Customer landscape overview
        • Analysis of price sensitivity, lifecycle, customer purchase basket, adoption rates, and purchase criteria

      12 Geographic Landscape

      • 12.1 Geographic segmentation
        • Chart on Market share by geography 2024-2029 (%)
        • Data Table on Market share by geography 2024-2029 (%)
      • 12.2 Geographic comparison
        • Chart on Geographic comparison
        • Data Table on Geographic comparison
      • 12.3 APAC - Market size and forecast 2024-2029
        • Chart on APAC - Market size and forecast 2024-2029 ($ million)
        • Data Table on APAC - Market size and forecast 2024-2029 ($ million)
        • Chart on APAC - Year-over-year growth 2024-2029 (%)
        • Data Table on APAC - Year-over-year growth 2024-2029 (%)
      • 12.4 Europe - Market size and forecast 2024-2029
        • Chart on Europe - Market size and forecast 2024-2029 ($ million)
        • Data Table on Europe - Market size and forecast 2024-2029 ($ million)
        • Chart on Europe - Year-over-year growth 2024-2029 (%)
        • Data Table on Europe - Year-over-year growth 2024-2029 (%)
      • 12.5 North America - Market size and forecast 2024-2029
        • Chart on North America - Market size and forecast 2024-2029 ($ million)
        • Data Table on North America - Market size and forecast 2024-2029 ($ million)
        • Chart on North America - Year-over-year growth 2024-2029 (%)
        • Data Table on North America - Year-over-year growth 2024-2029 (%)
      • 12.6 South America - Market size and forecast 2024-2029
        • Chart on South America - Market size and forecast 2024-2029 ($ million)
        • Data Table on South America - Market size and forecast 2024-2029 ($ million)
        • Chart on South America - Year-over-year growth 2024-2029 (%)
        • Data Table on South America - Year-over-year growth 2024-2029 (%)
      • 12.7 Middle East and Africa - Market size and forecast 2024-2029
        • Chart on Middle East and Africa - Market size and forecast 2024-2029 ($ million)
        • Data Table on Middle East and Africa - Market size and forecast 2024-2029 ($ million)
        • Chart on Middle East and Africa - Year-over-year growth 2024-2029 (%)
        • Data Table on Middle East and Africa - Year-over-year growth 2024-2029 (%)
      • 12.8 US - Market size and forecast 2024-2029
        • Chart on US - Market size and forecast 2024-2029 ($ million)
        • Data Table on US - Market size and forecast 2024-2029 ($ million)
        • Chart on US - Year-over-year growth 2024-2029 (%)
        • Data Table on US - Year-over-year growth 2024-2029 (%)
      • 12.9 China - Market size and forecast 2024-2029
        • Chart on China - Market size and forecast 2024-2029 ($ million)
        • Data Table on China - Market size and forecast 2024-2029 ($ million)
        • Chart on China - Year-over-year growth 2024-2029 (%)
        • Data Table on China - Year-over-year growth 2024-2029 (%)
      • 12.10 Germany - Market size and forecast 2024-2029
        • Chart on Germany - Market size and forecast 2024-2029 ($ million)
        • Data Table on Germany - Market size and forecast 2024-2029 ($ million)
        • Chart on Germany - Year-over-year growth 2024-2029 (%)
        • Data Table on Germany - Year-over-year growth 2024-2029 (%)
      • 12.11 India - Market size and forecast 2024-2029
        • Chart on India - Market size and forecast 2024-2029 ($ million)
        • Data Table on India - Market size and forecast 2024-2029 ($ million)
        • Chart on India - Year-over-year growth 2024-2029 (%)
        • Data Table on India - Year-over-year growth 2024-2029 (%)
      • 12.12 UK - Market size and forecast 2024-2029
        • Chart on UK - Market size and forecast 2024-2029 ($ million)
        • Data Table on UK - Market size and forecast 2024-2029 ($ million)
        • Chart on UK - Year-over-year growth 2024-2029 (%)
        • Data Table on UK - Year-over-year growth 2024-2029 (%)
      • 12.13 Japan - Market size and forecast 2024-2029
        • Chart on Japan - Market size and forecast 2024-2029 ($ million)
        • Data Table on Japan - Market size and forecast 2024-2029 ($ million)
        • Chart on Japan - Year-over-year growth 2024-2029 (%)
        • Data Table on Japan - Year-over-year growth 2024-2029 (%)
      • 12.14 Brazil - Market size and forecast 2024-2029
        • Chart on Brazil - Market size and forecast 2024-2029 ($ million)
        • Data Table on Brazil - Market size and forecast 2024-2029 ($ million)
        • Chart on Brazil - Year-over-year growth 2024-2029 (%)
        • Data Table on Brazil - Year-over-year growth 2024-2029 (%)
      • 12.15 France - Market size and forecast 2024-2029
        • Chart on France - Market size and forecast 2024-2029 ($ million)
        • Data Table on France - Market size and forecast 2024-2029 ($ million)
        • Chart on France - Year-over-year growth 2024-2029 (%)
        • Data Table on France - Year-over-year growth 2024-2029 (%)
      • 12.16 South Korea - Market size and forecast 2024-2029
        • Chart on South Korea - Market size and forecast 2024-2029 ($ million)
        • Data Table on South Korea - Market size and forecast 2024-2029 ($ million)
        • Chart on South Korea - Year-over-year growth 2024-2029 (%)
        • Data Table on South Korea - Year-over-year growth 2024-2029 (%)
      • 12.17 Canada - Market size and forecast 2024-2029
        • Chart on Canada - Market size and forecast 2024-2029 ($ million)
        • Data Table on Canada - Market size and forecast 2024-2029 ($ million)
        • Chart on Canada - Year-over-year growth 2024-2029 (%)
        • Data Table on Canada - Year-over-year growth 2024-2029 (%)
      • 12.18 Market opportunity by geography
        • Market opportunity by geography ($ million)
        • Data Tables on Market opportunity by geography ($ million)

      13 Drivers, Challenges, and Opportunity/Restraints

      • 13.1 Market drivers
        • 13.2 Market challenges
          • 13.3 Impact of drivers and challenges
            • Impact of drivers and challenges in 2024 and 2029
          • 13.4 Market opportunities/restraints

            14 Competitive Landscape

            • 14.1 Overview
              • 14.2 Competitive Landscape
                • Overview on criticality of inputs and factors of differentiation
              • 14.3 Landscape disruption
                • Overview on factors of disruption
              • 14.4 Industry risks
                • Impact of key risks on business

              15 Competitive Analysis

              • 15.1 Companies profiled
                • Companies covered
              • 15.2 Company ranking index
                • Company ranking index
              • 15.3 Market positioning of companies
                • Matrix on companies position and classification
              • 15.4 ANEST IWATA USA Inc
                • ANEST IWATA USA Inc - Overview
                • ANEST IWATA USA Inc - Product / Service
                • ANEST IWATA USA Inc - Key offerings
                • SWOT
              • 15.5 Argal Srl
                • Argal Srl - Overview
                • Argal Srl - Product / Service
                • Argal Srl - Key offerings
                • SWOT
              • 15.6 Codinter Inc
                • Codinter Inc - Overview
                • Codinter Inc - Product / Service
                • Codinter Inc - Key offerings
                • SWOT
              • 15.7 DSTech Co. Ltd.
                • DSTech Co. Ltd. - Overview
                • DSTech Co. Ltd. - Product / Service
                • DSTech Co. Ltd. - Key offerings
                • SWOT
              • 15.8 Fluimac S.r.l.
                • Fluimac S.r.l. - Overview
                • Fluimac S.r.l. - Product / Service
                • Fluimac S.r.l. - Key offerings
                • SWOT
              • 15.9 Graco Inc.
                • Graco Inc. - Overview
                • Graco Inc. - Product / Service
                • Graco Inc. - Key news
                • Graco Inc. - Key offerings
                • SWOT
              • 15.10 Krautzberger GmbH
                • Krautzberger GmbH - Overview
                • Krautzberger GmbH - Product / Service
                • Krautzberger GmbH - Key offerings
                • SWOT
              • 15.11 Larius S.r.l
                • Larius S.r.l - Overview
                • Larius S.r.l - Product / Service
                • Larius S.r.l - Key offerings
                • SWOT
              • 15.12 PSG Dover
                • PSG Dover - Overview
                • PSG Dover - Product / Service
                • PSG Dover - Key offerings
                • SWOT
              • 15.13 Sagola
                • Sagola - Overview
                • Sagola - Product / Service
                • Sagola - Key offerings
                • SWOT
              • 15.14 SAMES
                • SAMES - Overview
                • SAMES - Product / Service
                • SAMES - Key offerings
                • SWOT
              • 15.15 SATA GmbH and Co. KG
                • SATA GmbH and Co. KG - Overview
                • SATA GmbH and Co. KG - Product / Service
                • SATA GmbH and Co. KG - Key offerings
                • SWOT
              • 15.16 Smart Coatings Equipments
                • Smart Coatings Equipments - Overview
                • Smart Coatings Equipments - Product / Service
                • Smart Coatings Equipments - Key offerings
                • SWOT
              • 15.17 V. R. Coatings Pvt. Ltd.
                • V. R. Coatings Pvt. Ltd. - Overview
                • V. R. Coatings Pvt. Ltd. - Product / Service
                • V. R. Coatings Pvt. Ltd. - Key offerings
                • SWOT
              • 15.18 Verder Liquids
                • Verder Liquids - Overview
                • Verder Liquids - Product / Service
                • Verder Liquids - Key offerings
                • SWOT

              16 Appendix

              • 16.1 Scope of the report
                • 16.2 Inclusions and exclusions checklist
                  • Inclusions checklist
                  • Exclusions checklist
                • 16.3 Currency conversion rates for US$
                  • Currency conversion rates for US$
                • 16.4 Research methodology
                  • Research methodology
                • 16.5 Data procurement
                  • Information sources
                • 16.6 Data validation
                  • Data validation
                • 16.7 Validation techniques employed for market sizing
                  • Validation techniques employed for market sizing
                • 16.8 Data synthesis
                  • Data synthesis
                • 16.9 360 degree market analysis
                  • 360 degree market analysis
                • 16.10 List of abbreviations
                  • List of abbreviations

                Research Methodology

                Technavio presents a detailed picture of the market by way of study, synthesis, and summation of data from multiple sources. The analysts have presented the various facets of the market with a particular focus on identifying the key industry influencers. The data thus presented is comprehensive, reliable, and the result of extensive research, both primary and secondary.

                INFORMATION SOURCES

                Primary sources

                • Manufacturers and suppliers
                • Channel partners
                • Industry experts
                • Strategic decision makers

                Secondary sources

                • Industry journals and periodicals
                • Government data
                • Financial reports of key industry players
                • Historical data
                • Press releases

                DATA ANALYSIS

                Data Synthesis

                • Collation of data
                • Estimation of key figures
                • Analysis of derived insights

                Data Validation

                • Triangulation with data models
                • Reference against proprietary databases
                • Corroboration with industry experts

                REPORT WRITING

                Qualitative

                • Market drivers
                • Market challenges
                • Market trends
                • Five forces analysis

                Quantitative

                • Market size and forecast
                • Market segmentation
                • Geographical insights
                • Competitive landscape

                Interested in this report?

                Get your sample now to see our research methodology and insights!

                Download Now

                Frequently Asked Questions

                Paint Pump market growth will increase by $ 429.4 mn during 2025-2029 .

                The Paint Pump market is expected to grow at a CAGR of 5.3% during 2025-2029 .

                Paint Pump market is segmented by Type( Pneumatic pump, Electric pump, Hydraulic pump) Product Type( Piston pump, Positive displacement pump, Diaphragm pump) Power Output( Medium, High, Low)

                ANEST IWATA USA Inc, Argal Srl, Codinter Inc, DSTech Co. Ltd., Fluimac S.r.l., Graco Inc., Krautzberger GmbH, Larius S.r.l, PSG Dover, Sagola, SAMES, SATA GmbH and Co. KG, Smart Coatings Equipments, Sulzer Ltd., V. R. Coatings Pvt. Ltd., Verder Liquids are a few of the key vendors in the Paint Pump market.

                APAC will register the highest growth rate of 39% among the other regions. Therefore, the Paint Pump market in APAC is expected to garner significant business opportunities for the vendors during the forecast period.

                US, China, Germany, India, UK, Japan, Brazil, South Korea, France, Canada

                • Growing demand for high-quality coatingsThe growing demand for high-quality coatings is one of the primary drivers behind the expansion of the global paint pump market. Industries such as construction is the driving factor this market.
                • automotive is the driving factor this market.
                • aerospace is the driving factor this market.
                • and consumer goods are increasingly focused on achieving superior surface finishes that enhance both the aesthetic appeal and durability of products. High-quality coatings not only improve appearance but also provide vital protection against environmental elements like moisture is the driving factor this market.
                • UV rays is the driving factor this market.
                • and corrosion. As a result is the driving factor this market.
                • there is a heightened emphasis on precision in paint application is the driving factor this market.
                • which drives the need for efficient and reliable equipment like paint pumps. Paint pumps play a critical role in ensuring the even and consistent application of coatings. In industries where product quality and performance are paramount is the driving factor this market.
                • such as in the automotive sector is the driving factor this market.
                • achieving a flawless finish is essential for consumer satisfaction and brand reputation. Advanced paint pumps is the driving factor this market.
                • such as airless and diaphragm models is the driving factor this market.
                • enable manufacturers to achieve high-quality is the driving factor this market.
                • uniform coatings at a faster pace while reducing material waste. This is particularly important in industries that deal with expensive or specialty coatings is the driving factor this market.
                • where maximizing the efficiency of every drop of paint is crucial. As consumer expectations for quality continue to rise is the driving factor this market.
                • manufacturers are increasingly turning to state-of-the-art paint pumps to meet these demands is the driving factor this market.
                • further driving market growth. Additionally is the driving factor this market.
                • the growing trend toward premium products in consumer sectors also elevates the need for superior coating is the driving factor this market.
                • thus boosting the demand for advanced paint pumping technologies. is the driving factor this market.

                The Paint Pump market vendors should focus on grabbing business opportunities from the Pneumatic pump segment as it accounted for the largest market share in the base year.