Partner Relationship Management (Prm) Market Analysis North America, APAC, Europe, Middle East and Africa, South America - US, China, UK, Japan, Germany - Size and Forecast 2024-2028

Partner Relationship Management (Prm) Market Analysis North America, APAC, Europe, Middle East and Africa, South America - US, China, UK, Japan, Germany - Size and Forecast 2024-2028

Published: Jul 2024 151 Pages SKU: IRTNTR74963

Market Overview at a Glance

$81.24 B
Market Opportunity
16.98%
CAGR
15.98
YoY growth 2023-2024(%)

Partner Relationship Management (PRM) Market Size 2024-2028

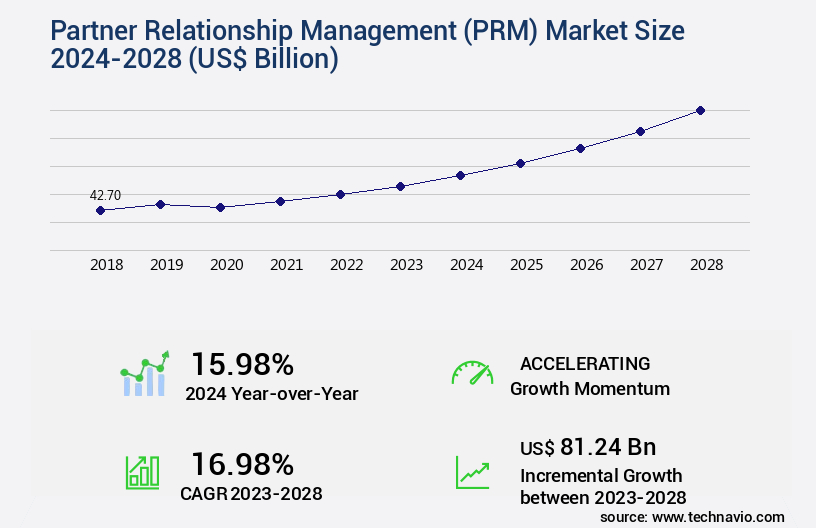
The partner relationship management (PRM) market size is valued to increase USD 81.24 billion, at a CAGR of 16.98% from 2023 to 2028. Focus on customer engagement will drive the partner relationship management (PRM) market.

Major Market Trends & Insights

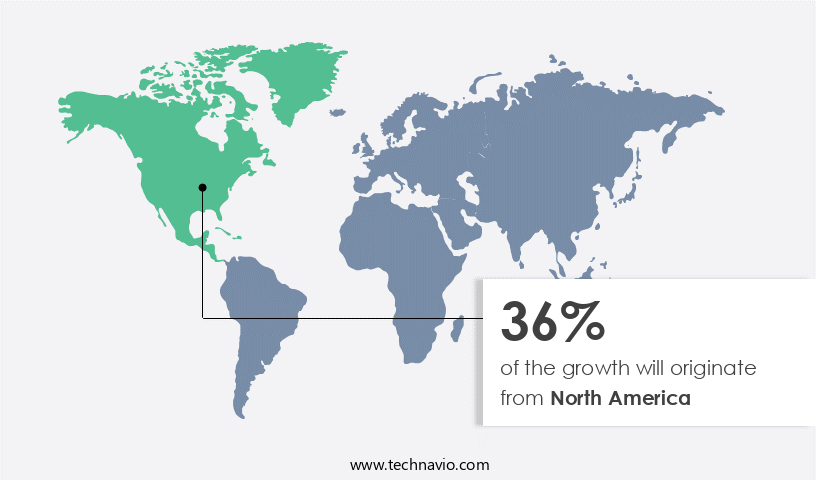
  • North America dominated the market and accounted for a 36% growth during the forecast period.
  • By Component - Solution segment was valued at USD 25.23 billion in 2022
  • By Deployment - On-premise segment accounted for the largest market revenue share in 2022

Market Size & Forecast

  • Market Opportunities: USD 250.09 billion
  • Market Future Opportunities: USD 81241.50 billion
  • CAGR from 2023 to 2028 : 16.98%

Market Summary

  • The market encompasses a dynamic and continuously evolving landscape of technologies and applications designed to streamline and optimize business partnerships. Core technologies, such as artificial intelligence (AI) and machine learning, are increasingly integrated into PRM solutions, enabling advanced customer engagement and automated workflows. According to recent studies, the adoption rate of AI in PRM is projected to reach 70% by 2025, underscoring its growing importance. Service types or product categories within PRM span from traditional solutions offering basic partner portal access to comprehensive suites encompassing lead distribution, deal registration, and joint marketing campaigns. Despite these advancements, data security concerns remain a significant challenge, with 58% of businesses citing partner data security as a top concern.
  • Regulatory compliance, particularly in regions like Europe and North America, also plays a crucial role in shaping the PRM market. As the market continues to unfold, partnerships that effectively leverage technology, prioritize customer engagement, and address data security concerns will thrive.

What will be the Size of the Partner Relationship Management (PRM) Market during the forecast period?

Partner Relationship Management (PRM) Market Size

Get Key Insights on Market Forecast (PDF) Request Free Sample

How is the Partner Relationship Management (PRM) Market Segmented ?

The partner relationship management (PRM) industry research report provides comprehensive data (region-wise segment analysis), with forecasts and estimates in "USD billion" for the period 2024-2028, as well as historical data from 2018-2022 for the following segments.

  • Component
    • Solution
    • Service
  • Deployment
    • On-premise
    • Cloud
  • Geography
    • North America
      • US
      • Canada
    • Europe
      • Germany
      • UK
    • APAC
      • China
      • Japan
    • Rest of World (ROW)

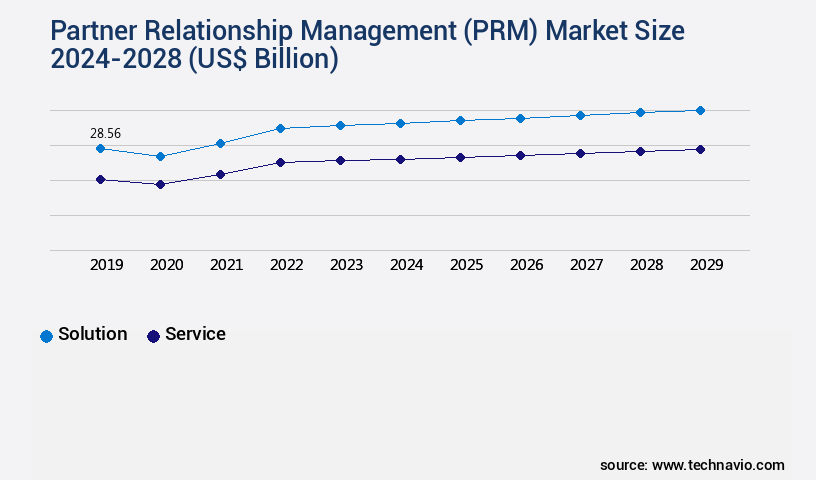
By Component Insights

The solution segment is estimated to witness significant growth during the forecast period.

Partner Relationship Management (PRM) solutions are essential tools for businesses seeking to optimize their partnerships and drive growth. These solutions encompass a range of components designed to streamline and enhance various aspects of the partner relationship lifecycle. A comprehensive PRM solution may include partner portals, which serve as centralized hubs for partners, offering access to resources, training materials, marketing collateral, and deal tracking tools. Lead management is another critical component, enabling companies to capture, nurture, and effectively manage leads from partners. Performance tracking is essential for measuring and evaluating partner performance, while commission management tools ensure accurate and timely commission payments.

Partner onboarding is another crucial aspect, with tools designed to efficiently onboard new partners and provide them with the necessary resources and support. Collaborative sales tools facilitate co-selling and channel conflict resolution, while partner loyalty programs help foster long-term relationships. Partner recruitment processes are also streamlined through PRM solutions, with features such as partner segmentation strategies, deal registration processes, and incentive program management. Additionally, PRM solutions offer partner training modules, partner community building, sales performance tracking, partner profitability metrics, partner ecosystem development, and channel management software. These tools enable businesses to effectively manage their partner relationships, measure customer success, and optimize revenue attribution models through data analytics dashboards and contract management systems.

Partner self-service portals and communication tools further enhance the partner experience, ensuring a productive and collaborative partnership.

Partner Relationship Management (PRM) Market Size

Request Free Sample

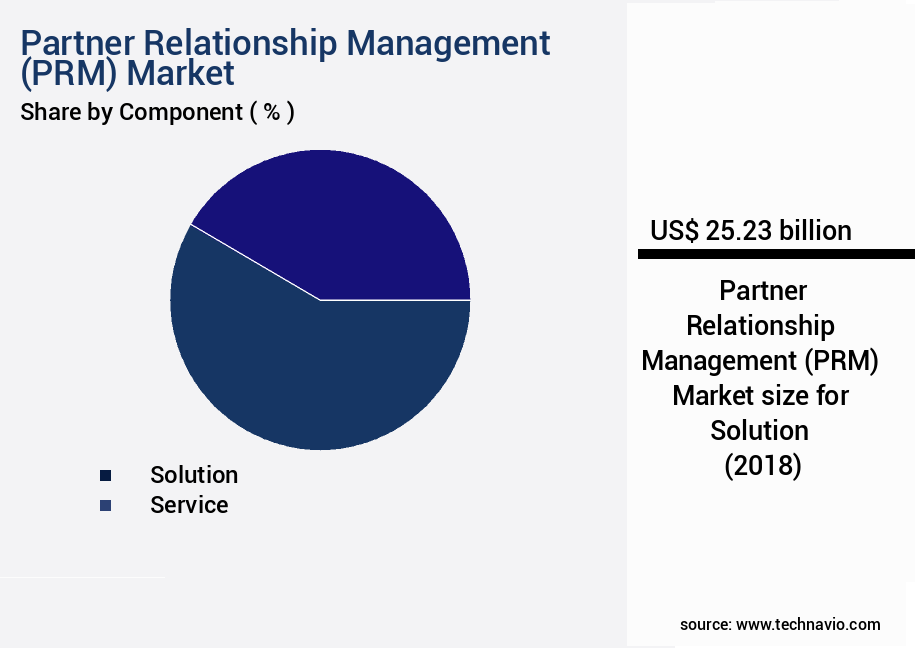
The Solution segment was valued at USD 25.23 billion in 2018 and showed a gradual increase during the forecast period.

Partner Relationship Management (PRM) Market Size

Request Free Sample

Regional Analysis

North America is estimated to contribute 36% to the growth of the global market during the forecast period.Technavio's analysts have elaborately explained the regional trends and drivers that shape the market during the forecast period.

Partner Relationship Management (PRM) Market Share by Geography

See How Partner Relationship Management (PRM) Market Demand is Rising in North America Request Free Sample

In North America, the adoption of partner relationship management (PRM) technology has experienced significant growth, with over 70% of companies now utilizing it to enhance their partnership interactions. This trend is driven by the increasing recognition of effective partnership management as a crucial factor in business expansion and success. PRM in North America encompasses the management and optimization of relationships with essential third-party organizations. The use of cloud-based PRM systems has become increasingly popular due to their flexibility and efficiency.

This burgeoning market reflects the evolving business landscape and the growing significance of strategic partnerships in driving growth and success for North American businesses.

Market Dynamics

Our researchers analyzed the data with 2023 as the base year, along with the key drivers, trends, and challenges. A holistic analysis of drivers will help companies refine their marketing strategies to gain a competitive advantage.

The market encompasses a range of tools and strategies that businesses employ to optimize interactions with their partners, fostering collaboration, increasing efficiency, and driving growth. A key aspect of PRM is the design of partner portals, which offer seamless user experiences, enabling co-selling strategies, automated onboarding, and effective communication channels. Integrating PRM with CRM systems is crucial for measuring partner program effectiveness and optimizing sales enablement. Partner incentive programs, customized training, and compliance requirements are essential components of PRM strategy. The adoption of PRM solutions has seen significant growth, with more than 70% of companies reporting improved partner onboarding workflows.

Partner portal analytics and reporting play a vital role in measuring partner program ROI and identifying areas for optimization. Partner relationship automation tools and customization options have become essential for building successful partner ecosystems. The industrial application segment accounts for a significantly larger share of the PRM market compared to the academic segment, as businesses in industrial sectors increasingly recognize the value of strategic partnerships. Implementing PRM software poses challenges, including data integration, customization, and ensuring effective communication channels. Effective partner communication is critical, with more than 80% of businesses citing it as a top challenge in their partner programs.

Despite these challenges, the benefits of PRM are clear: improved partner engagement, increased sales, and a more efficient and effective partner ecosystem.

Partner Relationship Management (PRM) Market Size

What are the key market drivers leading to the rise in the adoption of Partner Relationship Management (PRM) Industry?

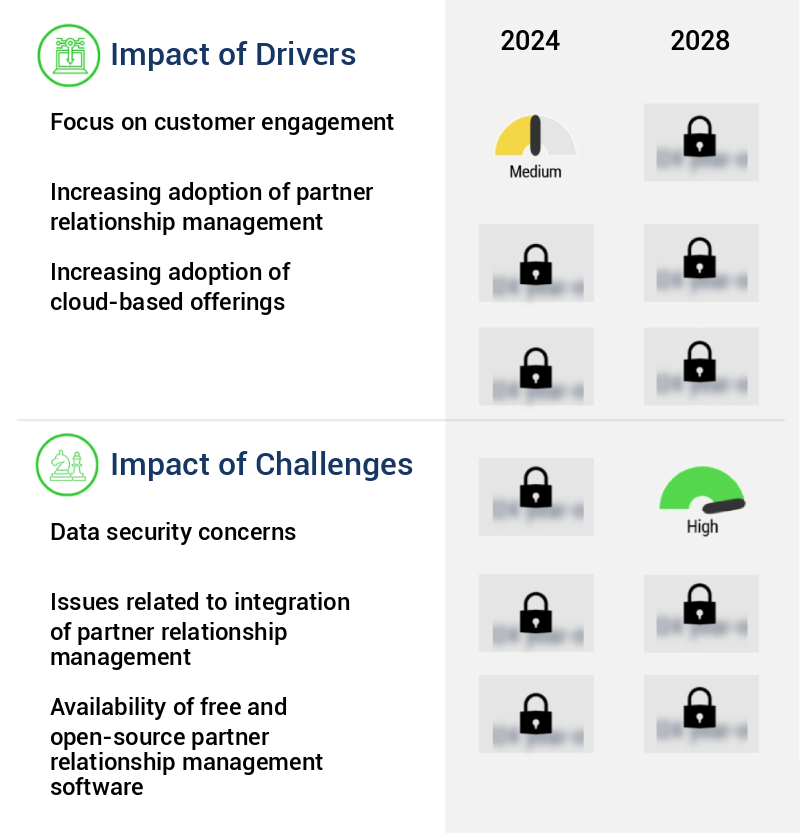
  • The focus on customer engagement is a crucial factor in driving market success. By prioritizing customer needs and interactions, businesses can build strong relationships and increase loyalty, ultimately leading to growth and profitability. 
  • Partner relationship management (PRM) plays a pivotal role in fostering long-term customer associations, contributing significantly to business growth. By effectively managing partnerships, companies can enhance customer engagement, boost sales, and build brand reputation. PRM facilitates seamless communication of latest offers to both existing and potential customers, creating opportunities for increased revenue through reselling. This approach not only reduces marketing expenses but also strengthens consumer trust.
  • Major corporations have embraced PRM, recognizing its potential to address day-to-day customer concerns, thereby saving organizational resources and time. The continuous evolution of PRM is shaping its applications across various sectors, underlining its importance in today's business landscape.

What are the market trends shaping the Partner Relationship Management (PRM) Industry?

  • The integration of artificial intelligence (AI) is becoming a prominent trend in partner relationship management. AI's implementation is transforming the partner ecosystem, enhancing efficiency and effectiveness.
  • Artificial Intelligence (AI) is revolutionizing partner relationship management by automating tasks and providing valuable insights. Predictive analytics is one application of AI, enabling the identification of patterns and trends in partnership data to make informed decisions. For instance, AI can analyze historical data to predict potential partnership performance, allowing companies to proactively address issues and optimize relationships. Automated workflows are another area of integration, with AI handling routine tasks such as lead generation, partner onboarding, and performance tracking.
  • This automation frees up resources for strategic activities, enhancing overall partnership management efficiency. AI's ability to process vast amounts of data and provide actionable insights makes it an indispensable tool for businesses seeking to maximize the value of their partnerships.

What challenges does the Partner Relationship Management (PRM) Industry face during its growth?

  • Data security concerns represent a significant challenge to the industry's growth, as ensuring the protection of sensitive information is a mandatory requirement for businesses to maintain their reputation and trust with customers. 
  • Enterprises, both large and small, are increasingly adopting Software as a Service (SaaS) solutions due to their cost-effective nature, flexibility, scalability, and user-friendly interface. SaaS offers quick access to software applications without the need for significant upfront investments or infrastructure. However, the adoption of SaaS is not without challenges. Security and privacy concerns are at the forefront, as cyberattacks continue to pose a significant threat to businesses of all sizes. According to recent studies, SMEs are disproportionately targeted, accounting for over 60% of reported cyberattacks.
  • These attacks can result in substantial revenue losses and production disruptions. The absence of robust IT security infrastructure and limited budgets make SMEs particularly vulnerable to threats such as ransomware and data breaches. Despite these challenges, the benefits of SaaS continue to outweigh the risks, making it a preferred choice for businesses seeking to streamline their operations and remain competitive in today's digital landscape.

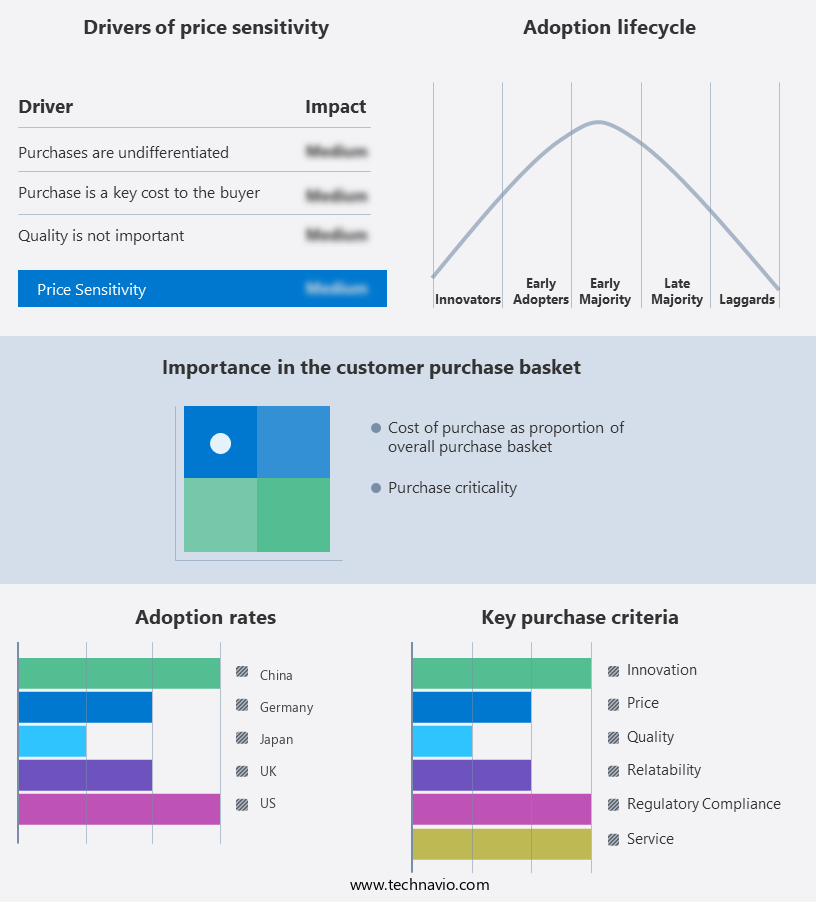
Exclusive Technavio Analysis on Customer Landscape

The partner relationship management (prm) market forecasting report includes the adoption lifecycle of the market, covering from the innovator's stage to the laggard's stage. It focuses on adoption rates in different regions based on penetration. Furthermore, the partner relationship management (prm) market report also includes key purchase criteria and drivers of price sensitivity to help companies evaluate and develop their market growth analysis strategies.

Partner Relationship Management (PRM) Market Share by Geography

 Customer Landscape of Partner Relationship Management (PRM) Industry

Competitive Landscape

Companies are implementing various strategies, such as strategic alliances, partner relationship management (prm) market forecast, partnerships, mergers and acquisitions, geographical expansion, and product/service launches, to enhance their presence in the industry.

Affise Technologies Ltd. - This company specializes in partner relationship management solutions, encompassing Partner Co-Marketing, Co-Selling, Deal Management, and Recruitment. These offerings streamline collaboration with business partners, enhancing sales effectiveness and fostering strategic alliances.

The industry research and growth report includes detailed analyses of the competitive landscape of the market and information about key companies, including:

  • Affise Technologies Ltd.
  • Allbound Inc.
  • AppDirect Inc.
  • Channeltivity LLC
  • ChannelXperts GmbH
  • Crossbeam Inc.
  • Everflow Technologies Inc.
  • Impartner Inc.
  • IntroCept Pty Ltd.
  • KIFLO co. SAS
  • LogicBay Corp.
  • Mindmatrix Inc.
  • Oracle Corp.
  • PartnerPortal.io Inc.
  • PartnerStack Inc.
  • PartnerTap Inc.
  • Reveal SAS
  • Salesforce Inc.
  • Zift Solutions Inc.
  • ZINFI Technologies Inc.

Qualitative and quantitative analysis of companies has been conducted to help clients understand the wider business environment as well as the strengths and weaknesses of key industry players. Data is qualitatively analyzed to categorize companies as pure play, category-focused, industry-focused, and diversified; it is quantitatively analyzed to categorize companies as dominant, leading, strong, tentative, and weak.

Recent Development and News in Partner Relationship Management (PRM) Market

  • In January 2024, Salesforce announced the launch of its new PRM solution, Salesforce Partner Community, designed to help businesses manage and engage with their partner networks more effectively (Salesforce Press Release). This cloud-based platform enables real-time collaboration, customizable partner portals, and automated workflows, addressing the evolving needs of the PRM market.
  • In March 2024, Microsoft and SAP signed a strategic partnership agreement to integrate Microsoft's Dynamics 365 with SAP's Ariba Network, enhancing their PRM offerings (Microsoft News Center). This collaboration aimed to streamline the B2B buying process and improve collaboration between buyers and sellers, providing a more seamless experience for both parties.
  • In May 2024, Zoho Corporation raised USD250 million in a funding round, with a significant portion allocated to the development and expansion of its PRM solution, Zoho One (Zoho Press Release). This investment allowed Zoho to strengthen its market presence and enhance its offerings, competing more effectively against established PRM companies.
  • In February 2025, IBM and Red Hat announced their merger, creating a powerful force in the PRM market (IBM Press Release). This union brought together IBM's extensive industry expertise and Red Hat's open-source technology, enabling the development of innovative PRM solutions and services for businesses worldwide.

Dive into Technavio's robust research methodology, blending expert interviews, extensive data synthesis, and validated models for unparalleled Partner Relationship Management (PRM) Market insights. See full methodology.

Market Scope

Report Coverage

Details

Page number

151

Base year

2023

Historic period

2018-2022

Forecast period

2024-2028

Growth momentum & CAGR

Accelerate at a CAGR of 16.98%

Market growth 2024-2028

USD 81.24 billion

Market structure

Fragmented

YoY growth 2023-2024(%)

15.98

Key countries

US, China, UK, Japan, Germany, and Canada

Competitive landscape

Leading Companies, Market Positioning of Companies, Competitive Strategies, and Industry Risks

Request Free Sample

Research Analyst Overview

  • Partner Relationship Management (PRM) continues to evolve as businesses recognize the importance of fostering strong partnerships. This dynamic market encompasses a range of solutions designed to optimize partner engagement, performance, and collaboration. Partner performance dashboards provide real-time insights into partner activities, enabling businesses to track progress and identify areas for improvement. Marketing Resource Management (MRM) systems streamline marketing efforts, ensuring consistent brand messaging and efficient use of resources. Partner loyalty programs and co-selling tools strengthen relationships by incentivizing collaboration and joint sales efforts. Partner Program ROI analysis and Partner Lifecycle Management help businesses maximize the value of their partnerships.
  • PRM solutions also offer Partner Portal Features, automating processes and enhancing communication. Sales Enablement Platforms provide access to training modules and sales performance tracking, while Partner Engagement Strategies foster collaboration and boost productivity. Collaborative sales tools and Partner Recruitment Processes streamline the onboarding of new partners. Partner Technology Platforms and Channel Management Software facilitate seamless integration and revenue attribution. Data Analytics Dashboards and Knowledge Base Management enable businesses to gain valuable insights, while Lead Management Systems and Deal Tracking Software optimize the sales process. Compliance and Governance tools ensure adherence to regulations, and Contract Management Systems streamline agreement processes.
  • Partner Self-Service Portals and Partner Communication Tools enhance the partner experience, while Channel Conflict Resolution mechanisms maintain a harmonious ecosystem. Partner Portal Integrations expand functionality and improve overall efficiency. In the ever-evolving PRM landscape, businesses can leverage these solutions to build strong, profitable partnerships and maintain a competitive edge.

What are the Key Data Covered in this Partner Relationship Management (PRM) Market Research and Growth Report?

  • What is the expected growth of the Partner Relationship Management (PRM) Market between 2024 and 2028?

    • USD 81.24 billion, at a CAGR of 16.98%

  • What segmentation does the market report cover?

    • The report is segmented by Component (Solution and Service), Deployment (On-premise and Cloud), and Geography (North America, APAC, Europe, Middle East and Africa, and South America)

  • Which regions are analyzed in the report?

    • North America, APAC, Europe, Middle East and Africa, and South America

  • What are the key growth drivers and market challenges?

    • Focus on customer engagement, Data security concerns

  • Who are the major players in the Partner Relationship Management (PRM) Market?

    • Affise Technologies Ltd., Allbound Inc., AppDirect Inc., Channeltivity LLC, ChannelXperts GmbH, Crossbeam Inc., Everflow Technologies Inc., Impartner Inc., IntroCept Pty Ltd., KIFLO co. SAS, LogicBay Corp., Mindmatrix Inc., Oracle Corp., PartnerPortal.io Inc., PartnerStack Inc., PartnerTap Inc., Reveal SAS, Salesforce Inc., Zift Solutions Inc., and ZINFI Technologies Inc.

Market Research Insights

  • The market encompasses a range of solutions designed to streamline and optimize interactions between businesses and their partners. Two key aspects of PRM are partner portal design and security. According to industry estimates, the global market size for PRM is projected to reach USD12.5 billion by 2026, growing at a compound annual growth rate (CAGR) of 13%. This expansion underscores the increasing importance of effective PRM strategies. Partner portal design plays a crucial role in the success of PRM, with user-friendly interfaces and seamless access to critical information enhancing partner engagement.
  • In contrast, partner portal security is equally essential, with 80% of companies reporting that security is a top priority when selecting a PRM solution. This highlights the need for robust partner portal security features to protect sensitive data and maintain trust within the partner ecosystem.

We can help! Our analysts can customize this partner relationship management (prm) market research report to meet your requirements.

Get in touch

1 Executive Summary

  • 1.1 Market overview
    • Executive Summary - Chart on Market Overview
    • Executive Summary - Data Table on Market Overview
    • Executive Summary - Chart on Global Market Characteristics
    • Executive Summary - Chart on Market by Geography
    • Executive Summary - Chart on Market Segmentation by Component
    • Executive Summary - Chart on Market Segmentation by Deployment
    • Executive Summary - Chart on Incremental Growth
    • Executive Summary - Data Table on Incremental Growth
    • Executive Summary - Chart on Company Market Positioning

2 Market Landscape

  • 2.1 Market ecosystem
    • Parent Market
    • Data Table on - Parent Market
  • 2.2 Market characteristics
    • Market characteristics analysis
  • 2.3 Value chain analysis
    • Value Chain Analysis

3 Market Sizing

  • 3.1 Market definition
    • Offerings of companies included in the market definition
  • 3.2 Market segment analysis
    • Market segments
  • 3.3 Market size 2023
    • 3.4 Market outlook: Forecast for 2023-2028
      • Chart on Global - Market size and forecast 2023-2028 ($ million)
      • Data Table on Global - Market size and forecast 2023-2028 ($ million)
      • Chart on Global Market: Year-over-year growth 2023-2028 (%)
      • Data Table on Global Market: Year-over-year growth 2023-2028 (%)

    4 Historic Market Size

    • 4.1 Global Partner Relationship Management (PRM) Market 2018 - 2022
      • Historic Market Size - Data Table on Global Partner Relationship Management (PRM) Market 2018 - 2022 ($ million)
    • 4.2 Component segment analysis 2018 - 2022
      • Historic Market Size - Component Segment 2018 - 2022 ($ million)
    • 4.3 Deployment segment analysis 2018 - 2022
      • Historic Market Size - Deployment Segment 2018 - 2022 ($ million)
    • 4.4 Geography segment analysis 2018 - 2022
      • Historic Market Size - Geography Segment 2018 - 2022 ($ million)
    • 4.5 Country segment analysis 2018 - 2022
      • Historic Market Size - Country Segment 2018 - 2022 ($ million)

    5 Five Forces Analysis

    • 5.1 Five forces summary
      • Five forces analysis - Comparison between 2023 and 2028
    • 5.2 Bargaining power of buyers
      • Bargaining power of buyers - Impact of key factors 2023 and 2028
    • 5.3 Bargaining power of suppliers
      • Bargaining power of suppliers - Impact of key factors in 2023 and 2028
    • 5.4 Threat of new entrants
      • Threat of new entrants - Impact of key factors in 2023 and 2028
    • 5.5 Threat of substitutes
      • Threat of substitutes - Impact of key factors in 2023 and 2028
    • 5.6 Threat of rivalry
      • Threat of rivalry - Impact of key factors in 2023 and 2028
    • 5.7 Market condition
      • Chart on Market condition - Five forces 2023 and 2028

    6 Market Segmentation by Component

    • 6.1 Market segments
      • Chart on Component - Market share 2023-2028 (%)
      • Data Table on Component - Market share 2023-2028 (%)
    • 6.2 Comparison by Component
      • Chart on Comparison by Component
      • Data Table on Comparison by Component
    • 6.3 Solution - Market size and forecast 2023-2028
      • Chart on Solution - Market size and forecast 2023-2028 ($ million)
      • Data Table on Solution - Market size and forecast 2023-2028 ($ million)
      • Chart on Solution - Year-over-year growth 2023-2028 (%)
      • Data Table on Solution - Year-over-year growth 2023-2028 (%)
    • 6.4 Service - Market size and forecast 2023-2028
      • Chart on Service - Market size and forecast 2023-2028 ($ million)
      • Data Table on Service - Market size and forecast 2023-2028 ($ million)
      • Chart on Service - Year-over-year growth 2023-2028 (%)
      • Data Table on Service - Year-over-year growth 2023-2028 (%)
    • 6.5 Market opportunity by Component
      • Market opportunity by Component ($ million)
      • Data Table on Market opportunity by Component ($ million)

    7 Market Segmentation by Deployment

    • 7.1 Market segments
      • Chart on Deployment - Market share 2023-2028 (%)
      • Data Table on Deployment - Market share 2023-2028 (%)
    • 7.2 Comparison by Deployment
      • Chart on Comparison by Deployment
      • Data Table on Comparison by Deployment
    • 7.3 On-premises - Market size and forecast 2023-2028
      • Chart on On-premises - Market size and forecast 2023-2028 ($ million)
      • Data Table on On-premises - Market size and forecast 2023-2028 ($ million)
      • Chart on On-premises - Year-over-year growth 2023-2028 (%)
      • Data Table on On-premises - Year-over-year growth 2023-2028 (%)
    • 7.4 Cloud - Market size and forecast 2023-2028
      • Chart on Cloud - Market size and forecast 2023-2028 ($ million)
      • Data Table on Cloud - Market size and forecast 2023-2028 ($ million)
      • Chart on Cloud - Year-over-year growth 2023-2028 (%)
      • Data Table on Cloud - Year-over-year growth 2023-2028 (%)
    • 7.5 Market opportunity by Deployment
      • Market opportunity by Deployment ($ million)
      • Data Table on Market opportunity by Deployment ($ million)

    8 Customer Landscape

    • 8.1 Customer landscape overview
      • Analysis of price sensitivity, lifecycle, customer purchase basket, adoption rates, and purchase criteria

    9 Geographic Landscape

    • 9.1 Geographic segmentation
      • Chart on Market share by geography 2023-2028 (%)
      • Data Table on Market share by geography 2023-2028 (%)
    • 9.2 Geographic comparison
      • Chart on Geographic comparison
      • Data Table on Geographic comparison
    • 9.3 North America - Market size and forecast 2023-2028
      • Chart on North America - Market size and forecast 2023-2028 ($ million)
      • Data Table on North America - Market size and forecast 2023-2028 ($ million)
      • Chart on North America - Year-over-year growth 2023-2028 (%)
      • Data Table on North America - Year-over-year growth 2023-2028 (%)
    • 9.4 APAC - Market size and forecast 2023-2028
      • Chart on APAC - Market size and forecast 2023-2028 ($ million)
      • Data Table on APAC - Market size and forecast 2023-2028 ($ million)
      • Chart on APAC - Year-over-year growth 2023-2028 (%)
      • Data Table on APAC - Year-over-year growth 2023-2028 (%)
    • 9.5 Europe - Market size and forecast 2023-2028
      • Chart on Europe - Market size and forecast 2023-2028 ($ million)
      • Data Table on Europe - Market size and forecast 2023-2028 ($ million)
      • Chart on Europe - Year-over-year growth 2023-2028 (%)
      • Data Table on Europe - Year-over-year growth 2023-2028 (%)
    • 9.6 Middle East and Africa - Market size and forecast 2023-2028
      • Chart on Middle East and Africa - Market size and forecast 2023-2028 ($ million)
      • Data Table on Middle East and Africa - Market size and forecast 2023-2028 ($ million)
      • Chart on Middle East and Africa - Year-over-year growth 2023-2028 (%)
      • Data Table on Middle East and Africa - Year-over-year growth 2023-2028 (%)
    • 9.7 South America - Market size and forecast 2023-2028
      • Chart on South America - Market size and forecast 2023-2028 ($ million)
      • Data Table on South America - Market size and forecast 2023-2028 ($ million)
      • Chart on South America - Year-over-year growth 2023-2028 (%)
      • Data Table on South America - Year-over-year growth 2023-2028 (%)
    • 9.8 US - Market size and forecast 2023-2028
      • Chart on US - Market size and forecast 2023-2028 ($ million)
      • Data Table on US - Market size and forecast 2023-2028 ($ million)
      • Chart on US - Year-over-year growth 2023-2028 (%)
      • Data Table on US - Year-over-year growth 2023-2028 (%)
    • 9.9 China - Market size and forecast 2023-2028
      • Chart on China - Market size and forecast 2023-2028 ($ million)
      • Data Table on China - Market size and forecast 2023-2028 ($ million)
      • Chart on China - Year-over-year growth 2023-2028 (%)
      • Data Table on China - Year-over-year growth 2023-2028 (%)
    • 9.10 UK - Market size and forecast 2023-2028
      • Chart on UK - Market size and forecast 2023-2028 ($ million)
      • Data Table on UK - Market size and forecast 2023-2028 ($ million)
      • Chart on UK - Year-over-year growth 2023-2028 (%)
      • Data Table on UK - Year-over-year growth 2023-2028 (%)
    • 9.11 Japan - Market size and forecast 2023-2028
      • Chart on Japan - Market size and forecast 2023-2028 ($ million)
      • Data Table on Japan - Market size and forecast 2023-2028 ($ million)
      • Chart on Japan - Year-over-year growth 2023-2028 (%)
      • Data Table on Japan - Year-over-year growth 2023-2028 (%)
    • 9.12 Germany - Market size and forecast 2023-2028
      • Chart on Germany - Market size and forecast 2023-2028 ($ million)
      • Data Table on Germany - Market size and forecast 2023-2028 ($ million)
      • Chart on Germany - Year-over-year growth 2023-2028 (%)
      • Data Table on Germany - Year-over-year growth 2023-2028 (%)
    • 9.13 Market opportunity by geography
      • Market opportunity by geography ($ million)
      • Data Tables on Market opportunity by geography ($ million)
    • 9.14 US - Market size and forecast (2023-2028)
      • Chart on US - Market size and forecast (2023-2028) ($ million)
      • Data Table on US - Market size and forecast (2023-2028) ($ million)
      • Chart on US - Year-over-year growth (2023-2028) (%)
      • Data Table on US - Year-over-year growth (2023-2028) (%)
    • 9.15 China - Market size and forecast (2023-2028)
      • Chart on China - Market size and forecast (2023-2028) ($ million)
      • Data Table on China - Market size and forecast (2023-2028) ($ million)
      • Chart on China - Year-over-year growth (2023-2028) (%)
      • Data Table on China - Year-over-year growth (2023-2028) (%)
    • 9.16 UK - Market size and forecast (2023-2028)
      • Chart on UK - Market size and forecast (2023-2028) ($ million)
      • Data Table on UK - Market size and forecast (2023-2028) ($ million)
      • Chart on UK - Year-over-year growth (2023-2028) (%)
      • Data Table on UK - Year-over-year growth (2023-2028) (%)
    • 9.17 Japan - Market size and forecast (2023-2028)
      • Chart on Japan - Market size and forecast (2023-2028) ($ million)
      • Data Table on Japan - Market size and forecast (2023-2028) ($ million)
      • Chart on Japan - Year-over-year growth (2023-2028) (%)
      • Data Table on Japan - Year-over-year growth (2023-2028) (%)
    • 9.18 Germany - Market size and forecast (2023-2028)
      • Chart on Germany - Market size and forecast (2023-2028) ($ million)
      • Data Table on Germany - Market size and forecast (2023-2028) ($ million)
      • Chart on Germany - Year-over-year growth (2023-2028) (%)
      • Data Table on Germany - Year-over-year growth (2023-2028) (%)

    10 Drivers, Challenges, and Opportunity/Restraints

    • 10.1 Market drivers
      • 10.2 Market challenges
        • 10.3 Impact of drivers and challenges
          • Impact of drivers and challenges in 2023 and 2028
        • 10.4 Market opportunities/restraints

          11 Competitive Landscape

          • 11.1 Overview
            • 11.2 Competitive Landscape
              • Overview on criticality of inputs and factors of differentiation
            • 11.3 Landscape disruption
              • Overview on factors of disruption
            • 11.4 Industry risks
              • Impact of key risks on business

            12 Competitive Analysis

            • 12.1 Companies profiled
              • Companies covered
            • 12.2 Market positioning of companies
              • Matrix on companies position and classification
            • 12.3 Allbound Inc.
              • Allbound Inc. - Overview
              • Allbound Inc. - Product / Service
              • Allbound Inc. - Key offerings
            • 12.4 AppDirect Inc.
              • AppDirect Inc. - Overview
              • AppDirect Inc. - Product / Service
              • AppDirect Inc. - Key offerings
            • 12.5 Channeltivity LLC
              • Channeltivity LLC - Overview
              • Channeltivity LLC - Product / Service
              • Channeltivity LLC - Key offerings
            • 12.6 ChannelXperts GmbH
              • ChannelXperts GmbH - Overview
              • ChannelXperts GmbH - Product / Service
              • ChannelXperts GmbH - Key offerings
            • 12.7 Crossbeam Inc.
              • Crossbeam Inc. - Overview
              • Crossbeam Inc. - Product / Service
              • Crossbeam Inc. - Key offerings
            • 12.8 Impartner Inc.
              • Impartner Inc. - Overview
              • Impartner Inc. - Product / Service
              • Impartner Inc. - Key offerings
            • 12.9 IntroCept Pty Ltd.
              • IntroCept Pty Ltd. - Overview
              • IntroCept Pty Ltd. - Product / Service
              • IntroCept Pty Ltd. - Key offerings
            • 12.10 KIFLO co. SAS
              • KIFLO co. SAS - Overview
              • KIFLO co. SAS - Product / Service
              • KIFLO co. SAS - Key offerings
            • 12.11 LogicBay Corp.
              • LogicBay Corp. - Overview
              • LogicBay Corp. - Product / Service
              • LogicBay Corp. - Key offerings
            • 12.12 Mindmatrix Inc.
              • Mindmatrix Inc. - Overview
              • Mindmatrix Inc. - Product / Service
              • Mindmatrix Inc. - Key offerings
            • 12.13 Oracle Corp.
              • Oracle Corp. - Overview
              • Oracle Corp. - Business segments
              • Oracle Corp. - Key news
              • Oracle Corp. - Key offerings
              • Oracle Corp. - Segment focus
            • 12.14 PartnerPortal.io Inc.
              • PartnerPortal.io Inc. - Overview
              • PartnerPortal.io Inc. - Product / Service
              • PartnerPortal.io Inc. - Key offerings
            • 12.15 Salesforce Inc.
              • Salesforce Inc. - Overview
              • Salesforce Inc. - Product / Service
              • Salesforce Inc. - Key news
              • Salesforce Inc. - Key offerings
            • 12.16 Zift Solutions Inc.
              • Zift Solutions Inc. - Overview
              • Zift Solutions Inc. - Product / Service
              • Zift Solutions Inc. - Key offerings
            • 12.17 ZINFI Technologies Inc.
              • ZINFI Technologies Inc. - Overview
              • ZINFI Technologies Inc. - Product / Service
              • ZINFI Technologies Inc. - Key offerings

            13 Appendix

            • 13.1 Scope of the report
              • 13.2 Inclusions and exclusions checklist
                • Inclusions checklist
                • Exclusions checklist
              • 13.3 Currency conversion rates for US$
                • Currency conversion rates for US$
              • 13.4 Research methodology
                • Research methodology
              • 13.5 Data procurement
                • Information sources
              • 13.6 Data validation
                • Data validation
              • 13.7 Validation techniques employed for market sizing
                • Validation techniques employed for market sizing
              • 13.8 Data synthesis
                • Data synthesis
              • 13.9 360 degree market analysis
                • 360 degree market analysis
              • 13.10 List of abbreviations
                • List of abbreviations

              Research Methodology

              Technavio presents a detailed picture of the market by way of study, synthesis, and summation of data from multiple sources. The analysts have presented the various facets of the market with a particular focus on identifying the key industry influencers. The data thus presented is comprehensive, reliable, and the result of extensive research, both primary and secondary.

              INFORMATION SOURCES

              Primary sources

              • Manufacturers and suppliers
              • Channel partners
              • Industry experts
              • Strategic decision makers

              Secondary sources

              • Industry journals and periodicals
              • Government data
              • Financial reports of key industry players
              • Historical data
              • Press releases

              DATA ANALYSIS

              Data Synthesis

              • Collation of data
              • Estimation of key figures
              • Analysis of derived insights

              Data Validation

              • Triangulation with data models
              • Reference against proprietary databases
              • Corroboration with industry experts

              REPORT WRITING

              Qualitative

              • Market drivers
              • Market challenges
              • Market trends
              • Five forces analysis

              Quantitative

              • Market size and forecast
              • Market segmentation
              • Geographical insights
              • Competitive landscape

              Interested in this report?

              Get your sample now to see our research methodology and insights!

              Download Now

              Frequently Asked Questions

              Partner Relationship Management (Prm) market growth will increase by $ 81.24 bn during 2024-2028 .

              The Partner Relationship Management (Prm) market is expected to grow at a CAGR of 16.98% during 2024-2028 .

              Partner Relationship Management (Prm) market is segmented by Component( Solution, Service) Deployment( On-premise, Cloud)

              Affise Technologies Ltd., Allbound Inc., AppDirect Inc., Channeltivity LLC, ChannelXperts GmbH, Crossbeam Inc., Everflow Technologies Inc., Impartner Inc., IntroCept Pty Ltd., KIFLO co. SAS, LogicBay Corp., Mindmatrix Inc., Oracle Corp., PartnerPortal.io Inc., PartnerStack Inc., PartnerTap Inc., Reveal SAS, Salesforce Inc., Zift Solutions Inc., ZINFI Technologies Inc. are a few of the key vendors in the Partner Relationship Management (Prm) market.

              North America will register the highest growth rate of 36% among the other regions. Therefore, the Partner Relationship Management (Prm) market in North America is expected to garner significant business opportunities for the vendors during the forecast period.

              US, China, UK, Japan, Germany, Canada

              • Focus on customer engagementCompanies are increasingly focusing on engaging customers and creating long-term associations with customers. This helps increase customer lifecycles is the driving factor this market.
              • and companies can generate revenue by reselling products/services. This saves the cost of marketing and builds trust among consumers.  Partner relationship management helps in the communication of the latest offers to both existing customers and potential customers. Moreover is the driving factor this market.
              • businesses can resolve day-to-day customer issues using partner relationship management. This saves cost and time for the organization and considerably improves customer engagement. Major organizations are using partner relationship management to improve customer engagement is the driving factor this market.
              • which is the driving factor this market.
              • in turn is the driving factor this market.
              • improves sales and helps to build the brand. Companies are increasingly concerned about customer satisfaction rates is the driving factor this market.
              • which have a large impact on the company's brand image. Thus is the driving factor this market.
              • the increasing focus on customer engagement will drive the demand for partner relationship management during the forecast period. is the driving factor this market.

              The Partner Relationship Management (Prm) market vendors should focus on grabbing business opportunities from the Solution segment as it accounted for the largest market share in the base year.