Passenger Vehicle Dashboard Camera Market Size and Trends
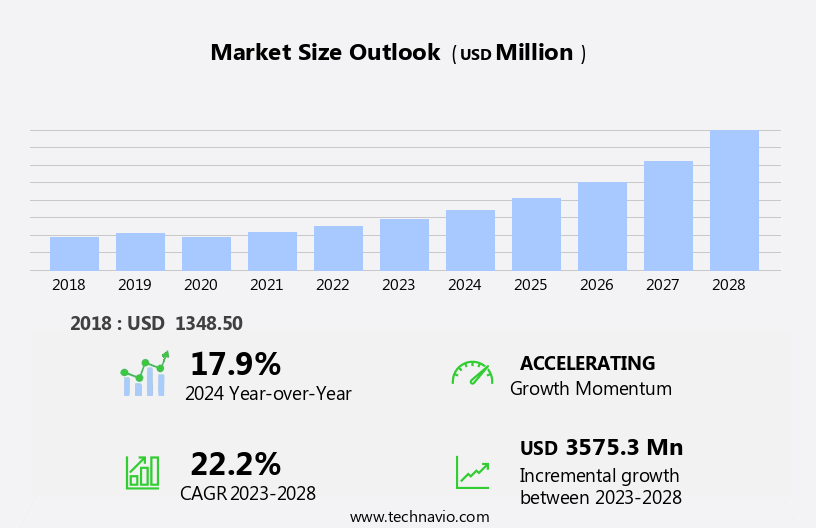
The passenger vehicle dashboard camera market size is forecast to increase by USD 3.58 billion, at a CAGR of 22.2% between 2023 and 2028. The market is witnessing significant growth due to the increasing prioritization of vehicle safety. Multi-channel dashboard cameras are gaining popularity as they offer enhanced features such as collision avoidance through forward collision warning systems. Energy efficiency is another key trend driving market growth, with manufacturers introducing power-saving technologies to extend battery life. However, inconsistent quality among dashboard cameras remains a challenge, as some models may fail to deliver clear footage during critical road mishaps. The public utility vehicle segment is expected to experience notable growth due to the heightened need for safety and accountability in this sector. Overall, the market is expected to continue expanding, providing opportunities for stakeholders to innovate and improve the functionality and reliability of dashboard cameras.
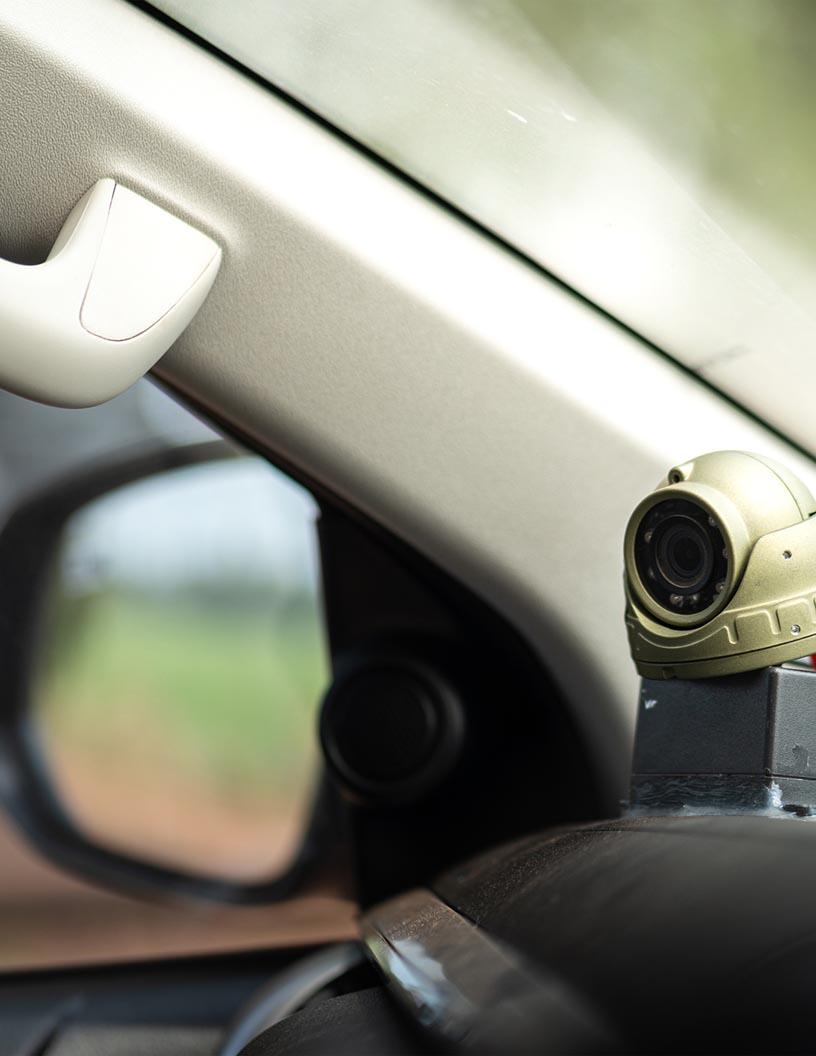
The market is witnessing significant growth due to the increasing demand for advanced safety and security features. These digital video recorders, also known as dashcams, have become an essential accessory for vehicle owners in the US. They offer numerous benefits, including capturing road incidents for insurance claims and legal proceedings, and providing an extra layer of safety during accidents. Dashboard cameras are becoming increasingly popular due to their ability to record real-time footage of the road ahead. This technology not only helps in preventing road mishaps but also provides valuable evidence during legal proceedings. In addition, the integration of artificial intelligence (AI) and vehicle telematics in dashcams has led to advanced features such as object detection, lane departure warning, blind spot detection, and collision avoidance. Cloud technology plays a crucial role in the functionality of modern dashcams. It enables real-time monitoring and automatic uploading of footage to the cloud for safekeeping. This feature is particularly useful for commercial vehicle owners, such as public utility vehicles, as it ensures the safety and security of their drivers and passengers. The integration of AI in dashcams has led to the development of sophisticated safety measures. For instance, forward collision warning systems alert drivers of potential collisions, allowing them to take evasive action. Similarly, object detection technology can detect and alert drivers of obstacles on the road, enhancing overall vehicle safety.
Dashboard cameras are not just limited to personal vehicles but are also being adopted by vehicle manufacturers to enhance safety and security features. Registration of these devices is mandatory in some states, making them a standard accessory in new vehicles. In conclusion, the market is witnessing growth due to the increasing demand for advanced safety and security features. These devices offer numerous benefits, including real-time recording of road incidents, evidence for insurance claims and legal proceedings, and advanced safety features such as object detection, lane departure warning, and collision avoidance. The integration of AI and cloud technology has further enhanced the functionality of dashcams, making them an essential accessory for vehicle owners.
Market Segmentation
The market research report provides comprehensive data (region-wise segment analysis), with forecasts and estimates in "USD billion" for the period 2024-2028, as well as historical data from 2018 - 2022 for the following segments.
- Product
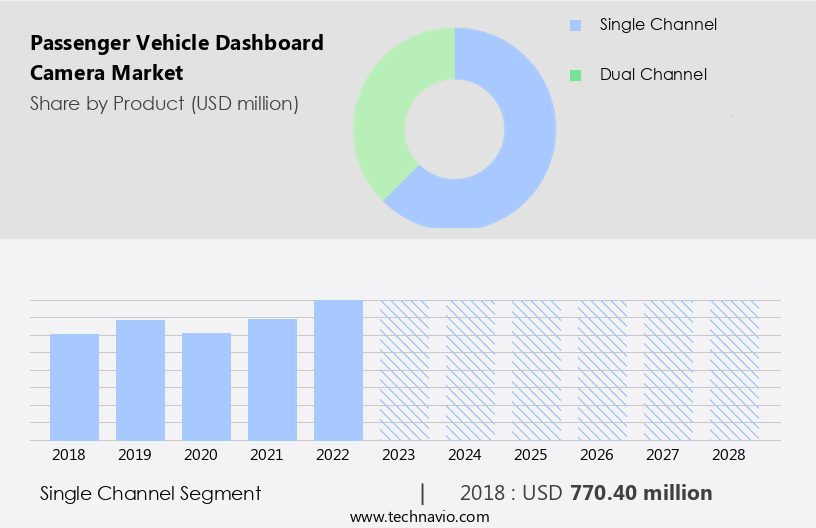
- Single channel
- Dual channel
- Component
- Battery
- Lens
- Gravity sensor
- GPS
- Others
- Geography
- APAC
- China
- India
- Japan
- South Korea
- Europe
- Germany
- UK
- France
- Italy
- North America
- Canada
- US
- South America
- Middle East and Africa
- APAC
By Product Insights
The single channel segment is estimated to witness significant growth during the forecast period. This expansion can be attributed to several factors, including the increasing prevalence of connected cars and the emergence of autonomous vehicles. Single channel dashboard cameras, in particular, are gaining traction. These cameras, favored for their simplicity and affordability, capture footage of the road ahead without the added complexity of dual channel systems. Their popularity is driven by increasing safety concerns and the rising number of road accidents.
Get a glance at the market share of various segments Download the PDF Sample
The single channel segment was valued at USD 777.40 million in 2018. Moreover, technological advancements, such as enhanced video quality options ranging from high definition to 4K, and features like GPS and Wi-Fi connectivity, make these cameras increasingly valuable for consumers seeking reliable evidence in case of accidents or disputes. The Land Transportation Office and commercial vehicle fleet operators also benefit from the use of dashboard cameras for monitoring and safety purposes. Smart technology continues to expand the capabilities of these devices, making them an essential tool for personal and commercial vehicles alike.
Regional Analysis
For more insights on the market share of various regions Download PDF Sample now!
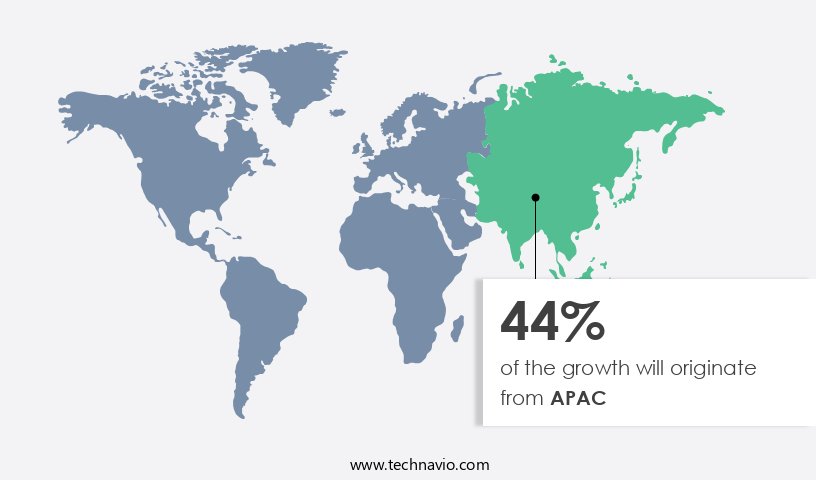
APAC is estimated to contribute 44% to the growth of the global market during the forecast period. Technavio's analysts have elaborately explained the regional trends and drivers that shape the market during the forecast period. Dashboard cameras, also known as dashcams, have gained significant popularity in the global market due to their role in ensuring safety and security for vehicle owners. These digital video recorders provide real-time monitoring of the road ahead, capturing crucial footage during road mishaps, accidents, legal proceedings, and insurance claims. The adoption of dashboard cameras is not limited to personal vehicles but extends to commercial vehicles, public utility vehicles (PUVs), and fleet monitoring. Advanced features such as artificial intelligence (AI), object detection, and real-time monitoring enhance the functionality of these devices. AI-enabled dashcams can detect and alert drivers of potential hazards, including lane departure warnings, blind spot detection, collision avoidance, and forward collision warning. The integration of cloud technology, IoT, and vehicle telematics enables remote access and real-time monitoring, offering peace of mind to vehicle owners. The increasing focus on vehicle safety and the growing concern for cybersecurity have led to the development of advanced features such as dual channel dashcams, HD cameras, and 4K cameras. The expansion of shipping charges, retail stores, and e-commerce platforms have made these video recording devices easily accessible to consumers. Dashboard cameras serve as an essential safety measure, providing proof in case of false claims and ensuring driver safety while monitoring behaviors on the road.
Our researchers analyzed the data with 2023 as the base year, along with the key drivers, trends, and challenges. A holistic analysis of drivers will help companies refine their marketing strategies to gain a competitive advantage.
Passenger Vehicle Dashboard Camera Market Driver
The increasing adoption of multi-channel dashboard cameras is notably driving market growth. Dashboard cameras have gained significant traction in the passenger vehicle market due to their ability to capture and record driving behavior and road incidents. These devices, equipped with features such as object detection and real-time monitoring, can help prevent collisions and ensure driver safety. Advanced single-channel dashboard cameras can even start recording video upon detecting movement or break-ins, acting as a deterrent against vandalism. However, there are limitations to the adoption of single-channel dashboard cameras. They are unable to capture rear-end collisions or activities inside the vehicles that cause accidents. Additionally, side or rear-end vandalism cannot be recorded.
To enhance the functionality of dashboard cameras, the integration of artificial intelligence (AI), vehicle telematics, cloud technology, and the Internet of Things (IoT) is becoming increasingly popular. AI-powered object detection and recognition systems can identify potential hazards and alert drivers in real-time, improving road safety. Cloud technology and IoT enable remote access to recorded footage and real-time monitoring, providing added convenience and peace of mind. However, with these advanced features come cybersecurity concerns, making it crucial for manufacturers to prioritize data security. In conclusion, dashboard cameras offer numerous benefits, including accident prevention and theft deterrence. However, they have limitations when it comes to capturing certain types of collisions and vandalism. To address these limitations, the integration of advanced technologies such as AI, telematics, cloud technology, and IoT is essential. While these features offer significant benefits, it is important to prioritize cybersecurity to protect sensitive data. Thus, such factors are driving the growth of the market during the forecast period.
Passenger Vehicle Dashboard Camera Market Trends
The introduction of energy-efficient dashboard cameras is the key trend in the market. Dashboard cameras, also known as dashcams, are essential components of modern passenger vehicles, continuously recording footage while driving and even when parked. These devices are connected to the power socket in the vehicle and capture video footage to ensure vehicle safety and document road mishaps. However, the frequent use of dashboard cameras, particularly when parked, can lead to issues such as drained batteries or the need for frequent battery replacements. To address these concerns, dashboard camera manufacturers have introduced energy-efficient models. These advanced devices are designed to minimize power consumption, ensuring a longer battery life and reducing the need for frequent replacements. By investing in energy-efficient dashboard cameras, vehicle owners can enhance their safety and peace of mind without the added hassle of frequent battery replacements.
In today's market, dashboard cameras come with advanced features such as collision avoidance and forward collision warning systems. These features are increasingly becoming popular among vehicle manufacturers to improve vehicle safety. Public utility vehicles (PUVs) and other commercial vehicles are also adopting dashboard cameras for added security and accountability. Registration and insurance companies may also require the use of dashboard cameras to document road incidents and ensure proper insurance claims. With the increasing importance of vehicle safety, the demand for dashboard cameras is expected to continue growing in the North American market. Thus, such trends will shape the growth of the market during the forecast period.
Passenger Vehicle Dashboard Camera Market Challenge
The inconsistent quality of automotive dashboard cameras is the major challenge that affects the growth of the market. Dashboard cameras, also known as Car DVRs, have gained significant traction in the passenger vehicle market, including both passenger cars and commercial vehicles. These devices come in various configurations, such as single-channel and multi-channel models. Single-channel dashcams feature one camera, typically positioned forward, recording video in a single direction. However, the increasing demand for enhanced safety measures and evidence collection in the event of accidents or vehicle theft has led to a growing preference for multi-channel dashcams, which incorporate two or more cameras.
Advanced driver assistance systems (ADAS) such as lane departure warning and blind spot detection are increasingly integrated into these multi-channel dashcams. These features not only improve driving safety but also provide valuable video evidence in case of incidents. The recorded footage can be crucial in insurance claims, serving as proof of fault by the other party. Consequently, dashboard camera manufacturers are focusing on producing multi-channel models to cater to this expanding market requirement. Hence, the above factors will impede the growth of the market during the forecast period
Exclusive Customer Landscape
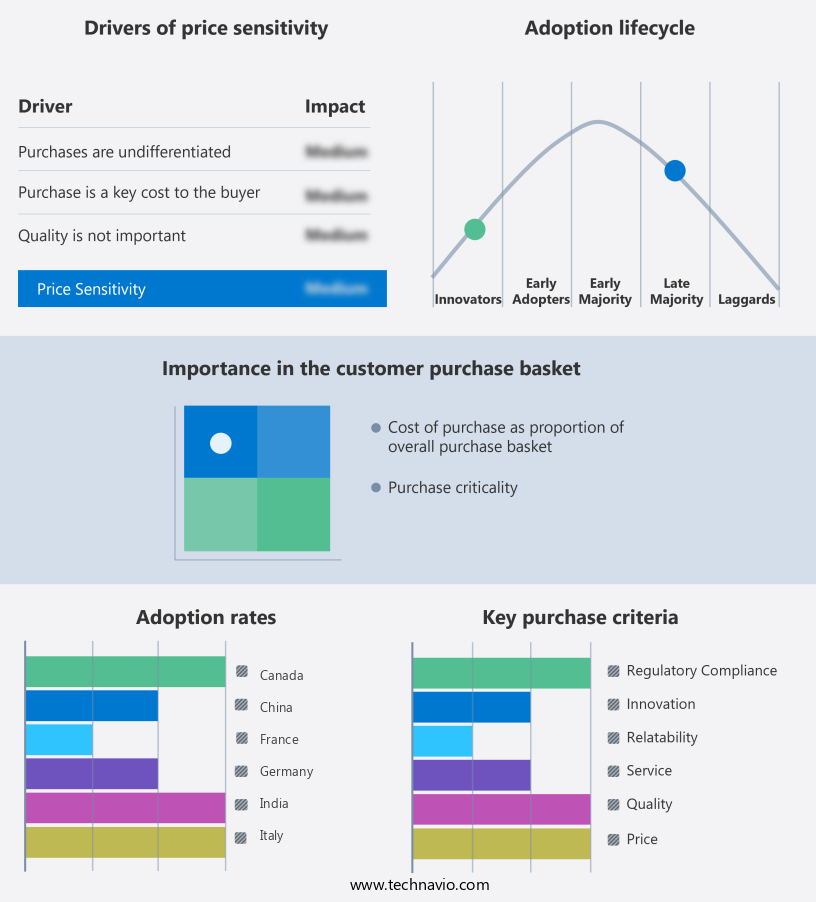
The market forecasting report includes the adoption lifecycle of the market, covering from the innovator's stage to the laggard's stage. It focuses on adoption rates in different regions based on penetration. Furthermore, the report also includes key purchase criteria and drivers of price sensitivity to help companies evaluate and develop their market growth analysis strategies.
Customer Landscape
Key Companies & Market Insights
Companies are implementing various strategies, such as strategic alliances, partnerships, mergers and acquisitions, geographical expansion, and product/service launches, to enhance their presence in the market.
ABEO Technology Co. Ltd. - The company offers passenger vehicle dashboard cameras such as GMSL camera AG190A, GMSL camera AG190C and USB camera.
The market research and growth report also includes detailed analyses of the competitive landscape of the market and information about key companies, including:
- BlackVue
- Chameleon Codewing Ltd.
- Cobra Electronics Corp. and Escort Inc.
- DigiLife Technologies Co. Ltd.
- DOD Tech
- Falcon Electronics LLC
- Garmin Ltd.
- Harman International Industries Inc.
- Honeywell International Inc.
- LG Corp.
- Panasonic Holdings Corp.
- Rexing
- Robert Bosch GmbH
- SCDE Solutions Pvt. Ltd.
- Shenzhen Daza Innovation Technology Co. Ltd.
- Shenzhen Firstscene Technology Co. Ltd.
- Steelmate Automotive UK Ltd.
- Waylens
- Yageo Corp.
- YI Technologies
Qualitative and quantitative analysis of companies has been conducted to help clients understand the wider business environment as well as the strengths and weaknesses of key market players. Data is qualitatively analyzed to categorize companies as pure play, category-focused, industry-focused, and diversified; it is quantitatively analyzed to categorize companies as dominant, leading, strong, tentative, and weak.
Dashboard cameras, also known as dashcams, have gained significant popularity in the global market due to their role in ensuring safety and security for vehicle owners. These digital video recorders provide real-time monitoring of the road ahead, capturing crucial footage during road mishaps, accidents, legal proceedings, and insurance claims. The adoption of dashboard cameras is not limited to personal vehicles but extends to commercial vehicles, public utility vehicles (PUVs), and fleet monitoring. Advanced features such as artificial intelligence (AI), object detection, and real-time monitoring enhance the functionality of these devices. AI-enabled dashcams can detect and alert drivers of potential hazards, including lane departure warnings, blind spot detection, collision avoidance, and forward collision warning.
The integration of cloud technology, IoT, and vehicle telematics enables remote access and real-time monitoring, offering peace of mind to vehicle owners. The increasing focus on vehicle safety and the growing concern for cybersecurity have led to the development of advanced features such as dual channel dashcams, HD cameras, and 4K cameras. The expansion of shipping charges, retail stores, and e-commerce platforms have made these video recording devices easily accessible to consumers. Dashboard cameras serve as an essential safety measure, providing proof in case of false claims and ensuring driver safety while monitoring behaviors on the road.
|
Market Scope |
|
|
Report Coverage |
Details |
|
Page number |
183 |
|
Base year |
2023 |
|
Historic period |
2018 - 2022 |
|
Forecast period |
2024-2028 |
|
Growth momentum & CAGR |
Accelerate at a CAGR of 22.2% |
|
Market Growth 2024-2028 |
USD 3.58 billion |
|
Market structure |
Fragmented |
|
YoY growth 2023-2024(%) |
17.9 |
|
Regional analysis |
APAC, Europe, North America, South America, and Middle East and Africa |
|
Performing market contribution |
APAC at 44% |
|
Key countries |
US, China, Japan, India, South Korea, Canada, Germany, UK, France, and Italy |
|
Competitive landscape |
Leading Companies, Market Positioning of Companies, Competitive Strategies, and Industry Risks |
|
Key companies profiled |
ABEO Technology Co. Ltd., BlackVue, Chameleon Codewing Ltd., Cobra Electronics Corp. and Escort Inc., DigiLife Technologies Co. Ltd., DOD Tech, Falcon Electronics LLC, Garmin Ltd., Harman International Industries Inc., Honeywell International Inc., LG Corp., Panasonic Holdings Corp., Rexing, Robert Bosch GmbH, SCDE Solutions Pvt. Ltd., Shenzhen Daza Innovation Technology Co. Ltd., Shenzhen Firstscene Technology Co. Ltd., Steelmate Automotive UK Ltd., Waylens, Yageo Corp., and YI Technologies |
|
Market dynamics |
Parent market analysis, Market growth inducers and obstacles, Fast-growing and slow-growing segment analysis, COVID-19 impact and recovery analysis and future consumer dynamics, Market condition analysis for the market forecast period. |
|
Customization purview |
If our market report has not included the data that you are looking for, you can reach out to our analysts and get segments customized. |
What are the Key Data Covered in this Market Research Report?
- CAGR of the market during the forecast period
- Detailed information on factors that will drive the market growth and forecasting between 2024 and 2028
- Precise estimation of the size of the market and its contribution of the market in focus to the parent market
- Accurate predictions about upcoming market growth and trends and changes in consumer behaviour
- Growth of the market across APAC, Europe, North America, South America, and Middle East and Africa
- Thorough analysis of the market's competitive landscape and detailed information about companies
- Comprehensive analysis of factors that will challenge the growth of market companies
We can help! Our analysts can customize this market research report to meet your requirements.
 RIA -
RIA - 
