Passive Component Market Size 2025-2029
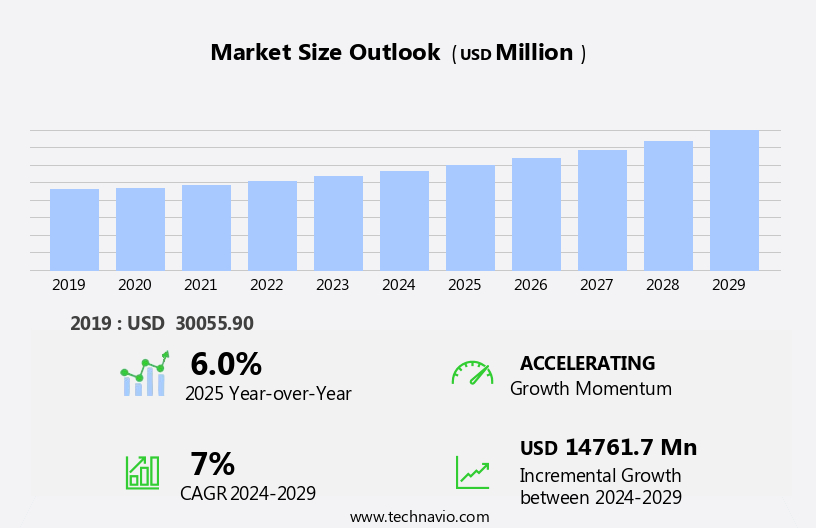
The passive component market size is forecast to increase by USD 14.76 billion at a CAGR of 7% between 2024 and 2029.
- Passive components, including aluminum capacitors, tantalum capacitors, diodes, filters, transformers, and inductors, play a crucial role in various industries, from semiconductor and power electronics to consumer electronics and renewable energy. The market for passive components is experiencing significant growth due to several factors. Firstly, the increasing demand for advanced technologies such as big data, cloud computing, and the Internet of Things (IoT) in industries like automotive, healthcare, and telecommunications is driving the need for more sophisticated passive components. Additionally, the expansion of consumer electronics, particularly smartphones, laptops, tablets, and servers, is fueling the demand for high-performance passive components. Another trend influencing the market is the growing focus on energy storage applications, including batteries for electric vehicles and renewable energy systems.
- The increasing adoption of autonomous vehicles and the development of smart grids are expected to further boost the demand for passive components in the energy storage sector. Furthermore, the rise of digital technologies in various industries, including satellite communication and computer systems, is increasing the need for passive components in power electronics applications. Despite these growth opportunities, the market faces challenges, including the volatility in raw material prices, particularly for nickel and tantalum, and the increasing competition from alternative materials and manufacturing processes. To mitigate these challenges, market players are focusing on innovation and cost optimization strategies to maintain their competitive edge.
What will be the Size of the Passive Component Market During the Forecast Period?
- The market encompasses a diverse range of electric circuit elements, including resistors, capacitors, inductors, and diodes. These components play a crucial role in electric circuits by providing various functions such as power absorption, energy storage, and current flow regulation. Unlike active components like semiconductor devices, which require an external power source for amplification or voltage control, passive components rely solely on the electric and magnetic fields present in the circuit. The market exhibits strong growth, driven by the increasing demand for power delivery and power absorption in various applications. Power sources, such as energy sources, voltage sources, and current sources, rely on passive components for efficient energy conversion and distribution.
- Heat dissipation is another critical factor driving market growth, as passive components like resistors and capacitors are often used to manage thermal energy in electronic systems. The market's size and direction reflect the expanding use of passive components in various industries, including telecommunications, automotive, industrial, and consumer electronics. The growing trend towards miniaturization and the increasing complexity of electronic systems further boost demand for high-performance passive components. Overall, the market is expected to continue its steady growth trajectory, underpinned by the ongoing evolution of electronics engineering and the expanding use of electric circuits.
How is this Passive Component Industry segmented and which is the largest segment?
The industry research report provides comprehensive data (region-wise segment analysis), with forecasts and estimates in "USD billion" for the period 2025-2029, as well as historical data from 2019-2023 for the following segments.
- Product
- Capacitors
- Resistors
- Inductors
- Diode
- Transformers
- End-user
- Consumer electronics
- IT and telecom industry
- Automotive industry
- Industrial machinery
- Others
- Component
- Passive
- Interconnecting
- Material
- Ceramic
- Metal
- Polymer
- Others
- Geography
- APAC
- China
- India
- Japan
- South Korea
- North America
- Canada
- US
- Europe
- Germany
- UK
- France
- South America
- Middle East and Africa
- APAC
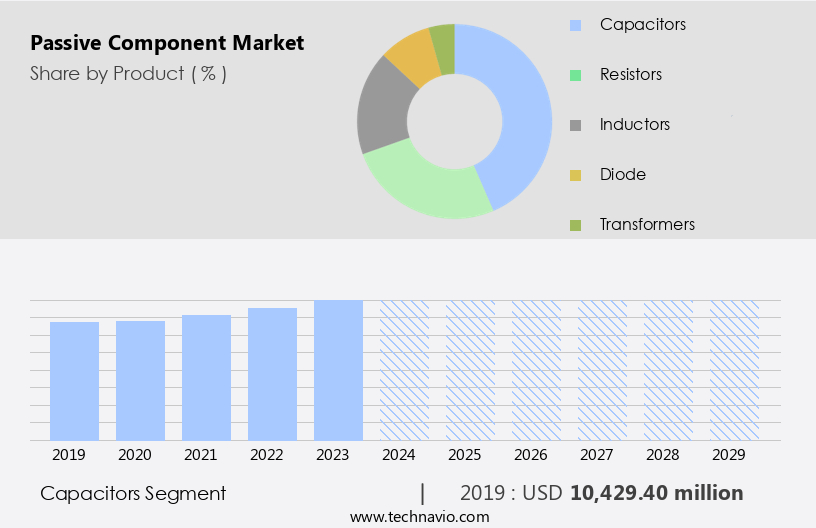
By Product Insights
- The capacitors segment is estimated to witness significant growth during the forecast period. Capacitors are essential passive components in electronic circuits, serving to store electric energy and deliver it as needed. They play a crucial role in various applications, including power delivery, power absorption, and voltage filtering in devices such as smartphones, tablets, laptops, digital cameras, and more. Capacitor types include monolithic ceramic capacitors, multilayer ceramic capacitors, single-layer microchip capacitors, electrical double-layer capacitors, disc ceramic capacitors, and polymer capacitors. Industries utilizing capacitors span consumer electronics, automotive, industrial, telecommunications, and defense. Capacitors mitigate electric noise, regulate current and voltage, and function as coupling components in circuits.
Get a glance at the market report of share of various segments Request Free Sample
The Capacitors segment was valued at USD 10.43 billion in 2019 and showed a gradual increase during the forecast period.
Regional Analysis
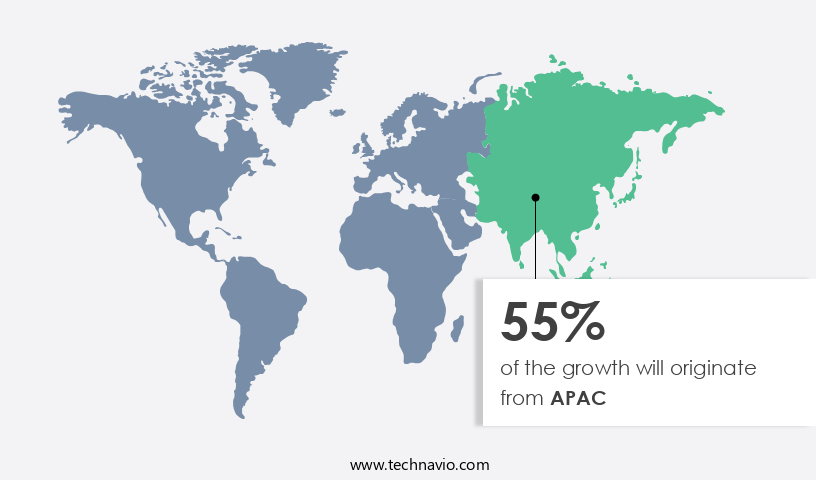
- APAC is estimated to contribute 55% to the growth of the global market during the forecast period. Technavio's analysts have elaborately explained the regional trends and drivers that shape the market during the forecast period. The Asia-Pacific (APAC) region is a significant contributor to The market, driven by a thriving electronics industry, technological advancements, and extensive manufacturing capabilities.
For more insights on the market size of various regions, Request Free Sample
Countries like China, Taiwan, South Korea, and Japan are major contributors to the market's growth due to low labor costs and favorable government policies. The APAC region is a major manufacturer of electronic components, including passive components like capacitors, inductors, and resistors. The demand for passive components is anticipated to increase during the forecast period due to the region's growing electronic product manufacturing sector and energy consumption trends. Passive components are essential circuit elements that regulate current flow, provide voltage regulation, filter voltage and noise, and absorb or deliver power. They function as load, coupling, and decoupling components in electric circuits and power sources, such as voltage sources, current sources, generators, alternators, and semiconductor devices like transistors and photodiodes. Heat dissipation and magnetic or electric fields are critical factors in passive component design.
Market Dynamics
Our researchers analyzed the data with 2024 as the base year, along with the key drivers, trends, and challenges. A holistic analysis of drivers will help companies refine their marketing strategies to gain a competitive advantage.
What are the key market drivers leading to the rise in the adoption of Passive Component Industry?
- Increase in need for passive components in space applications is the key driver of the market. Passive components are essential elements in electronics engineering, playing a crucial role in electric circuits as circuit elements that don't require an external power source for operation. These components include resistors, capacitors, inductors, and diodes, which function by passively affecting the flow of electric current in a circuit. In contrast, active components, such as semiconductor devices like transistors and photodiodes, require an external power source for amplification and control. Passive components serve various functions in circuits, such as power delivery, power absorption, voltage filtering, noise filtering, current regulation, and voltage regulation. They are also used for coupling, impedance matching, and energy storage.
- In the context of power sources, passive components are employed in energy sources like generators and alternators to ensure proper energy conversion and delivery. The market for passive components is significant due to their extensive use in various applications, including automotive electronics, electric vehicles, and consumer electronics. The demand for miniature components with high capacity and high-voltage capabilities is increasing, driven by the growing need for energy-efficient and compact electronic products. Additionally, passive components play a vital role in managing electrical energy consumption by mitigating electromagnetic interference and ensuring proper voltage regulation. The manufacturing of passive components involves various materials, such as MLCCs (Miniature Leaded Ceramic Capacitors), ceramic capacitors, aluminum capacitors, and tantalum capacitors.
What are the market trends shaping the Passive Component Industry?
- Growing advancement of IoT in industries is the upcoming market trend. In the realm of electronics engineering, the demand for circuit components, including power sources and passive elements such as resistors, capacitors, inductors, and diodes, is escalating. Active components, like semiconductor devices such as transistors and photodiodes, amplify or oscillate electrical signals, while passive components serve essential functions like power delivery, power absorption, heat dissipation, and energy storage. The global market for passive components is witnessing significant growth due to the increasing energy consumption in electronic products and the manufacturing of high-capacity components, miniature components, and high-voltage components for various applications. The automotive and electric vehicle industries, in particular, require high-performance passive components for power filtering, noise filtering, and electromagnetic interference reduction.
- Consumer electronics, signal amplification, and voltage regulation are other sectors driving the demand for passive components. As industries strive for improved efficiency, precision, and reliability, the role of passive components in power delivery, current regulation, and voltage regulation becomes increasingly crucial. Passive components, including MLCCs, ceramic capacitors, aluminum capacitors, and tantalum capacitors, play a vital role in various applications, from voltage filtering and noise filtering to current regulation and voltage regulation. The integration of passive components into IC chips and other advanced technologies further expands their applications and enhances their functionality. The adoption of IoT in industries is leading to an unprecedented increase in production volumes and the need for passive components to support the growing network of devices.
What challenges does the Passive Component Industry face during its growth?
- Growing concerns on volatility in raw material prices is a key challenge affecting the industry growth. The market plays a crucial role in electric circuits as circuit elements that don't require an external power source for operation. These components include resistors, capacitors, inductors, and diodes, which function as circuit load, voltage filtering, noise filtering, current regulation, and voltage regulation elements. Power sources, such as generators, alternators, and energy sources like batteries, provide power delivery to active components, such as semiconductor devices like transistors and photodiodes. In contrast, passive components absorb and store energy In the form of magnetic fields or electric fields. However, the market faces challenges due to raw material dependencies and supply chain instability.
- Base metals, such as nickel, palladium, and ruthenium, are essential for manufacturing passive components like MLCCs, ceramic capacitors, aluminum capacitors, and tantalum capacitors. The mining and refining industries' volatility and increasing labor costs pose a threat to the availability and price of these metals. Consequently, manufacturers face unpredictable production costs and struggle to manage their budgets and supply chains effectively. Moreover, the growing demand for miniature components, high-capacity components, and high-voltage components in various industries, including automotive electronics, electric vehicles, and consumer electronics, further complicates the market dynamics. This situation necessitates a thorough experience of the market and its underlying factors to effectively plan and manage supply chains and mitigate risks.
Exclusive Customer Landscape
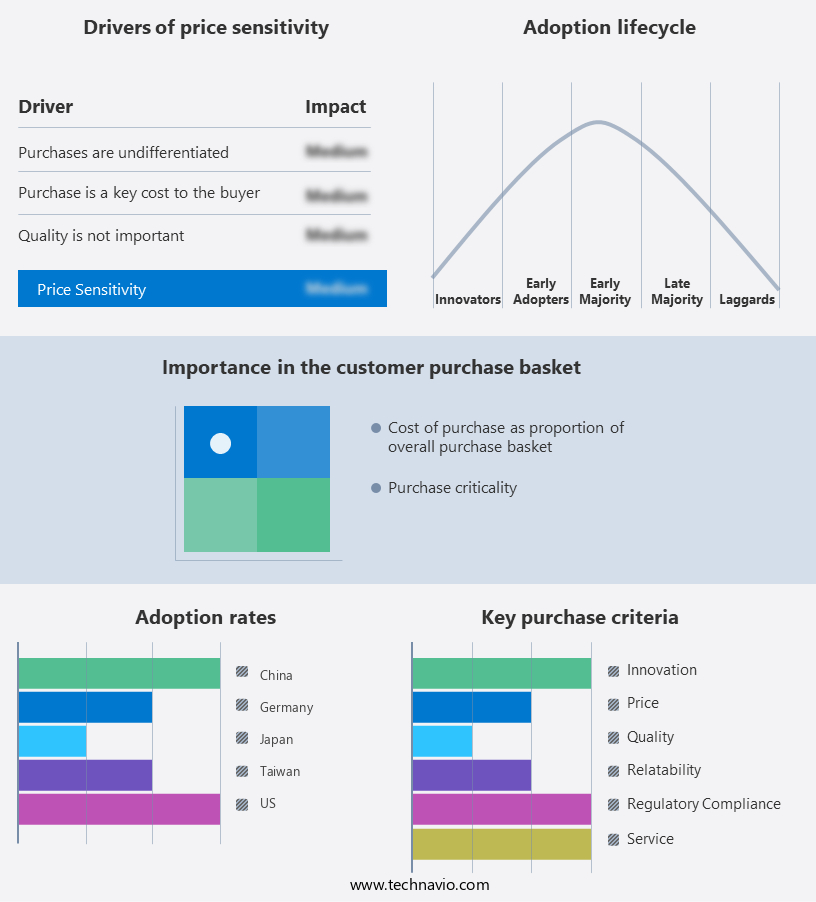
The market forecasting report includes the adoption lifecycle of the market, covering from the innovator's stage to the laggard's stage. It focuses on adoption rates in different regions based on penetration. Furthermore, the market report also includes key purchase criteria and drivers of price sensitivity to help companies evaluate and develop their market growth analysis strategies.
Customer Landscape
Key Companies & Market Insights
Companies are implementing various strategies, such as strategic alliances, market forecast, partnerships, mergers and acquisitions, geographical expansion, and product/service launches, to enhance their presence in the industry.
Fenghua HK: The company offers passive components such as multilayer ceramic capacitors, thick film resistors, aluminum electrolytic capacitors, high voltage disc ceramic capacitors, chip beads, and humidity sensors.
The industry research and growth report includes detailed analyses of the competitive landscape of the market and information about key companies, including:
- Adolf Wurth GmbH and Co. KG
- Delta Electronics Inc.
- Fenghua HK Electronics Ltd
- Koa Corp.
- KYOCERA Corp.
- Murata Manufacturing Co. Ltd.
- NICHICON Corp.
- Nippon Chemi-Con Corp.
- Panasonic Holdings Corp.
- ROHM Co. Ltd.
- Rubycon Corp
- Ryosan Co.
- Samsung Electronics Co. Ltd.
- Sumida Corporation
- TAIYO YUDEN Co. Ltd.
- TDK Corp.
- TTI Inc.
- Vishay Intertechnology Inc.
- Walsin Technologies Corp.
- Yageo Corp.
Qualitative and quantitative analysis of companies has been conducted to help clients understand the wider business environment as well as the strengths and weaknesses of key industry players. Data is qualitatively analyzed to categorize companies as pure play, category-focused, industry-focused, and diversified; it is quantitatively analyzed to categorize companies as dominant, leading, strong, tentative, and weak.
Research Analyst Overview
Passive components play a crucial role in the functioning of electric circuits, acting as essential building blocks in the transmission, transformation, and regulation of electrical energy. These circuit elements, distinct from their active counterparts, do not require an external power source for operation. Instead, they passively modify the electrical signals and current flow in a circuit. The market for passive components encompasses a wide array of electric circuit elements, including resistors, capacitors, inductors, and diodes. These components serve various functions in power delivery and absorption, energy storage, and voltage and current regulation. Resistors, for instance, offer resistance to current flow, enabling voltage drop and power dissipation.
Moreover, capacitors, on the other hand, store electrical energy in an electric field, providing energy storage and voltage regulation. Inductors, which include coils and transformers, store energy in a magnetic field, facilitating energy transfer and impedance matching. Diodes, as unidirectional semiconductor devices, allow current flow in only one direction. Power sources, such as generators and alternators, provide the electrical energy necessary for circuit operation. However, these components play a significant role in managing this energy. Power absorption occurs when these components convert electrical energy into other forms, such as heat or electromagnetic waves. Power gain is achieved through the amplification of electrical signals using active components, with these components contributing to impedance matching and decoupling.
Furthermore, electronic products across various industries, from automotive to consumer electronics, rely on passive components for their functionality. The global shortage of certain passive components, particularly miniature and high-capacity types, has posed challenges for manufacturers. This shortage can be attributed to factors such as increased demand for smaller, more efficient components and supply chain disruptions. Manufacturers have responded to this challenge by developing high-capacity and high-voltage components, such as MLCCs (Multilayer Ceramic Capacitors), ceramic capacitors, aluminum capacitors, and tantalum capacitors. These components offer improved performance, reliability, and miniaturization, making them essential in modern electronic applications. They also play a vital role in managing energy consumption and addressing electromagnetic interference (EMI) and radio-frequency interference (RFI) in electronic systems.
|
Market Scope |
|
|
Report Coverage |
Details |
|
Page number |
255 |
|
Base year |
2024 |
|
Historic period |
2019-2023 |
|
Forecast period |
2025-2029 |
|
Growth momentum & CAGR |
Accelerate at a CAGR of 7% |
|
Market growth 2025-2029 |
USD 14.76 billion |
|
Market structure |
Fragmented |
|
YoY growth 2024-2025(%) |
6.0 |
|
Key countries |
US, China, Japan, India, South Korea, Germany, Canada, UK, Australia, and France |
|
Competitive landscape |
Leading Companies, Market Positioning of Companies, Competitive Strategies, and Industry Risks |
What are the Key Data Covered in this Market Research and Growth Report?
- CAGR of the industry during the forecast period
- Detailed information on factors that will drive the market growth and forecasting between 2025 and 2029
- Precise estimation of the size of the market and its contribution of the industry in focus to the parent market
- Accurate predictions about upcoming growth and trends and changes in consumer behaviour
- Growth of the market across APAC, North America, Europe, South America, and Middle East and Africa
- Thorough analysis of the market's competitive landscape and detailed information about companies
- Comprehensive analysis of factors that will challenge the market growth of industry companies
We can help! Our analysts can customize this market research report to meet your requirements.
 RIA -
RIA - 
