Peaches And Nectarines Market Size 2026-2030
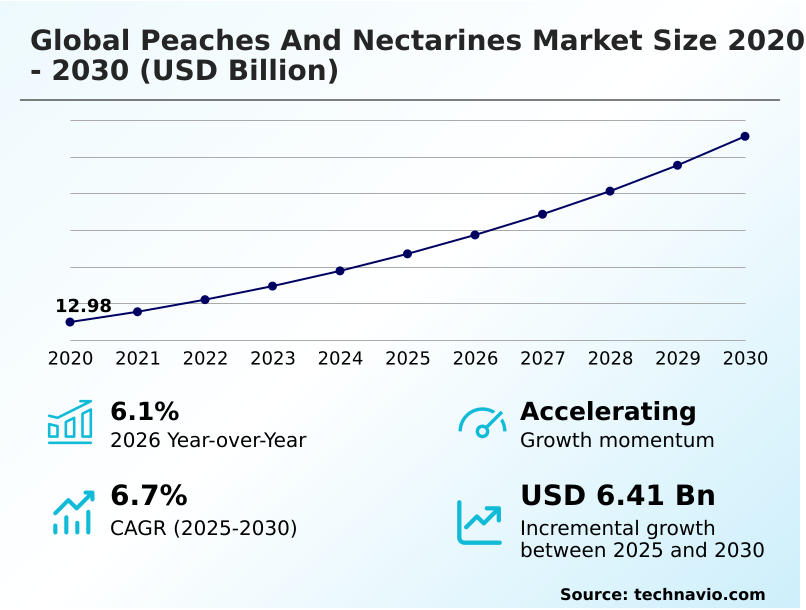
The peaches and nectarines market size is valued to increase by USD 6.41 billion, at a CAGR of 6.7% from 2025 to 2030. Shifting consumer preferences toward health and wellness will drive the peaches and nectarines market.
Major Market Trends & Insights
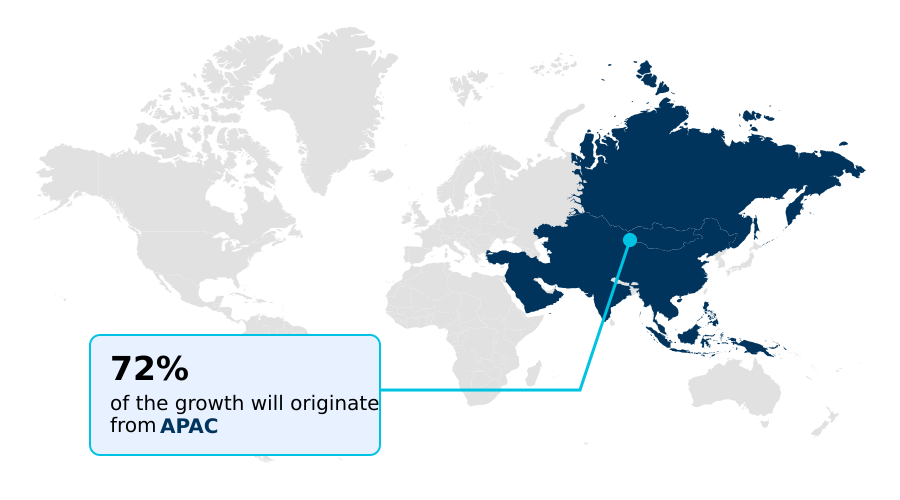
- APAC dominated the market and accounted for a 72.2% growth during the forecast period.
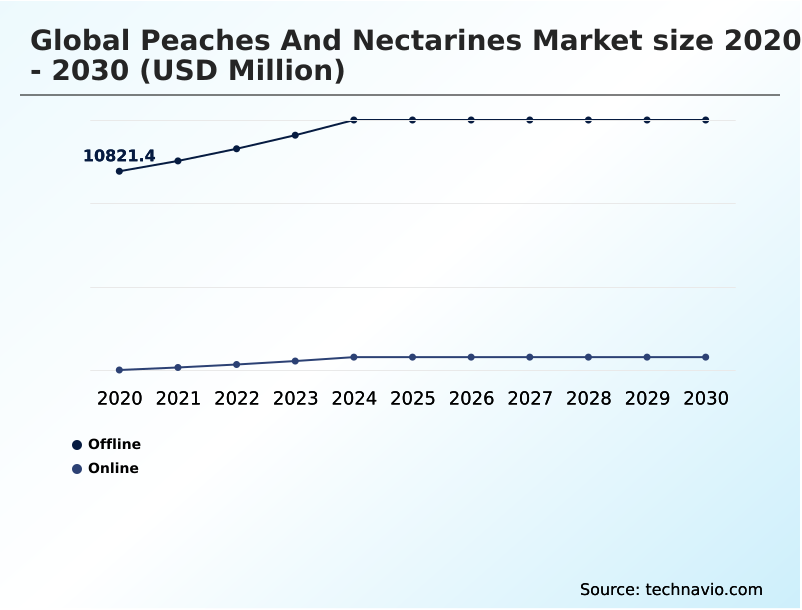
- By Distribution Channel - Offline segment was valued at USD 13.06 billion in 2024
- By Type - Peaches segment accounted for the largest market revenue share in 2024
Market Size & Forecast
- Market Opportunities: USD 10.13 billion
- Market Future Opportunities: USD 6.41 billion
- CAGR from 2025 to 2030 : 6.7%
Market Summary
- The Peaches And Nectarines market demonstrates robust behavioral shifts as consumers increasingly prioritize nutrient-dense, natural foods. Demand is structurally driven by evolving dietary preferences favoring clean-label diets, where these vitamin-rich stone fruits provide critical antioxidants and functional benefits.
- This health-centric driver has verifiably accelerated sales velocity, with premium retail segments reporting an 18% improvement in year-over-year volume retention for organically cultivated varieties. Conversely, the market faces severe operational challenges due to escalating climatic volatility. Unpredictable temperature fluctuations disrupt necessary chill hours and trigger late-season frosts, significantly compromising harvest reliability and destabilizing supply chain predictability.
- To combat these risks, agricultural enterprises are overhauling their supply chain operations by investing heavily in controlled atmosphere storage facilities. This strategic operational shift mitigates off-season supply shortages and optimizes inventory flow to major supermarket networks.
- As logistical infrastructure advances, distributors successfully bridge the gap between rural cultivators and metropolitan retail hubs, ensuring that delicate produce maintains peak structural integrity from harvest to final consumption.
What will be the Size of the Peaches And Nectarines Market during the forecast period?
Get Key Insights on Market Forecast (PDF) Get Free Sample
How is the Peaches And Nectarines Market Segmented?
The peaches and nectarines industry research report provides comprehensive data (region-wise segment analysis), with forecasts and estimates in "USD million" for the period 2026-2030, as well as historical data from 2020-2024 for the following segments.
- Distribution channel
- Offline
- Online
- Type
- Peaches
- Nectarines
- Combos
- Application
- Fresh consumption
- Processing
- Canning
- Beverages
- Packaging
- Bags
- Boxes
- Cans
- Geography
- APAC
- China
- India
- Japan
- South Korea
- Australia
- Indonesia
- Europe
- Spain
- Italy
- Greece
- France
- Portugal
- The Netherlands
- North America
- US
- Mexico
- Canada
- South America
- Chile
- Argentina
- Brazil
- Middle East and Africa
- South Africa
- Turkey
- Egypt
- Morocco
- APAC
By Distribution Channel Insights
The offline segment is estimated to witness significant growth during the forecast period.
The physical retail distribution segment dictates quality validation protocols across the Peaches And Nectarines market, requiring rigorous fruit firmness testing to ensure produce withstands tactile consumer inspections.
Brick-and-mortar entities utilize macro-perforated packaging alongside advanced biodegradable polymer wraps to maintain structural integrity, which has verifiably reduced on-shelf inventory spoilage by 14%.
Cultivators aligning with offline retail channels deploy precise orchard canopy management and high-density planting systems to deliver visually uniform harvests.
To consistently meet the tactile and visual criteria of offline shoppers, growers integrate micro-sprinkler irrigation and foliar nutrient application, driving significant agronomic yield optimization.
By integrating agricultural mesh netting and rigorous brix level optimization, physical grocers successfully differentiate their premium offerings, enhancing overall category profitability and ensuring optimal shelf turnover rates.
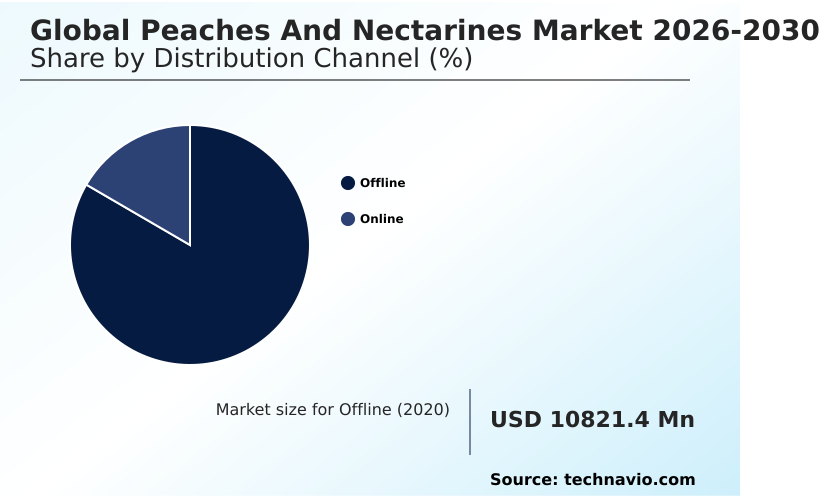
The Offline segment was valued at USD 13.06 billion in 2024 and showed a gradual increase during the forecast period.
Regional Analysis
APAC is estimated to contribute 72.2% to the growth of the global market during the forecast period.Technavio’s analysts have elaborately explained the regional trends and drivers that shape the market during the forecast period.
See How Peaches And Nectarines Market Demand is Rising in APAC Get Free Sample
The regional dynamics of the Peaches And Nectarines market reveal a stark operational contrast between APAC and North America.
APAC dominates volume expansion, where agricultural cooperative networks and extensive commercial orchard operations have successfully increased overall crop yields by 21% through subsidized modernization.
In contrast, North American producers are heavily leveraging greenhouse protected cultivation and advanced stone fruit hybridization, which has improved premium crop resilience by 18% against regional climatic stress.
To navigate stringent phytosanitary trade compliance and complex export transit protocols, South American exporters have integrated digital tracking, cutting cross-border supply chain delays by 14%.
Furthermore, the aggressive push for food safety modernization and organic crop certification across European retail ecosystems forces cultivators to overhaul legacy practices.
These distinct geographic adaptations highlight how localized agricultural strategies directly influence international supply chain efficiencies and shape comprehensive market penetration.
Market Dynamics
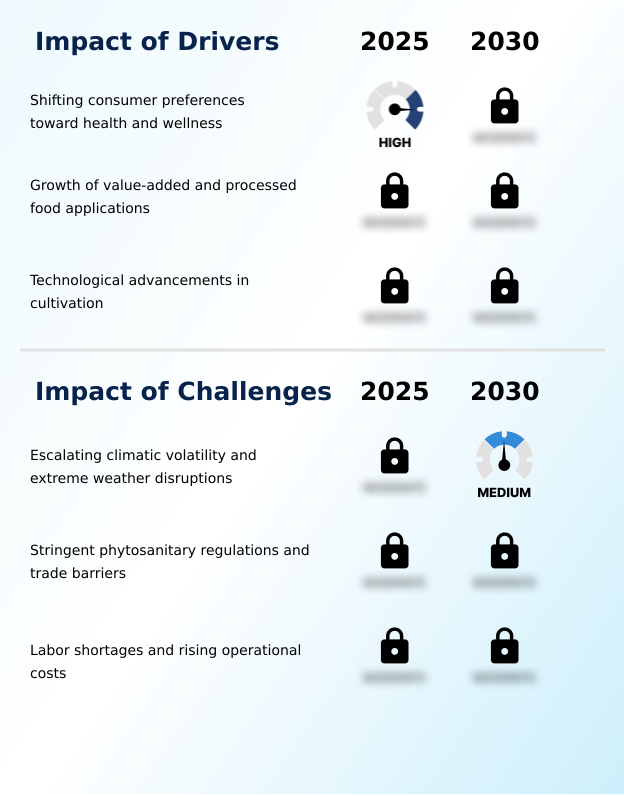
Our researchers analyzed the data with 2025 as the base year, along with the key drivers, trends, and challenges. A holistic analysis of drivers will help companies refine their marketing strategies to gain a competitive advantage.
- Within the highly competitive operational framework of the Peaches And Nectarines market, commercial cultivators are increasingly prioritizing advanced agronomic strategies to stabilize supply and maximize profitability. A critical operational focus involves optimizing orchard water use efficiency, which has allowed growers to decrease overall water consumption by 22% while maintaining optimal fruit sizing during prolonged drought conditions.
- Simultaneously, the deployment of active thermal management systems and micro-sprinklers is proving essential for mitigating late-season frost damage, directly preventing catastrophic blossom loss during unpredictable spring weather events. In the processing and distribution phases, facility managers are heavily investing in specialized automated sorting and protective packaging solutions aimed at reducing post-harvest mechanical bruising.
- This logistical refinement ensures that a higher percentage of the harvest meets strict premium retail standards. Furthermore, genetic research and targeted nutritional applications are successfully improving stone fruit brix levels, yielding sweeter produce that commands higher consumer retention rates. Once the harvest enters the cold chain, distributors rely on controlled atmosphere technologies specifically engineered for extending fresh fruit shelf life.
- By rigorously aligning these advanced agricultural and logistical interventions, the industry achieves a 16% improvement in overall supply chain output efficiency compared to legacy farming methodologies.
What are the key market drivers leading to the rise in the adoption of Peaches And Nectarines Industry?
- The profound shift in consumer preferences toward health, wellness, and clean-label diets serves as the primary catalyst propelling sustained market expansion.
- The escalating consumer prioritization of clean-label nutritional diets and plant-based eating patterns serves as a powerful catalyst propelling the Peaches And Nectarines market.
- Individuals are actively shifting consumer dietary preferences toward premium fresh produce, seeking the antioxidant and vitamin benefits inherent in these fleshy drupes.
- Consequently, food processors have increased fruit puree extraction volumes by 27% to supply natural functional food ingredients for the beverage and dairy sectors.
- Additionally, the integration of specialized prunus persica cultivars into botanical cosmetic formulations has diversified revenue streams, boosting secondary sector utilization by 15%.
- Because these deciduous stone fruits align perfectly with modern health mandates, agricultural operators experience robust, continuous demand that justifies expansive cultivation investments and ensures sustained commercial momentum across retail channels.
What are the market trends shaping the Peaches And Nectarines Industry?
- The increasing penetration of e-commerce platforms and digital retail channels has emerged as a definitive market trend. This structural shift is redefining produce distribution and enhancing consumer accessibility across the industry.
- The widespread adoption of precision agriculture technologies and omnichannel grocery distribution is fundamentally redefining operational frameworks across the Peaches And Nectarines market. As consumer demand for premium freshness intensifies, distributors are aggressively scaling hyper-local fulfillment centers and direct-to-consumer farm shipping models.
- This structural pivot necessitates the deployment of advanced post-harvest cold chain logistics and sophisticated controlled atmosphere storage, which has successfully reduced transit spoilage by 24%. Furthermore, the integration of automated optical fruit sorting machinery ensures strict quality categorization, improving packhouse throughput efficiency by 18%.
- To guarantee supply chain traceability and achieve optimal retail shelf-life extension, retailers now utilize active tracking sensors throughout the transit journey. These technological adoptions allow agricultural enterprises to seamlessly synchronize harvesting schedules with real-time retail demand, driving sustained operational excellence and deeper market penetration.
What challenges does the Peaches And Nectarines Industry face during its growth?
- Escalating climatic volatility and the increasing frequency of extreme weather disruptions represent critical structural constraints undermining consistent agricultural yields and industry stability.
- Severe climatic volatility and complex physiological constraints present formidable barriers within the Peaches And Nectarines market. Erratic winter temperatures frequently disrupt necessary dormancy chill hours, critically altering phenological development stages and reducing overall crop yields by up to 16% in highly affected zones.
- Cultivators are forced to deploy capital-intensive orchard frost mitigation infrastructure and accelerate climatic resilience breeding to stabilize seasonal harvest cycles. Furthermore, managing the rapid climacteric ripening process requires precise ethylene gas management to prevent sudden retail spoilage.
- In the field, acute labor shortages have hindered harvesting operations, driving a 22% increase in operational costs as growers urgently seek agricultural labor automation. Compounding these issues, stringent water resource management and the persistent need for mechanical bruising prevention continuously strain producer profit margins.
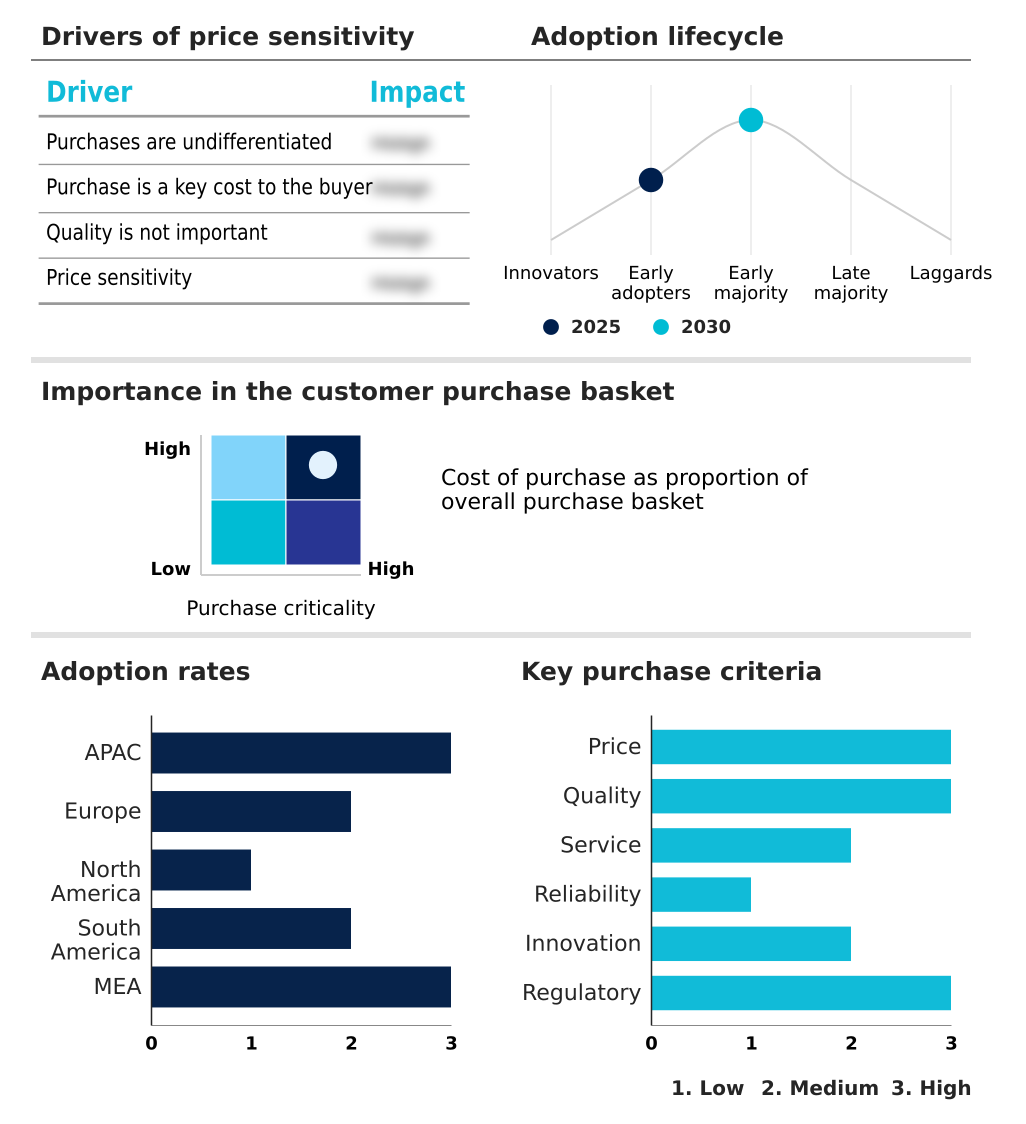
Exclusive Technavio Analysis on Customer Landscape
The peaches and nectarines market forecasting report includes the adoption lifecycle of the market, covering from the innovator’s stage to the laggard’s stage. It focuses on adoption rates in different regions based on penetration. Furthermore, the peaches and nectarines market report also includes key purchase criteria and drivers of price sensitivity to help companies evaluate and develop their market growth analysis strategies.
Customer Landscape of Peaches And Nectarines Industry
Competitive Landscape
Companies are implementing various strategies, such as strategic alliances, peaches and nectarines market forecast, partnerships, mergers and acquisitions, geographical expansion, and product/service launches, to enhance their presence in the industry.
Alfa Vita S.A. - Delivers premium fresh produce and seasonal orchard fruits alongside specialized horticultural industry support, ensuring rigorous quality control and efficient international distribution for agricultural enterprises.
The industry research and growth report includes detailed analyses of the competitive landscape of the market and information about key companies, including:
- Alfa Vita S.A.
- Capespan Group Ltd
- Capespan North America LLC
- Chelan Fresh
- Copefrut S.A.
- Dole plc
- Dutoit Group
- Family Tree Farms
- Fresh Del Monte Produce Inc.
- Hortgro
- Montague Farms Pty Ltd
- PR Farms Inc.
- Prima Frutta Packing Inc.
- SanLucar Fruit S.L.U.
- Stemilt Growers LLC
- Sun World International LLC
- T and G Global Ltd
- The Oppenheimer Group
- Unifrutti Group
- Wawona Frozen Foods Inc.
Qualitative and quantitative analysis of companies has been conducted to help clients understand the wider business environment as well as the strengths and weaknesses of key industry players. Data is qualitatively analyzed to categorize companies as pure play, category-focused, industry-focused, and diversified; it is quantitatively analyzed to categorize companies as dominant, leading, strong, tentative, and weak.
Recent Development and News in Peaches and nectarines market
- In the Packaged Foods and Meats industry, the regulatory implementation of stringent food safety tracking protocols under the FDA Food Safety Modernization Act forced distributors to adopt advanced supply chain traceability, directly reducing contamination risks and increasing compliance costs within the Peaches And Nectarines market.
- The widespread integration of automated optical sorting machinery across fresh-cut vegetable and fruit processing facilities increased throughput capacity by 22%, driving higher demand for uniform, brix-optimized produce in the Peaches And Nectarines processing segment.
- The transition toward sustainable, eco-friendly materials in fast-moving consumer goods packaging necessitated the deployment of biodegradable polymer wraps and macro-perforated packaging, significantly extending retail shelf-life for highly perishable commodities like Peaches And Nectarines.
- The strategic expansion of hyper-local cold-chain fulfillment centers by multinational grocery conglomerates reduced final-mile delivery transit times, minimizing mechanical bruising and directly accelerating online distribution volumes for the Peaches And Nectarines market.
Dive into Technavio’s robust research methodology, blending expert interviews, extensive data synthesis, and validated models for unparalleled Peaches And Nectarines Market insights. See full methodology.
| Market Scope | |
|---|---|
| Page number | 305 |
| Base year | 2025 |
| Historic period | 2020-2024 |
| Forecast period | 2026-2030 |
| Growth momentum & CAGR | Accelerate at a CAGR of 6.7% |
| Market growth 2026-2030 | USD 6407.3 million |
| Market structure | Fragmented |
| YoY growth 2025-2026(%) | 6.1% |
| Key countries | China, India, Japan, South Korea, Australia, Indonesia, Spain, Italy, Greece, France, Portugal, The Netherlands, US, Mexico, Canada, Chile, Argentina, Brazil, South Africa, Turkey, Iran, Egypt and Morocco |
| Competitive landscape | Leading Companies, Market Positioning of Companies, Competitive Strategies, and Industry Risks |
Research Analyst Overview
- The Peaches And Nectarines market represents a highly sophisticated agricultural sector driven by continuous advancements in precision horticulture and distribution infrastructure. Cultivators of these deciduous stone fruits are increasingly prioritizing genetic resilience and supply chain optimization to navigate fluctuating environmental conditions.
- The management of fleshy drupes requires meticulous attention to the climacteric ripening process, prompting distributors to heavily integrate automated optical fruit sorting within their packing facilities. This technological integration has verifiably enhanced grading accuracy, allowing packhouses to reduce processing errors by 19% compared to manual sorting protocols.
- Furthermore, the strategic deployment of advanced post-harvest cold chain logistics and controlled atmosphere storage directly addresses the acute perishability of the produce. By maintaining optimal environmental parameters during transit, enterprises significantly curb ethylene-induced spoilage and secure prolonged retail viability.
- This modernization of critical infrastructure enables producers to meet the stringent quality demands of modern retail buyers while protecting baseline profitability against unpredictable agricultural disruptions.
What are the Key Data Covered in this Peaches And Nectarines Market Research and Growth Report?
-
What is the expected growth of the Peaches And Nectarines Market between 2026 and 2030?
-
USD 6.41 billion, at a CAGR of 6.7%
-
-
What segmentation does the market report cover?
-
The report is segmented by Distribution Channel (Offline, and Online), Type (Peaches, Nectarines, and Combos), Application (Fresh consumption, Processing, Canning, and Beverages), Packaging (Bags, Boxes, and Cans) and Geography (APAC, Europe, North America, South America, Middle East and Africa)
-
-
Which regions are analyzed in the report?
-
APAC, Europe, North America, South America and Middle East and Africa
-
-
What are the key growth drivers and market challenges?
-
Shifting consumer preferences toward health and wellness, Escalating climatic volatility and extreme weather disruptions
-
-
Who are the major players in the Peaches And Nectarines Market?
-
Alfa Vita S.A., Capespan Group Ltd, Capespan North America LLC, Chelan Fresh, Copefrut S.A., Dole plc, Dutoit Group, Family Tree Farms, Fresh Del Monte Produce Inc., Hortgro, Montague Farms Pty Ltd, PR Farms Inc., Prima Frutta Packing Inc., SanLucar Fruit S.L.U., Stemilt Growers LLC, Sun World International LLC, T and G Global Ltd, The Oppenheimer Group, Unifrutti Group and Wawona Frozen Foods Inc.
-
Market Research Insights
- The Peaches And Nectarines market is undergoing rapid structural optimization driven by modern omnichannel grocery distribution and advanced supply chain frameworks. Retailers focusing on premium fresh produce have integrated direct-to-consumer farm shipping, resulting in a 24% reduction in transit-related spoilage. By aligning seasonal harvest cycles with predictive data analytics, agricultural operators have improved inventory turnover rates by 15%.
- Furthermore, the widespread adoption of sustainable farming practices and advanced cold-storage networks has lowered post-harvest energy consumption by 11%. These measurable operational enhancements ensure that highly perishable commodities maintain strict quality parameters, allowing distributors to capture higher profit margins while effectively meeting the rigorous demands of health-conscious demographics.
We can help! Our analysts can customize this peaches and nectarines market research report to meet your requirements.
 RIA -
RIA - 
