Personal Mobility Devices Market Analysis North America, Europe, Asia, Rest of World (ROW) - US, Germany, France, China, India - Size and Forecast 2024-2028

Personal Mobility Devices Market Analysis North America, Europe, Asia, Rest of World (ROW) - US, Germany, France, China, India - Size and Forecast 2024-2028

Published: Jan 2024 150 Pages SKU: IRTNTR77253

Market Overview at a Glance

$3.75 B
Market Opportunity
7.68%
CAGR
6.69
YoY growth 2023-2024(%)

Personal Mobility Devices Market Size 2024-2028

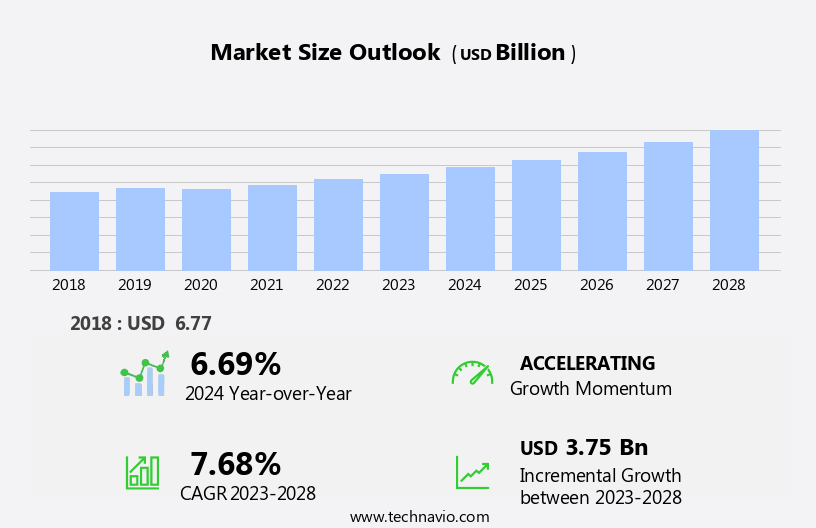
The personal mobility devices market size is forecast to increase by USD 3.75 billion, at a CAGR of 7.68% between 2023 and 2028.

  • The market is experiencing significant growth, driven by the increasing number of orthopedic and neurological disorders that necessitate the use of these devices. This trend is expected to continue as the global population ages and the prevalence of chronic conditions increases. Another key driver is the automation of manually operated personal mobility devices, which enhances user experience and convenience. However, the high cost associated with these devices poses a significant challenge for both manufacturers and consumers. Despite this, opportunities exist for companies to differentiate themselves through innovative product design, affordable pricing strategies, and partnerships with healthcare providers and insurers.
  • Additionally, the integration of advanced technologies, such as artificial intelligence and IoT, can add value to personal mobility devices, creating new revenue streams and enhancing user experience. Companies must navigate these opportunities and challenges effectively to capitalize on the market's potential and meet the evolving needs of their customer base.

What will be the Size of the Personal Mobility Devices Market during the forecast period?

Personal Mobility Devices Market Size

Explore in-depth regional segment analysis with market size data - historical 2018-2022 and forecasts 2024-2028 - in the full report.  
Request Free Sample

The market continues to evolve, with innovations in user interface design, charging time optimization, and speedometer accuracy driving advancements in various sectors. Devices now integrate regenerative braking systems and hill climbing assist, ensuring optimal energy efficiency and enhanced performance. Tire pressure monitoring and segway balancing algorithms provide improved stability and safety, while cruise control functions offer a smoother riding experience. Ergonomic handlebar designs and three-wheeled scooter designs cater to diverse user needs, and wheelchair accessibility features expand the market's reach. Maximum speed control and folding mechanism designs enable easy transportation, while hoverboard stability control and electric motor efficiency optimize user experience.

Lithium-ion battery life and anti-theft systems address concerns, and suspension system performance and power assist systems cater to diverse user requirements. Ongoing advancements in battery thermal management and GPS tracking systems further enhance the functionality of these devices. The market's dynamics continue to unfold, with continuous innovation shaping the future of personal mobility solutions.

How is this Personal Mobility Devices Industry segmented?

The personal mobility devices industry research report provides comprehensive data (region-wise segment analysis), with forecasts and estimates in "USD billion" for the period 2024-2028, as well as historical data from 2018-2022 for the following segments.

  • End-user
    • Homecare
    • Hospitals
    • Others
  • Product
    • Wheelchairs
    • Walking aids
    • Scooters and others
  • Geography
    • North America
      • US
    • Europe
      • France
      • Germany
    • APAC
      • China
      • India
    • Rest of World (ROW)

By End-user Insights

The homecare segment is estimated to witness significant growth during the forecast period.

The market in homecare settings is experiencing significant growth due to an aging population and the rising prevalence of chronic health conditions. Advanced technologies such as regenerative braking systems, hill climbing assist, and tire pressure monitoring are enhancing the functionality and safety of mobility aids like wheelchairs, rollators, and mobility scooters. The Segway balancing algorithm and cruise control function offer users greater mobility and convenience, while ergonomic handlebar designs improve comfort and ease of use. Three-wheeled scooter designs provide better maneuverability, and wheelchair accessibility features cater to individuals with specific needs. User weight limits and frame material strength ensure durability, while lightweight chassis designs and battery thermal management systems extend the device's lifespan.

User interface designs optimize charging time, and speedometer accuracy and maximum speed control offer users greater control. Folding mechanism designs and hoverboard stability control make transportation and storage more convenient, and anti-theft systems provide peace of mind. Suspension system performance and power assist systems improve mobility, and lithium-ion battery life and scooter braking systems ensure reliable operation. GPS tracking systems offer added security and convenience for users. In-home care is increasingly focusing on enabling individuals to maintain their independence and improve their quality of life, making personal mobility devices an essential component of this trend.

Personal Mobility Devices Market Size

Request Free Sample

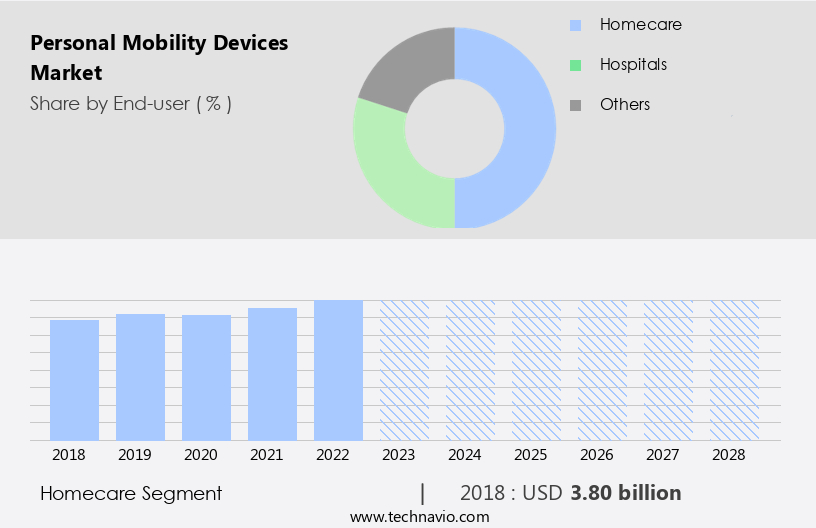
The Homecare segment was valued at USD 3.80 billion in 2018 and showed a gradual increase during the forecast period.

Regional Analysis

North America is estimated to contribute 37% to the growth of the global market during the forecast period. Technavio's analysts have elaborately explained the regional trends and drivers that shape the market during the forecast period.

Personal Mobility Devices Market Share by Geography

 Request Free Sample

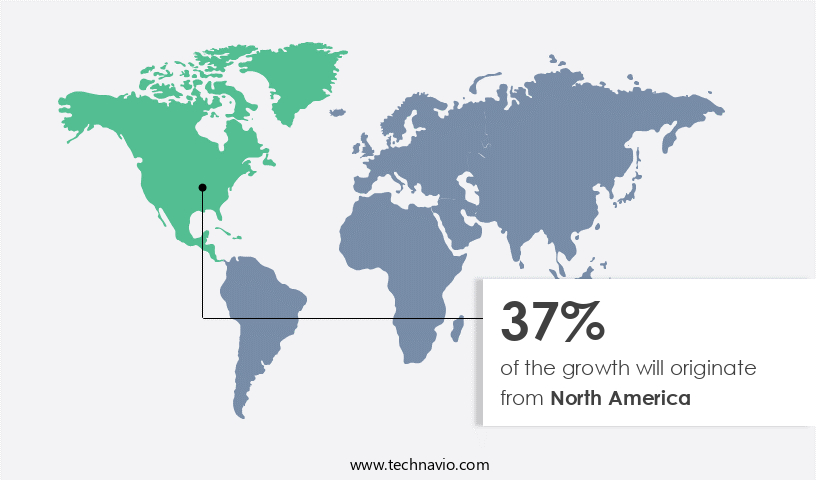
In the dynamic US market for personal mobility devices, several advanced features are gaining traction. Regenerative braking systems are increasingly being integrated to enhance energy efficiency and extend battery life. Hill climbing assist technology aids users in navigating steep inclines with ease, while tire pressure monitoring ensures optimal performance and safety. The Segway balancing algorithm and cruise control function offer a smooth riding experience, and ergonomic handlebar designs cater to user comfort. Three-wheeled scooter designs provide agility and maneuverability, making them popular among users. Wheelchair accessibility features are crucial for individuals with mobility limitations, expanding the market's reach.

User weight limits vary among devices, necessitating robust frame material strength and lightweight chassis designs. Battery thermal management is essential for maintaining optimal battery performance and longevity. User interface designs prioritize simplicity and ease of use, while charging time optimization and speedometer accuracy ensure convenience. Maximum speed control and folding mechanism designs cater to diverse user needs. Hoverboard stability control and electric motor efficiency are key considerations for balanced and efficient operation. Anti-theft systems offer peace of mind, and suspension system performance enhances user comfort. Power assist systems cater to users with varying energy requirements, and lithium-ion battery life determines the overall value proposition.

Scooter braking systems are crucial for safe stopping, and GPS tracking systems provide added security and convenience. The market's evolution reflects the growing demand for innovative, efficient, and accessible mobility solutions.

Market Dynamics

Our researchers analyzed the data with 2023 as the base year, along with the key drivers, trends, and challenges. A holistic analysis of drivers will help companies refine their marketing strategies to gain a competitive advantage.

The market encompasses a wide range of technologies and solutions designed to enhance the mobility of individuals with various physical limitations or disabilities. Focusing on this market's evolving nature, these devices offer innovative solutions through methods such as advanced battery technology and lightweight materials. With considerations like user-friendly designs and customizable features becoming increasingly important, the market is a significant area of growth. Key applications of personal mobility devices include power chairs, scooters, and wheelchairs. Power chairs, for instance, provide users with the ability to maneuver around their environment with ease, allowing them to maintain independence and mobility. Scooters, another essential mobility device, offer a more portable solution for individuals who require assistance with longer distances. Lastly, wheelchairs continue to be a vital component of personal mobility devices, with advancements in materials and design making them more comfortable and functional. Through methods such as market segmentation and trend analysis, the market is being studied extensively to understand its various aspects. Key areas involve demographic trends, technological advancements, and regulatory requirements. Demographic trends, including an aging population and an increase in individuals with disabilities, are driving demand for personal mobility devices. Technological advancements, such as the integration of smart technology and telehealth capabilities, are enhancing the functionality and convenience of these devices. Regulatory requirements, on the other hand, ensure the safety and accessibility of personal mobility devices for all users. In conclusion, the market is a dynamic and growing industry that offers innovative solutions for individuals with mobility limitations. By focusing on user needs, technological advancements, and regulatory requirements, this market is poised for continued growth and development.

What are the key market drivers leading to the rise in the adoption of Personal Mobility Devices Industry?

  • The prevalence of orthopedic and neurologic disorders serves as the primary growth factor for the market, as the increasing incidence and prevalence of these conditions drive demand for effective treatments and interventions. 
  • The market is experiencing significant growth due to the increasing prevalence of orthopedic and neurological conditions. These conditions, including rheumatoid arthritis, knee problems, and hip arthritis, necessitate the use of mobility devices such as wheelchairs and scooters for patients to move around independently. Factors such as medical emergencies, long-term and short-term disabilities, and the rising number of surgical procedures further fuel market growth. Advanced features, such as regenerative braking systems, hill climbing assist, tire pressure monitoring, segway balancing algorithms, cruise control functions, and ergonomic handlebar designs, enhance the user experience and convenience. These features cater to the needs of an aging population, who are more susceptible to conditions affecting mobility.
  • The market is poised for continued growth, driven by the increasing demand for mobility solutions to address various medical conditions and enable greater independence for individuals.

What are the market trends shaping the Personal Mobility Devices Industry?

  • The automation of manually operated personal mobility products is an emerging market trend. This shift towards automated technology aims to enhance the user experience and increase efficiency in personal mobility solutions.
  • Personal mobility devices, including three-wheeled scooters and wheelchairs, have gained significant traction in recent years due to their accessibility features and user-friendly design. These devices offer increased mobility for individuals with mobility challenges, enabling them to move around with ease and independence. Smart technology has played a crucial role in the evolution of personal mobility devices. For instance, electric wheelchairs and smart wheelchair systems can be controlled via mobile apps or Bluetooth devices, offering users greater convenience and autonomy. The US and Canadian markets have shown a strong adoption rate for these devices due to their high disposable income and healthcare spending.
  • Frame material strength and lightweight chassis design are essential considerations in the development of personal mobility devices, ensuring durability and ease of use. Moreover, battery thermal management is a critical aspect of these devices' design, ensuring optimal performance and longevity. As the market continues to grow, research and development efforts are focused on enhancing user experience, safety, and functionality. Personal mobility devices have become indispensable tools for improving the lives of individuals with mobility challenges. With ongoing advancements in technology and design, these devices will continue to offer innovative solutions for enhancing mobility and independence.

What challenges does the Personal Mobility Devices Industry face during its growth?

  • The high cost of personal mobility devices poses a significant challenge to the industry's growth trajectory. 
  • The market faces challenges due to the high cost of advanced technologies and limited government reimbursements. These factors hinder the market's growth, making these devices inaccessible for many users. The average cost of electric wheelchairs ranges from USD1,350 to USD1,700. To address these issues, manufacturers focus on user interface design, charging time optimization, speedometer accuracy, maximum speed control, folding mechanism design, and hoverboard stability control.
  • These features aim to enhance the user experience while ensuring safety and efficiency. Despite the challenges, the market continues to evolve, driven by technological advancements and the increasing demand for personal mobility solutions.

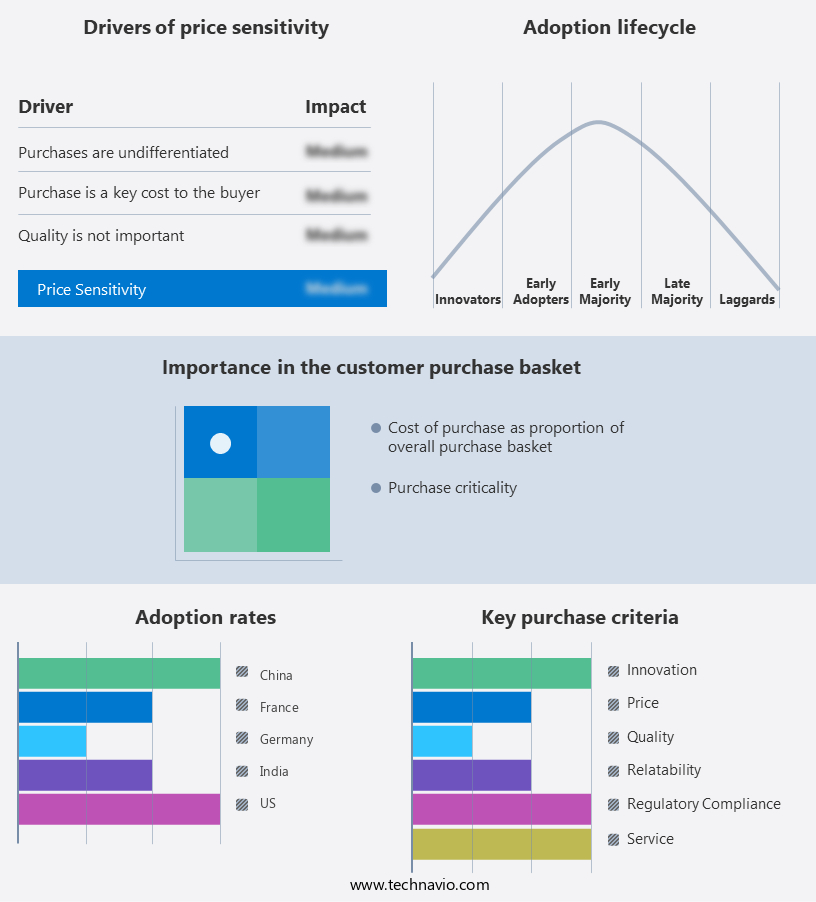
Exclusive Customer Landscape

The personal mobility devices market forecasting report includes the adoption lifecycle of the market, covering from the innovator's stage to the laggard's stage. It focuses on adoption rates in different regions based on penetration. Furthermore, the personal mobility devices market report also includes key purchase criteria and drivers of price sensitivity to help companies evaluate and develop their market growth analysis strategies.

Personal Mobility Devices Market Share by Geography

 Customer Landscape

Key Companies & Market Insights

Companies are implementing various strategies, such as strategic alliances, personal mobility devices market forecast, partnerships, mergers and acquisitions, geographical expansion, and product/service launches, to enhance their presence in the industry.

Comfort Orthopedic Co. Ltd. - This company specializes in providing mobility solutions through innovative devices, including the LY EW402 U and LY EW402 PLUS medium mobility scooters. 

The industry research and growth report includes detailed analyses of the competitive landscape of the market and information about key companies, including:

  • Comfort Orthopedic Co. Ltd.
  • ComfyGO Inc.
  • GF Health Products Inc.
  • Golden Technologies
  • Hoveround Corp.
  • Invacare Corp.
  • Karma Medical Products Co. Ltd.
  • LEVO AG
  • Matsunaga Manufactory Co. Ltd.
  • Medical Depot Inc.
  • MEYRA GROUP
  • Ottobock SE and Co. KGaA
  • Permobil AB
  • Pride Mobility Products Corp.
  • Roma Medical
  • Sunrise Medical LLC
  • Tzora Active Systems Ltd.
  • Vermeiren Group
  • WHILL Inc.
  • YATTLL Industry Co. Ltd.

Qualitative and quantitative analysis of companies has been conducted to help clients understand the wider business environment as well as the strengths and weaknesses of key industry players. Data is qualitatively analyzed to categorize companies as pure play, category-focused, industry-focused, and diversified; it is quantitatively analyzed to categorize companies as dominant, leading, strong, tentative, and weak.

Recent Development and News in Personal Mobility Devices Market

  • In January 2024, Whiz Mobility, a leading Personal Mobility Devices (PMD) manufacturer, launched its new product line, the WhizGo X, featuring advanced AI navigation and longer battery life, at the Consumer Electronics Show (CES) in Las Vegas (Whiz Mobility Press Release, 2024).
  • In March 2024, Medtronic, a global healthcare solutions company, and Segway, a renowned PMD manufacturer, announced a strategic partnership to integrate Segway's mobility devices with Medtronic's healthcare technology, aiming to enhance mobility solutions for elderly and disabled individuals (Medtronic Press Release, 2024).
  • In May 2024, Hovertrax, a US-based PMD manufacturer, raised USD50 million in a Series C funding round led by Daimler AG and LG Chem, to expand its production capacity and invest in research and development (Hovertrax Press Release, 2024).
  • In February 2025, the European Union (EU) passed the 'European Accessibility Act,' mandating accessibility features in various products, including PMDs, to improve accessibility for people with disabilities (European Parliament Press Release, 2025).

Research Analyst Overview

  • The market is witnessing significant advancements, with key players focusing on enhancing product lifecycle management and manufacturing process efficiency. Remote diagnostics capabilities are becoming essential for identifying and addressing maintenance issues promptly, reducing downtime and costs. Range extender technology is a notable trend, extending the devices' operational range, catering to the evolving user needs. Durability testing standards and component reliability testing are crucial for ensuring product longevity and dependability. Advanced safety features are gaining traction, prioritizing user experience (UX) and environmental impact assessment. Material selection criteria are increasingly centered around sustainability and eco-friendliness, aligning with supply chain sustainability initiatives.
  • Brushless DC motors and energy consumption metrics are critical factors influencing the market dynamics. Manufacturers are investing in manufacturing process improvements to optimize energy efficiency and reduce production costs. Mobility aid regulations and accessibility compliance standards continue to shape the market landscape, with ride-sharing programs emerging as a potential growth area. In the realm of product development, user experience (UX) is a primary consideration, with manufacturers focusing on integrating advanced safety features and seamless connectivity solutions. Environmental impact assessment and mobility aid regulations are shaping the design for assembly processes, ensuring compliance and sustainability. Component reliability testing and maintenance cost analysis are essential aspects of the market, with manufacturers continually striving to improve product durability and minimize long-term maintenance costs.
  • Overall, the market is characterized by a focus on innovation, efficiency, and sustainability, with key players addressing the evolving needs and expectations of end-users.

Dive into Technavio's robust research methodology, blending expert interviews, extensive data synthesis, and validated models for unparalleled Personal Mobility Devices Market insights. See full methodology.

Market Scope

Report Coverage

Details

Page number

150

Base year

2023

Historic period

2018-2022

Forecast period

2024-2028

Growth momentum & CAGR

Accelerate at a CAGR of 7.68%

Market growth 2024-2028

USD 3.75 billion

Market structure

Fragmented

YoY growth 2023-2024(%)

6.69

Key countries

US, Germany, France, China, and India

Competitive landscape

Leading Companies, Market Positioning of Companies, Competitive Strategies, and Industry Risks

Request Free Sample

What are the Key Data Covered in this Personal Mobility Devices Market Research and Growth Report?

  • CAGR of the Personal Mobility Devices industry during the forecast period
  • Detailed information on factors that will drive the growth and forecasting between 2024 and 2028
  • Precise estimation of the size of the market and its contribution of the industry in focus to the parent market
  • Accurate predictions about upcoming growth and trends and changes in consumer behaviour
  • Growth of the market across North America, Europe, Asia, and Rest of World (ROW)
  • Thorough analysis of the market's competitive landscape and detailed information about companies
  • Comprehensive analysis of factors that will challenge the personal mobility devices market growth of industry companies

We can help! Our analysts can customize this personal mobility devices market research report to meet your requirements.

Get in touch

1 Executive Summary

  • 1.1 Market overview
    • Exhibit 01: Executive Summary – Chart on Market Overview
    • Exhibit 02: Executive Summary – Data Table on Market Overview
    • Exhibit 03: Executive Summary – Chart on Global Market Characteristics
    • Exhibit 04: Executive Summary – Chart on Market by Geography
    • Exhibit 05: Executive Summary – Chart on Market Segmentation by End-user
    • Exhibit 06: Executive Summary – Chart on Market Segmentation by Product
    • Exhibit 07: Executive Summary – Chart on Incremental Growth
    • Exhibit 08: Executive Summary – Data Table on Incremental Growth
    • Exhibit 09: Executive Summary – Chart on Vendor Market Positioning

2 Market Landscape

  • 2.1 Market ecosystem
    • Exhibit 10: Parent market
    • Exhibit 11: Market Characteristics

3 Market Sizing

  • 3.1 Market definition
    • Exhibit 12: Offerings of vendors included in the market definition
  • 3.2 Market segment analysis
    • Exhibit 13: Market segments
  • 3.3 Market size 2023
    • 3.4 Market outlook: Forecast for 2023-2028
      • Exhibit 14: Chart on Global - Market size and forecast 2023-2028 ($ billion)
      • Exhibit 15: Data Table on Global - Market size and forecast 2023-2028 ($ billion)
      • Exhibit 16: Chart on Global Market: Year-over-year growth 2023-2028 (%)
      • Exhibit 17: Data Table on Global Market: Year-over-year growth 2023-2028 (%)

    4 Historic Market Size

    • 4.1 Global personal mobility devices market 2018 - 2022
      • Exhibit 18: Historic Market Size – Data Table on global personal mobility devices market 2018 - 2022 ($ billion)
    • 4.2 End-user Segment Analysis 2018 - 2022
      • Exhibit 19: Historic Market Size – End-user Segment 2018 - 2022 ($ billion)
    • 4.3 Product Segment Analysis 2018 - 2022
      • Exhibit 20: Historic Market Size – Product Segment 2018 - 2022 ($ billion)
    • 4.4 Geography Segment Analysis 2018 - 2022
      • Exhibit 21: Historic Market Size – Geography Segment 2018 - 2022 ($ billion)
    • 4.5 Country Segment Analysis 2018 - 2022
      • Exhibit 22: Historic Market Size – Country Segment 2018 - 2022 ($ billion)

    5 Five Forces Analysis

    • 5.1 Five forces summary
      • Exhibit 23: Five forces analysis - Comparison between 2023 and 2028
    • 5.2 Bargaining power of buyers
      • Exhibit 24: Chart on Bargaining power of buyers – Impact of key factors 2023 and 2028
    • 5.3 Bargaining power of suppliers
      • Exhibit 25: Bargaining power of suppliers – Impact of key factors in 2023 and 2028
    • 5.4 Threat of new entrants
      • Exhibit 26: Threat of new entrants – Impact of key factors in 2023 and 2028
    • 5.5 Threat of substitutes
      • Exhibit 27: Threat of substitutes – Impact of key factors in 2023 and 2028
    • 5.6 Threat of rivalry
      • Exhibit 28: Threat of rivalry – Impact of key factors in 2023 and 2028
    • 5.7 Market condition
      • Exhibit 29: Chart on Market condition - Five forces 2023 and 2028

    6 Market Segmentation by End-user

    • 6.1 Market segments
      • Exhibit 30: Chart on End-user - Market share 2023-2028 (%)
      • Exhibit 31: Data Table on End-user - Market share 2023-2028 (%)
    • 6.2 Comparison by End-user
      • Exhibit 32: Chart on Comparison by End-user
      • Exhibit 33: Data Table on Comparison by End-user
    • 6.3 Homecare - Market size and forecast 2023-2028
      • Exhibit 34: Chart on Homecare - Market size and forecast 2023-2028 ($ billion)
      • Exhibit 35: Data Table on Homecare - Market size and forecast 2023-2028 ($ billion)
      • Exhibit 36: Chart on Homecare - Year-over-year growth 2023-2028 (%)
      • Exhibit 37: Data Table on Homecare - Year-over-year growth 2023-2028 (%)
    • 6.4 Hospitals - Market size and forecast 2023-2028
      • Exhibit 38: Chart on Hospitals - Market size and forecast 2023-2028 ($ billion)
      • Exhibit 39: Data Table on Hospitals - Market size and forecast 2023-2028 ($ billion)
      • Exhibit 40: Chart on Hospitals - Year-over-year growth 2023-2028 (%)
      • Exhibit 41: Data Table on Hospitals - Year-over-year growth 2023-2028 (%)
    • 6.5 Others - Market size and forecast 2023-2028
      • Exhibit 42: Chart on Others - Market size and forecast 2023-2028 ($ billion)
      • Exhibit 43: Data Table on Others - Market size and forecast 2023-2028 ($ billion)
      • Exhibit 44: Chart on Others - Year-over-year growth 2023-2028 (%)
      • Exhibit 45: Data Table on Others - Year-over-year growth 2023-2028 (%)
    • 6.6 Market opportunity by End-user
      • Exhibit 46: Market opportunity by End-user ($ billion)
      • Exhibit 47: Data Table on Market opportunity by End-user ($ billion)

    7 Market Segmentation by Product

    • 7.1 Market segments
      • Exhibit 48: Chart on Product - Market share 2023-2028 (%)
      • Exhibit 49: Data Table on Product - Market share 2023-2028 (%)
    • 7.2 Comparison by Product
      • Exhibit 50: Chart on Comparison by Product
      • Exhibit 51: Data Table on Comparison by Product
    • 7.3 Wheelchairs - Market size and forecast 2023-2028
      • Exhibit 52: Chart on Wheelchairs - Market size and forecast 2023-2028 ($ billion)
      • Exhibit 53: Data Table on Wheelchairs - Market size and forecast 2023-2028 ($ billion)
      • Exhibit 54: Chart on Wheelchairs - Year-over-year growth 2023-2028 (%)
      • Exhibit 55: Data Table on Wheelchairs - Year-over-year growth 2023-2028 (%)
    • 7.4 Walking aids - Market size and forecast 2023-2028
      • Exhibit 56: Chart on Walking aids - Market size and forecast 2023-2028 ($ billion)
      • Exhibit 57: Data Table on Walking aids - Market size and forecast 2023-2028 ($ billion)
      • Exhibit 58: Chart on Walking aids - Year-over-year growth 2023-2028 (%)
      • Exhibit 59: Data Table on Walking aids - Year-over-year growth 2023-2028 (%)
    • 7.5 Scooters and others - Market size and forecast 2023-2028
      • Exhibit 60: Chart on Scooters and others - Market size and forecast 2023-2028 ($ billion)
      • Exhibit 61: Data Table on Scooters and others - Market size and forecast 2023-2028 ($ billion)
      • Exhibit 62: Chart on Scooters and others - Year-over-year growth 2023-2028 (%)
      • Exhibit 63: Data Table on Scooters and others - Year-over-year growth 2023-2028 (%)
    • 7.6 Market opportunity by Product
      • Exhibit 64: Market opportunity by Product ($ billion)
      • Exhibit 65: Data Table on Market opportunity by Product ($ billion)

    8 Customer Landscape

    • 8.1 Customer landscape overview
      • Exhibit 66: Analysis of price sensitivity, lifecycle, customer purchase basket, adoption rates, and purchase criteria

    9 Geographic Landscape

    • 9.1 Geographic segmentation
      • Exhibit 67: Chart on Market share by geography 2023-2028 (%)
      • Exhibit 68: Data Table on Market share by geography 2023-2028 (%)
    • 9.2 Geographic comparison
      • Exhibit 69: Chart on Geographic comparison
      • Exhibit 70: Data Table on Geographic comparison
    • 9.3 North America - Market size and forecast 2023-2028
      • Exhibit 71: Chart on North America - Market size and forecast 2023-2028 ($ billion)
      • Exhibit 72: Data Table on North America - Market size and forecast 2023-2028 ($ billion)
      • Exhibit 73: Chart on North America - Year-over-year growth 2023-2028 (%)
      • Exhibit 74: Data Table on North America - Year-over-year growth 2023-2028 (%)
    • 9.4 Europe - Market size and forecast 2023-2028
      • Exhibit 75: Chart on Europe - Market size and forecast 2023-2028 ($ billion)
      • Exhibit 76: Data Table on Europe - Market size and forecast 2023-2028 ($ billion)
      • Exhibit 77: Chart on Europe - Year-over-year growth 2023-2028 (%)
      • Exhibit 78: Data Table on Europe - Year-over-year growth 2023-2028 (%)
    • 9.5 Asia - Market size and forecast 2023-2028
      • Exhibit 79: Chart on Asia - Market size and forecast 2023-2028 ($ billion)
      • Exhibit 80: Data Table on Asia - Market size and forecast 2023-2028 ($ billion)
      • Exhibit 81: Chart on Asia - Year-over-year growth 2023-2028 (%)
      • Exhibit 82: Data Table on Asia - Year-over-year growth 2023-2028 (%)
    • 9.6 Rest of World (ROW) - Market size and forecast 2023-2028
      • Exhibit 83: Chart on Rest of World (ROW) - Market size and forecast 2023-2028 ($ billion)
      • Exhibit 84: Data Table on Rest of World (ROW) - Market size and forecast 2023-2028 ($ billion)
      • Exhibit 85: Chart on Rest of World (ROW) - Year-over-year growth 2023-2028 (%)
      • Exhibit 86: Data Table on Rest of World (ROW) - Year-over-year growth 2023-2028 (%)
    • 9.7 US - Market size and forecast 2023-2028
      • Exhibit 87: Chart on US - Market size and forecast 2023-2028 ($ billion)
      • Exhibit 88: Data Table on US - Market size and forecast 2023-2028 ($ billion)
      • Exhibit 89: Chart on US - Year-over-year growth 2023-2028 (%)
      • Exhibit 90: Data Table on US - Year-over-year growth 2023-2028 (%)
    • 9.8 China - Market size and forecast 2023-2028
      • Exhibit 91: Chart on China - Market size and forecast 2023-2028 ($ billion)
      • Exhibit 92: Data Table on China - Market size and forecast 2023-2028 ($ billion)
      • Exhibit 93: Chart on China - Year-over-year growth 2023-2028 (%)
      • Exhibit 94: Data Table on China - Year-over-year growth 2023-2028 (%)
    • 9.9 Germany - Market size and forecast 2023-2028
      • Exhibit 95: Chart on Germany - Market size and forecast 2023-2028 ($ billion)
      • Exhibit 96: Data Table on Germany - Market size and forecast 2023-2028 ($ billion)
      • Exhibit 97: Chart on Germany - Year-over-year growth 2023-2028 (%)
      • Exhibit 98: Data Table on Germany - Year-over-year growth 2023-2028 (%)
    • 9.10 India - Market size and forecast 2023-2028
      • Exhibit 99: Chart on India - Market size and forecast 2023-2028 ($ billion)
      • Exhibit 100: Data Table on India - Market size and forecast 2023-2028 ($ billion)
      • Exhibit 101: Chart on India - Year-over-year growth 2023-2028 (%)
      • Exhibit 102: Data Table on India - Year-over-year growth 2023-2028 (%)
    • 9.11 France - Market size and forecast 2023-2028
      • Exhibit 103: Chart on France - Market size and forecast 2023-2028 ($ billion)
      • Exhibit 104: Data Table on France - Market size and forecast 2023-2028 ($ billion)
      • Exhibit 105: Chart on France - Year-over-year growth 2023-2028 (%)
      • Exhibit 106: Data Table on France - Year-over-year growth 2023-2028 (%)
    • 9.12 Market opportunity by geography
      • Exhibit 107: Market opportunity by geography ($ billion)
      • Exhibit 108: Data Tables on Market opportunity by geography ($ billion)

    10 Drivers, Challenges, and Trends

    • 10.1 Market drivers
      • 10.2 Market challenges
        • 10.3 Impact of drivers and challenges
          • Exhibit 109: Impact of drivers and challenges in 2023 and 2028
        • 10.4 Market trends

          11 Vendor Landscape

          • 11.1 Overview
            • 11.2 Vendor landscape
              • Exhibit 110: Overview on Criticality of inputs and Factors of differentiation
            • 11.3 Landscape disruption
              • Exhibit 111: Overview on factors of disruption
            • 11.4 Industry risks
              • Exhibit 112: Impact of key risks on business

            12 Vendor Analysis

            • 12.1 Vendors covered
              • Exhibit 113: Vendors covered
            • 12.2 Market positioning of vendors
              • Exhibit 114: Matrix on vendor position and classification
            • 12.3 Comfort Orthopedic Co. Ltd.
              • Exhibit 115: Comfort Orthopedic Co. Ltd. - Overview
              • Exhibit 116: Comfort Orthopedic Co. Ltd. - Product / Service
              • Exhibit 117: Comfort Orthopedic Co. Ltd. - Key offerings
            • 12.4 GF Health Products Inc.
              • Exhibit 118: GF Health Products Inc. - Overview
              • Exhibit 119: GF Health Products Inc. - Product / Service
              • Exhibit 120: GF Health Products Inc. - Key offerings
            • 12.5 Golden Technologies
              • Exhibit 121: Golden Technologies - Overview
              • Exhibit 122: Golden Technologies - Product / Service
              • Exhibit 123: Golden Technologies - Key offerings
            • 12.6 Hoveround Corp.
              • Exhibit 124: Hoveround Corp. - Overview
              • Exhibit 125: Hoveround Corp. - Product / Service
              • Exhibit 126: Hoveround Corp. - Key offerings
            • 12.7 Invacare Corp.
              • Exhibit 127: Invacare Corp. - Overview
              • Exhibit 128: Invacare Corp. - Business segments
              • Exhibit 129: Invacare Corp. - Key offerings
              • Exhibit 130: Invacare Corp. - Segment focus
            • 12.8 Karma Medical Products Co. Ltd.
              • Exhibit 131: Karma Medical Products Co. Ltd. - Overview
              • Exhibit 132: Karma Medical Products Co. Ltd. - Product / Service
              • Exhibit 133: Karma Medical Products Co. Ltd. - Key offerings
            • 12.9 LEVO AG
              • Exhibit 134: LEVO AG - Overview
              • Exhibit 135: LEVO AG - Product / Service
              • Exhibit 136: LEVO AG - Key offerings
            • 12.10 Matsunaga Manufactory Co. Ltd.
              • Exhibit 137: Matsunaga Manufactory Co. Ltd. - Overview
              • Exhibit 138: Matsunaga Manufactory Co. Ltd. - Product / Service
              • Exhibit 139: Matsunaga Manufactory Co. Ltd. - Key offerings
            • 12.11 Medical Depot Inc.
              • Exhibit 140: Medical Depot Inc. - Overview
              • Exhibit 141: Medical Depot Inc. - Product / Service
              • Exhibit 142: Medical Depot Inc. - Key offerings
            • 12.12 MEYRA GROUP
              • Exhibit 143: MEYRA GROUP - Overview
              • Exhibit 144: MEYRA GROUP - Product / Service
              • Exhibit 145: MEYRA GROUP - Key offerings
            • 12.13 Ottobock SE and Co. KGaA
              • Exhibit 146: Ottobock SE and Co. KGaA - Overview
              • Exhibit 147: Ottobock SE and Co. KGaA - Product / Service
              • Exhibit 148: Ottobock SE and Co. KGaA - Key offerings
            • 12.14 Permobil AB
              • Exhibit 149: Permobil AB - Overview
              • Exhibit 150: Permobil AB - Product / Service
              • Exhibit 151: Permobil AB - Key offerings
            • 12.15 Pride Mobility Products Corp.
              • Exhibit 152: Pride Mobility Products Corp. - Overview
              • Exhibit 153: Pride Mobility Products Corp. - Product / Service
              • Exhibit 154: Pride Mobility Products Corp. - Key offerings
            • 12.16 Sunrise Medical LLC
              • Exhibit 155: Sunrise Medical LLC - Overview
              • Exhibit 156: Sunrise Medical LLC - Product / Service
              • Exhibit 157: Sunrise Medical LLC - Key offerings
            • 12.17 Vermeiren Group
              • Exhibit 158: Vermeiren Group - Overview
              • Exhibit 159: Vermeiren Group - Product / Service
              • Exhibit 160: Vermeiren Group - Key offerings

            13 Appendix

            • 13.1 Scope of the report
              • 13.2 Inclusions and exclusions checklist
                • Exhibit 161: Inclusions checklist
                • Exhibit 162: Exclusions checklist
              • 13.3 Currency conversion rates for US$
                • Exhibit 163: Currency conversion rates for US$
              • 13.4 Research methodology
                • Exhibit 164: Research methodology
                • Exhibit 165: Validation techniques employed for market sizing
                • Exhibit 166: Information sources
              • 13.5 List of abbreviations
                • Exhibit 167: List of abbreviations

              Research Methodology

              Technavio presents a detailed picture of the market by way of study, synthesis, and summation of data from multiple sources. The analysts have presented the various facets of the market with a particular focus on identifying the key industry influencers. The data thus presented is comprehensive, reliable, and the result of extensive research, both primary and secondary.

              INFORMATION SOURCES

              Primary sources

              • Manufacturers and suppliers
              • Channel partners
              • Industry experts
              • Strategic decision makers

              Secondary sources

              • Industry journals and periodicals
              • Government data
              • Financial reports of key industry players
              • Historical data
              • Press releases

              DATA ANALYSIS

              Data Synthesis

              • Collation of data
              • Estimation of key figures
              • Analysis of derived insights

              Data Validation

              • Triangulation with data models
              • Reference against proprietary databases
              • Corroboration with industry experts

              REPORT WRITING

              Qualitative

              • Market drivers
              • Market challenges
              • Market trends
              • Five forces analysis

              Quantitative

              • Market size and forecast
              • Market segmentation
              • Geographical insights
              • Competitive landscape

              Interested in this report?

              Get your sample now to see our research methodology and insights!

              Download Now

              Frequently Asked Questions

              Personal Mobility Devices market growth will increase by $ 3.75 bn during 2024-2028.

              The Personal Mobility Devices market is expected to grow at a CAGR of 7.68% during 2024-2028.

              Personal Mobility Devices market is segmented by End-user( Homecare, Hospitals, Others) Product( Wheelchairs, Walking aids, Scooters and others)

              Comfort Orthopedic Co. Ltd., ComfyGO Inc., GF Health Products Inc., Golden Technologies, Hoveround Corp., Invacare Corp., Karma Medical Products Co. Ltd., LEVO AG, Matsunaga Manufactory Co. Ltd., Medical Depot Inc., MEYRA GROUP, Ottobock SE and Co. KGaA, Permobil AB, Pride Mobility Products Corp., Roma Medical, Sunrise Medical LLC, Tzora Active Systems Ltd., Vermeiren Group, WHILL Inc., YATTLL Industry Co. Ltd. are a few of the key vendors in the Personal Mobility Devices market.

              North America will register the highest growth rate of 37% among the other regions. Therefore, the Personal Mobility Devices market in North America is expected to garner significant business opportunities for the vendors during the forecast period.

              US, Germany, France, China, India

              • Increasing number of orthopedic and neurologic disordersWith an increase in the number of orthopedic conditions and neurological conditions is the driving factor this market.
              • the demand for personal mobility devices is growing. Orthopedic conditions such as rheumatoid arthritis is the driving factor this market.
              • knee problems is the driving factor this market.
              • and recovery after orthopedic surgeries (after bone fractures) require personal mobility devices such as wheelchairs is the driving factor this market.
              • which can help patients move from one place to another without depending on others. Factors such as medical emergencies is the driving factor this market.
              • long-term and short-term disabilities is the driving factor this market.
              • and the rise in the number of surgical operations are further driving the market in focus as they require medical mobility devices. Conditions such as arthritis in the knees and hips and bone fractures mainly affect the older population. This is leading to an increase in the dependency of individuals on family members and caregivers is the driving factor this market.
              • which creates demand for personal mobility devices. Electric wheelchairs are a type of power wheelchair that helps arthritis patients move around comfortably. Sometimes is the driving factor this market.
              • based on the arthritis condition is the driving factor this market.
              • a physician can prescribe an electric wheelchair with an elevated footrest or a fixed-angle footrest. Some of the companies is the driving factor this market.
              • such as Hoveround is the driving factor this market.
              • offer an attachable round ball knob accessory along with the electric wheelchair controller. Attaching a soft and spongy yellow ball knob to the controller may add to the ease of use for some arthritis patients. The increase in the incidence of spinal muscular atrophy (SMA) is driving the growth of the global personal mobility devices market. Patients with SMA face many physical problems as this condition makes their muscles weak is the driving factor this market.
              • causing movement-related issues. For instance is the driving factor this market.
              • according to the National Health Service (NHS) is the driving factor this market.
              • around 1 in every 40 to 60 people in the UK is a carrier of the main faulty gene that causes SMA. People with SMA require personal mobility devices such as wheelchairs to move from one place to another because of their inability to sit up is the driving factor this market.
              • crawl is the driving factor this market.
              • and walk. Bariatric patients with orthopedic conditions require personal mobility devices with more weight capacity. Vendors are focusing on developing specialized products called bariatric or heavy-duty electric wheelchairs for obese people. For instance is the driving factor this market.
              • Medical Depot offers Enigma bariatric energy power chairs with maximum comfort and aesthetic appeal. Similarly is the driving factor this market.
              • Sunrise Medical offers a Quickie QM-715 heavy-duty power wheelchair is the driving factor this market.
              • which is certified by an assistive technology practitioner (ATP). With the growth in the number of people with cancer is the driving factor this market.
              • the demand for mobility aids is expected to increase further. Thus is the driving factor this market.
              • the increasing number of orthopedic and neurologic disorders is expected to augment the growth of the global personal mobility devices market during the forecast period.    is the driving factor this market.

              The Personal Mobility Devices market vendors should focus on grabbing business opportunities from the Homecare segment as it accounted for the largest market share in the base year.
              RIA - Research AI Assistant
              Ask RIA