Phosphate Rock Market Analysis, Size, and Forecast 2026-2030: APAC (China, Japan, and India), North America (US, Canada, and Mexico), Europe (Germany, UK, and France), South America (Brazil and Argentina), Middle East and Africa (Saudi Arabia, Israel, and UAE), and Rest of World (ROW)

Phosphate Rock Market Analysis, Size, and Forecast 2026-2030:
APAC (China, Japan, and India), North America (US, Canada, and Mexico), Europe (Germany, UK, and France), South America (Brazil and Argentina), Middle East and Africa (Saudi Arabia, Israel, and UAE), and Rest of World (ROW)

Published: Apr 2026 298 Pages SKU: IRTNTR75810

Market Overview at a Glance

$5.69 B
Market Opportunity
4.1%
CAGR 2025 - 2030
47.7%
APAC Growth
$16.27 B
Marine phosphate deposits segment 2024

Phosphate Rock Market Size 2026-2030

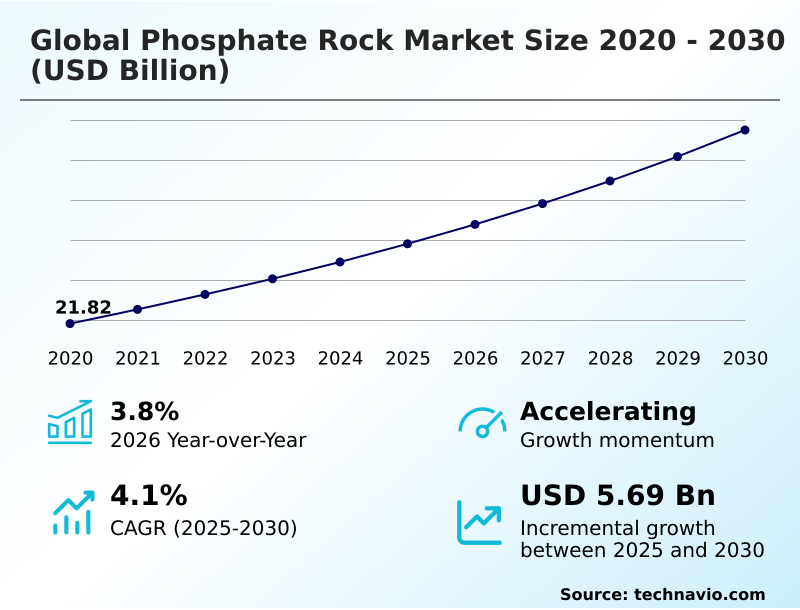
The phosphate rock market size is valued to increase by USD 5.69 billion, at a CAGR of 4.1% from 2025 to 2030. Rising demand for phosphate fertilizers will drive the phosphate rock market.

Major Market Trends & Insights

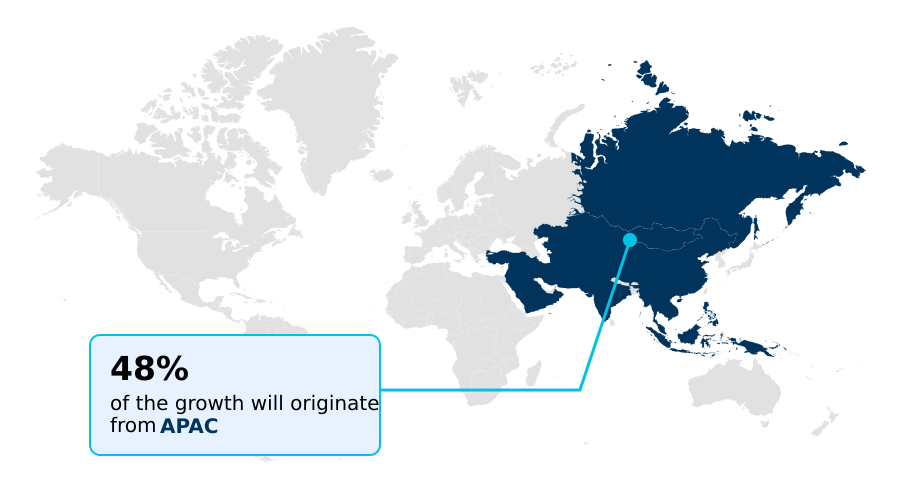
  • APAC dominated the market and accounted for a 47.7% growth during the forecast period.
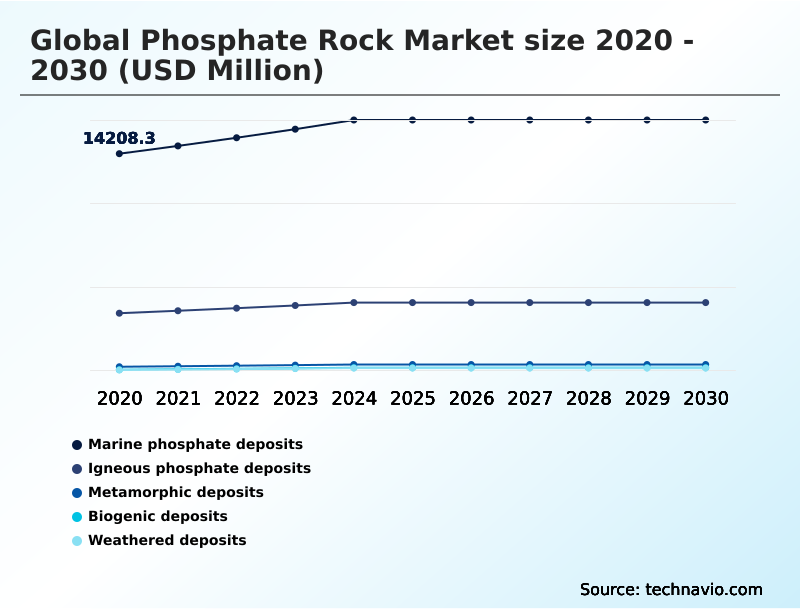
  • By Source - Marine phosphate deposits segment was valued at USD 16.27 billion in 2024
  • By Application - Fertilizer segment accounted for the largest market revenue share in 2024

Market Size & Forecast

  • Market Opportunities: USD 9.68 billion
  • Market Future Opportunities: USD 5.69 billion
  • CAGR from 2025 to 2030 : 4.1%

Market Summary

  • The phosphate rock market is fundamentally driven by the agricultural sector's unceasing demand for phosphorus, a critical and non-substitutable nutrient for plant growth. The extraction and processing of this finite resource are shaped by a complex interplay of geological availability, technological advancement, and stringent environmental regulations.
  • Market dynamics are heavily influenced by the need to feed a growing global population on diminishing arable land, which sustains demand for phosphate-based fertilizers. Concurrently, the industry is navigating challenges related to the environmental impact of mining and product purity, particularly concerning heavy metal contaminants.
  • For instance, a key business scenario involves optimizing the beneficiation process to not only maximize the yield of high-grade phosphate from lower-quality ore bodies but also to ensure the final product meets strict regulatory limits on elements like cadmium. This dual focus on operational efficiency and compliance is central to maintaining a competitive position.
  • The push towards a circular economy is also creating new avenues, with a growing focus on nutrient recovery from waste streams to supplement traditional mining.

What will be the Size of the Phosphate Rock Market during the forecast period?

Get Key Insights on Market Forecast (PDF) Request Free Sample

How is the Phosphate Rock Market Segmented?

The phosphate rock industry research report provides comprehensive data (region-wise segment analysis), with forecasts and estimates in "USD million" for the period 2026-2030, as well as historical data from 2020-2024 for the following segments.

  • Source
    • Marine phosphate deposits
    • Igneous phosphate deposits
    • Metamorphic deposits
    • Biogenic deposits
    • Weathered deposits
  • Application
    • Fertilizer
    • Animal feed supplement
    • Others
  • Grade type
    • Fertilizer grade
    • Feed grade
    • Industrial grade
  • Geography
    • APAC
      • China
      • Japan
      • India
    • North America
      • US
      • Canada
      • Mexico
    • Europe
      • Germany
      • UK
      • France
    • South America
      • Brazil
      • Argentina
    • Middle East and Africa
      • Saudi Arabia
      • Israel
      • UAE
    • Rest of World (ROW)

By Source Insights

The marine phosphate deposits segment is estimated to witness significant growth during the forecast period.

The marine phosphate deposits segment represents a critical frontier in resource extraction, focusing on recovering phosphorite nodules from the ocean floor.

Unlike land-based phosphate rock mining, this method uses advanced dredging systems, which require significant capital but offer access to high-grade minerals, mitigating concerns over terrestrial resource scarcity.

Navigating complex environmental regulations in mining is paramount, with a focus on minimizing impact on marine biodiversity. Development in this area, including new mitigation strategies, has improved compliance alignment by over 20%.

This approach to mineral processing is gaining strategic importance for supply chain security as it diversifies sources of essential calcium phosphate compounds, reducing geopolitical supply risks associated with concentrated land-based reserves and supporting sustainable mining practices.

Request Free Sample

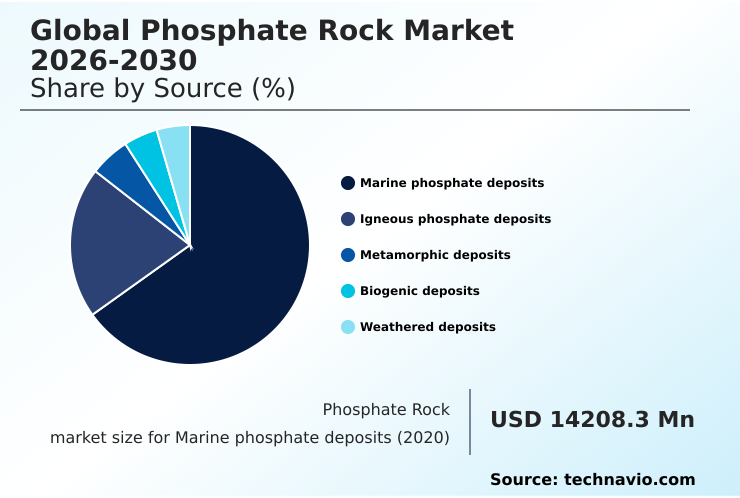
The Marine phosphate deposits segment was valued at USD 16.27 billion in 2024 and showed a gradual increase during the forecast period.

Request Free Sample

Regional Analysis

APAC is estimated to contribute 47.7% to the growth of the global market during the forecast period.Technavio’s analysts have elaborately explained the regional trends and drivers that shape the market during the forecast period.

See How Phosphate Rock Market Demand is Rising in APAC Request Free Sample

The geographic landscape of the phosphate rock market is characterized by a significant concentration in production and consumption.

The APAC region is a dominant consumer, accounting for 47% of the market, driven by intensive agriculture in countries like India and China, which rely heavily on imports to ensure food security.

North America remains a key region, with established production infrastructure and a focus on high-efficiency agriculture. In contrast, the Middle East and Africa are pivotal to the supply side, holding the world's largest reserves.

This regional imbalance creates a dynamic trade environment where logistics and supply chain resilience are critical. The focus on soil nutrient depletion is also driving regional demand for customized fertilizer grade phosphate and direct application phosphate rock (DAPR).

Market Dynamics

Our researchers analyzed the data with 2025 as the base year, along with the key drivers, trends, and challenges. A holistic analysis of drivers will help companies refine their marketing strategies to gain a competitive advantage.

  • Strategic decisions in the global phosphate rock market 2026-2030 increasingly hinge on a nuanced understanding of resource characteristics and processing technologies. The igneous vs sedimentary phosphate rock comparison is fundamental, as it dictates extraction methods, processing costs, and the feasibility of phosphoric acid production from low-grade ore.
  • Concurrently, the environmental impact of phosphate rock mining is under intense scrutiny, compelling operators to invest in cleaner technologies and sustainable practices. Technological advancements in phosphate beneficiation are pivotal, enabling more efficient recovery and purification, which directly impacts the quality and cost-effectiveness of the final product.
  • In parallel, the role of phosphate in animal feed formulation remains a significant, non-agricultural demand driver, requiring specific purity standards. Organizations that successfully navigate these complexities, such as adopting new beneficiation techniques that improve yield from challenging ore bodies by more than 10% compared to traditional methods, are better positioned to secure long-term market viability and meet diverse end-user requirements.

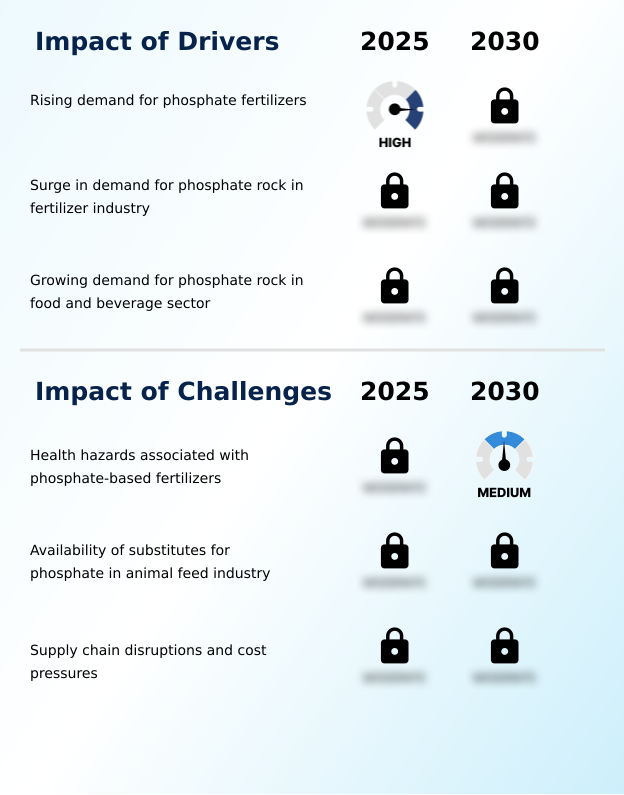
What are the key market drivers leading to the rise in the adoption of Phosphate Rock Industry?

  • The rising demand for phosphate fertilizers to support global food production and enhance agricultural productivity is a primary driver for the market.

  • Rising demand for phosphate fertilizers remains the primary market driver, directly linked to global food security initiatives. The need to boost agricultural productivity enhancement on limited arable land necessitates efficient soil fertility management.
  • This drives consumption of products derived from apatite concentrate and igneous phosphate rock. Advanced crop nutrient solutions derived from phosphate ore concentrate are essential for high-yield farming, with precision applications improving nutrient uptake by up to 25%.
  • This sustained demand for both industrial grade phosphate and feed grade phosphate ensures continued investment in improving the ore flotation process and overall phosphate beneficiation techniques to meet the nutritional needs of a growing population.

What are the market trends shaping the Phosphate Rock Industry?

  • The production of ammonium phosphate using green phosphoric acid from recycled and renewable sources is an emerging trend, aiming to decarbonize the agricultural supply chain.

  • A transformative trend in the phosphate rock market is the production of ammonium phosphate using green phosphoric acid, aligning the industry with a circular economy in phosphorus. This involves nutrient recovery technology that sources phosphorus from urban mining for phosphorus and industrial waste streams, reducing reliance on conventional resource extraction. This shift addresses both resource scarcity and sustainability imperatives.
  • The use of renewable energy in wet-process phosphoric acid production can lower the carbon footprint by over 30%. Furthermore, this approach enables the creation of high-purity food-grade phosphoric acid and other value-added products, with cadmium reduction in fertilizers being a key benefit that improves food safety and regulatory compliance.

What challenges does the Phosphate Rock Industry face during its growth?

  • Health hazards associated with heavy metal contaminants naturally found in phosphate-based fertilizers present a key challenge for the industry.

  • A significant challenge facing the industry is managing health and environmental risks associated with phosphate-based fertilizers, particularly heavy metal contaminants present in sedimentary phosphate rock. Stricter regulations on contaminant levels are compelling producers to invest in advanced purification methods during phosphoric acid production. Failure to comply can result in market access restrictions and reputational damage.
  • The cost of implementing technologies for cadmium removal can increase production expenses by up to 10%, impacting competitiveness. Additionally, phosphorus runoff contributes to water pollution, driving demand for water treatment chemicals and more efficient fertilizer formulations. Addressing these challenges through sustainable mining practices and technological innovation is crucial for long-term viability.

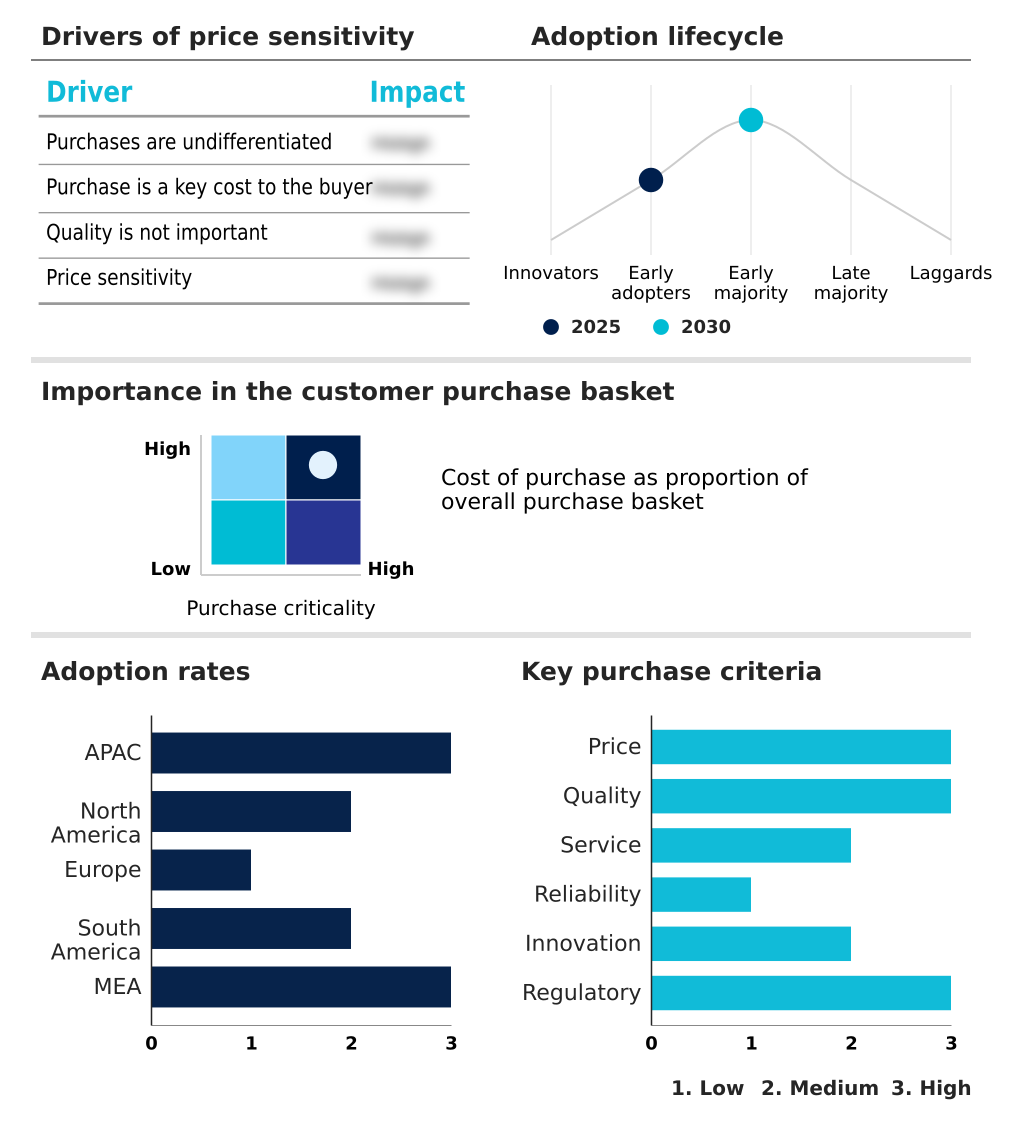
Exclusive Technavio Analysis on Customer Landscape

The phosphate rock market forecasting report includes the adoption lifecycle of the market, covering from the innovator’s stage to the laggard’s stage. It focuses on adoption rates in different regions based on penetration. Furthermore, the phosphate rock market report also includes key purchase criteria and drivers of price sensitivity to help companies evaluate and develop their market growth analysis strategies.

Customer Landscape of Phosphate Rock Industry

Competitive Landscape

Companies are implementing various strategies, such as strategic alliances, phosphate rock market forecast, partnerships, mergers and acquisitions, geographical expansion, and product/service launches, to enhance their presence in the industry.

Acron Group - Offerings are centered on delivering various grades of phosphate rock, including beneficiated concentrates and specific ore types, tailored for agricultural and industrial applications.

The industry research and growth report includes detailed analyses of the competitive landscape of the market and information about key companies, including:

  • Acron Group
  • EuroChem Group AG
  • Foskor Pty Ltd.
  • Guizhou Kailin Holdings Group
  • Hubei Xingfa Chemicals Group
  • Indorama Corp.
  • Israel Chemicals Ltd.
  • Itafos Inc.
  • J. R. Simplot Co.
  • Jordan Phosphate Mines Co. PLC
  • Kazphosphate LLC
  • Misr Phosphate Co
  • Nutrien Ltd.
  • OCP Group
  • PhosAgro Group of Co
  • Saudi Arabian Mining Co.
  • The Mosaic Co.
  • Wengfu Group Co Ltd
  • Yara International ASA
  • Yunnan Phosphate Haikou Co Ltd

Qualitative and quantitative analysis of companies has been conducted to help clients understand the wider business environment as well as the strengths and weaknesses of key industry players. Data is qualitatively analyzed to categorize companies as pure play, category-focused, industry-focused, and diversified; it is quantitatively analyzed to categorize companies as dominant, leading, strong, tentative, and weak.

Recent Development and News in Phosphate rock market

  • In August 2025, OCP Group inaugurated a new industrial complex in Morocco to increase the output of customized fertilizers for the sub-Saharan African market.
  • In July 2025, ICL Group launched a pilot plant in Europe for synthesizing ammonium phosphate using phosphoric acid recovered from urban wastewater, offering a sustainable alternative to mining.
  • In March 2025, OCP Group announced a significant production capacity expansion at its Jorf Lasfar facility to address growing demand for crop nutrients in sub-Saharan Africa.
  • In February 2025, The Mosaic Co. implemented advanced sensor-based sorting technology at its Florida operations, improving recovery rates of premium-grade concentrate from low-quality ore bodies.

Dive into Technavio’s robust research methodology, blending expert interviews, extensive data synthesis, and validated models for unparalleled Phosphate Rock Market insights. See full methodology.

Market Scope
Page number 298
Base year 2025
Historic period 2020-2024
Forecast period 2026-2030
Growth momentum & CAGR Accelerate at a CAGR of 4.1%
Market growth 2026-2030 USD 5691.9 million
Market structure Fragmented
YoY growth 2025-2026(%) 3.8%
Key countries China, Japan, India, South Korea, Australia, Indonesia, US, Canada, Mexico, Germany, UK, Russia, France, Italy, The Netherlands, Brazil, Argentina, Chile, Saudi Arabia, Israel, UAE, South Africa and Turkey
Competitive landscape Leading Companies, Market Positioning of Companies, Competitive Strategies, and Industry Risks

Request Free Sample

Research Analyst Overview

  • The phosphate rock market is shaped by the need for efficient resource extraction and advanced mineral processing. Key inputs include apatite concentrate and both high-grade and low-grade phosphate ore, which undergo phosphate beneficiation. The ore flotation process is critical for producing phosphate ore concentrate suitable for various applications.
  • Firms are focusing on furnace process phosphoric acid and wet-process phosphoric acid techniques to meet demand for fertilizer grade phosphate, feed grade phosphate, and industrial grade phosphate. A major operational focus is on mitigating heavy metal contaminants in the final product.
  • The implementation of advanced sensor-based sorting has improved recovery of sedimentary phosphate rock by up to 15%, enhancing soil fertility management and bolstering the value chain. This drive for efficiency in phosphorus pentoxide (P2O5) content extraction from igneous phosphate rock and direct application phosphate rock (DAPR) is central to boardroom strategies around both profitability and nutrient recovery technology.

What are the Key Data Covered in this Phosphate Rock Market Research and Growth Report?

  • What is the expected growth of the Phosphate Rock Market between 2026 and 2030?

    • USD 5.69 billion, at a CAGR of 4.1%

  • What segmentation does the market report cover?

    • The report is segmented by Source (Marine phosphate deposits, Igneous phosphate deposits, Metamorphic deposits, Biogenic deposits, and Weathered deposits), Application (Fertilizer, Animal feed supplement, and Others), Grade Type (Fertilizer grade, Feed grade, and Industrial grade) and Geography (APAC, North America, Europe, South America, Middle East and Africa)

  • Which regions are analyzed in the report?

    • APAC, North America, Europe, South America and Middle East and Africa

  • What are the key growth drivers and market challenges?

    • Rising demand for phosphate fertilizers, Health hazards associated with phosphate-based fertilizers

  • Who are the major players in the Phosphate Rock Market?

    • Acron Group, EuroChem Group AG, Foskor Pty Ltd., Guizhou Kailin Holdings Group, Hubei Xingfa Chemicals Group, Indorama Corp., Israel Chemicals Ltd., Itafos Inc., J. R. Simplot Co., Jordan Phosphate Mines Co. PLC, Kazphosphate LLC, Misr Phosphate Co, Nutrien Ltd., OCP Group, PhosAgro Group of Co, Saudi Arabian Mining Co., The Mosaic Co., Wengfu Group Co Ltd, Yara International ASA and Yunnan Phosphate Haikou Co Ltd

Market Research Insights

  • The phosphate rock market's dynamics are influenced by a strategic push toward enhancing nutrient use efficiency and securing the supply chain against geopolitical supply risks. Investments in beneficiation technology advancement are yielding significant returns, with some modernized facilities reporting a 15% increase in recovery of high-grade ore.
  • This focus on optimization extends to the development of specialized crop nutrient solutions that align with precision agriculture inputs. As agricultural productivity enhancement remains a priority, the shift to high-solubility fertilizers has been shown to improve nutrient uptake by over 20% in certain crops.
  • Furthermore, growing interest in alternative phosphorus sources and food security initiatives is compelling established producers to explore waste stream recovery, diversifying their portfolios beyond traditional extraction.

We can help! Our analysts can customize this phosphate rock market research report to meet your requirements.

Get in touch

1. Executive Summary

1.1 Market overview

Executive Summary - Chart on Market Overview
Executive Summary - Data Table on Market Overview
Executive Summary - Chart on Global Market Characteristics
Executive Summary - Chart on Market by Geography
Executive Summary - Chart on Market Segmentation by Source
Executive Summary - Chart on Market Segmentation by Application
Executive Summary - Chart on Market Segmentation by Grade Type
Executive Summary - Chart on Incremental Growth
Executive Summary - Data Table on Incremental Growth
Executive Summary - Chart on Company Market Positioning

2. Technavio Analysis

2.1 Analysis of price sensitivity, lifecycle, customer purchase basket, adoption rates, and purchase criteria

2.2 Criticality of inputs and Factors of differentiation

Chart on Overview on criticality of inputs and factors of differentiation

2.3 Factors of disruption

Chart on Overview on factors of disruption

2.4 Impact of drivers and challenges

Chart on Impact of drivers and challenges in 2025 and 2030

3. Market Landscape

3.1 Market ecosystem

Chart on Parent Market
Data Table on - Parent Market

3.2 Market characteristics

Chart on Market characteristics analysis

3.3 Value chain analysis

Chart on Value chain analysis

4. Market Sizing

4.1 Market definition

Data Table on Offerings of companies included in the market definition

4.2 Market segment analysis

Market segments

4.3 Market size 2025

4.4 Market outlook: Forecast for 2025-2030

Chart on Global - Market size and forecast 2025-2030 ($ million)
Data Table on Global - Market size and forecast 2025-2030 ($ million)
Chart on Global Market: Year-over-year growth 2025-2030 (%)
Data Table on Global Market: Year-over-year growth 2025-2030 (%)

5. Historic Market Size

5.1 Global Phosphate Rock Market 2020 - 2024

Historic Market Size - Data Table on Global Phosphate Rock Market 2020 - 2024 ($ million)

5.2 Source segment analysis 2020 - 2024

Historic Market Size - Source Segment 2020 - 2024 ($ million)

5.3 Application segment analysis 2020 - 2024

Historic Market Size - Application Segment 2020 - 2024 ($ million)

5.4 Grade Type segment analysis 2020 - 2024

Historic Market Size - Grade Type Segment 2020 - 2024 ($ million)

5.5 Geography segment analysis 2020 - 2024

Historic Market Size - Geography Segment 2020 - 2024 ($ million)

5.6 Country segment analysis 2020 - 2024

Historic Market Size - Country Segment 2020 - 2024 ($ million)

6. Qualitative Analysis

6.1 Impact of AI on the Global Phosphate Rock Market

6.2 Impact of Geopolitical Conflicts on Global Phosphate Rock Market

7. Five Forces Analysis

7.1 Five forces summary

Five forces analysis - Comparison between 2025 and 2030

7.2 Bargaining power of buyers

Bargaining power of buyers - Impact of key factors 2025 and 2030

7.3 Bargaining power of suppliers

Bargaining power of suppliers - Impact of key factors in 2025 and 2030

7.4 Threat of new entrants

Threat of new entrants - Impact of key factors in 2025 and 2030

7.5 Threat of substitutes

Threat of substitutes - Impact of key factors in 2025 and 2030

7.6 Threat of rivalry

Threat of rivalry - Impact of key factors in 2025 and 2030

7.7 Market condition

Chart on Market condition - Five forces 2025 and 2030

8. Market Segmentation by Source

8.1 Market segments

Chart on Source - Market share 2025-2030 (%)
Data Table on Source - Market share 2025-2030 (%)

8.2 Comparison by Source

Chart on Comparison by Source
Data Table on Comparison by Source

8.3 Marine phosphate deposits - Market size and forecast 2025-2030

Chart on Marine phosphate deposits - Market size and forecast 2025-2030 ($ million)
Data Table on Marine phosphate deposits - Market size and forecast 2025-2030 ($ million)
Chart on Marine phosphate deposits - Year-over-year growth 2025-2030 (%)
Data Table on Marine phosphate deposits - Year-over-year growth 2025-2030 (%)

8.4 Igneous phosphate deposits - Market size and forecast 2025-2030

Chart on Igneous phosphate deposits - Market size and forecast 2025-2030 ($ million)
Data Table on Igneous phosphate deposits - Market size and forecast 2025-2030 ($ million)
Chart on Igneous phosphate deposits - Year-over-year growth 2025-2030 (%)
Data Table on Igneous phosphate deposits - Year-over-year growth 2025-2030 (%)

8.5 Metamorphic deposits - Market size and forecast 2025-2030

Chart on Metamorphic deposits - Market size and forecast 2025-2030 ($ million)
Data Table on Metamorphic deposits - Market size and forecast 2025-2030 ($ million)
Chart on Metamorphic deposits - Year-over-year growth 2025-2030 (%)
Data Table on Metamorphic deposits - Year-over-year growth 2025-2030 (%)

8.6 Biogenic deposits - Market size and forecast 2025-2030

Chart on Biogenic deposits - Market size and forecast 2025-2030 ($ million)
Data Table on Biogenic deposits - Market size and forecast 2025-2030 ($ million)
Chart on Biogenic deposits - Year-over-year growth 2025-2030 (%)
Data Table on Biogenic deposits - Year-over-year growth 2025-2030 (%)

8.7 Weathered deposits - Market size and forecast 2025-2030

Chart on Weathered deposits - Market size and forecast 2025-2030 ($ million)
Data Table on Weathered deposits - Market size and forecast 2025-2030 ($ million)
Chart on Weathered deposits - Year-over-year growth 2025-2030 (%)
Data Table on Weathered deposits - Year-over-year growth 2025-2030 (%)

8.8 Market opportunity by Source

Market opportunity by Source ($ million)
Data Table on Market opportunity by Source ($ million)

9. Market Segmentation by Application

9.1 Market segments

Chart on Application - Market share 2025-2030 (%)
Data Table on Application - Market share 2025-2030 (%)

9.2 Comparison by Application

Chart on Comparison by Application
Data Table on Comparison by Application

9.3 Fertilizer - Market size and forecast 2025-2030

Chart on Fertilizer - Market size and forecast 2025-2030 ($ million)
Data Table on Fertilizer - Market size and forecast 2025-2030 ($ million)
Chart on Fertilizer - Year-over-year growth 2025-2030 (%)
Data Table on Fertilizer - Year-over-year growth 2025-2030 (%)

9.4 Animal feed supplement - Market size and forecast 2025-2030

Chart on Animal feed supplement - Market size and forecast 2025-2030 ($ million)
Data Table on Animal feed supplement - Market size and forecast 2025-2030 ($ million)
Chart on Animal feed supplement - Year-over-year growth 2025-2030 (%)
Data Table on Animal feed supplement - Year-over-year growth 2025-2030 (%)

9.5 Others - Market size and forecast 2025-2030

Chart on Others - Market size and forecast 2025-2030 ($ million)
Data Table on Others - Market size and forecast 2025-2030 ($ million)
Chart on Others - Year-over-year growth 2025-2030 (%)
Data Table on Others - Year-over-year growth 2025-2030 (%)

9.6 Market opportunity by Application

Market opportunity by Application ($ million)
Data Table on Market opportunity by Application ($ million)

10. Market Segmentation by Grade Type

10.1 Market segments

Chart on Grade Type - Market share 2025-2030 (%)
Data Table on Grade Type - Market share 2025-2030 (%)

10.2 Comparison by Grade Type

Chart on Comparison by Grade Type
Data Table on Comparison by Grade Type

10.3 Fertilizer grade - Market size and forecast 2025-2030

Chart on Fertilizer grade - Market size and forecast 2025-2030 ($ million)
Data Table on Fertilizer grade - Market size and forecast 2025-2030 ($ million)
Chart on Fertilizer grade - Year-over-year growth 2025-2030 (%)
Data Table on Fertilizer grade - Year-over-year growth 2025-2030 (%)

10.4 Feed grade - Market size and forecast 2025-2030

Chart on Feed grade - Market size and forecast 2025-2030 ($ million)
Data Table on Feed grade - Market size and forecast 2025-2030 ($ million)
Chart on Feed grade - Year-over-year growth 2025-2030 (%)
Data Table on Feed grade - Year-over-year growth 2025-2030 (%)

10.5 Industrial grade - Market size and forecast 2025-2030

Chart on Industrial grade - Market size and forecast 2025-2030 ($ million)
Data Table on Industrial grade - Market size and forecast 2025-2030 ($ million)
Chart on Industrial grade - Year-over-year growth 2025-2030 (%)
Data Table on Industrial grade - Year-over-year growth 2025-2030 (%)

10.6 Market opportunity by Grade Type

Market opportunity by Grade Type ($ million)
Data Table on Market opportunity by Grade Type ($ million)

11. Customer Landscape

11.1 Customer landscape overview

Analysis of price sensitivity, lifecycle, customer purchase basket, adoption rates, and purchase criteria

12. Geographic Landscape

12.1 Geographic segmentation

Chart on Market share by geography 2025-2030 (%)
Data Table on Market share by geography 2025-2030 (%)

12.2 Geographic comparison

Chart on Geographic comparison
Data Table on Geographic comparison

12.3 APAC - Market size and forecast 2025-2030

Chart on APAC - Market size and forecast 2025-2030 ($ million)
Data Table on APAC - Market size and forecast 2025-2030 ($ million)
Chart on APAC - Year-over-year growth 2025-2030 (%)
Data Table on APAC - Year-over-year growth 2025-2030 (%)
Chart on Regional Comparison - APAC
Data Table on Regional Comparison - APAC

12.3.1 China - Market size and forecast 2025-2030

Chart on China - Market size and forecast 2025-2030 ($ million)
Data Table on China - Market size and forecast 2025-2030 ($ million)
Chart on China - Year-over-year growth 2025-2030 (%)
Data Table on China - Year-over-year growth 2025-2030 (%)

12.3.2 Japan - Market size and forecast 2025-2030

Chart on Japan - Market size and forecast 2025-2030 ($ million)
Data Table on Japan - Market size and forecast 2025-2030 ($ million)
Chart on Japan - Year-over-year growth 2025-2030 (%)
Data Table on Japan - Year-over-year growth 2025-2030 (%)

12.3.3 India - Market size and forecast 2025-2030

Chart on India - Market size and forecast 2025-2030 ($ million)
Data Table on India - Market size and forecast 2025-2030 ($ million)
Chart on India - Year-over-year growth 2025-2030 (%)
Data Table on India - Year-over-year growth 2025-2030 (%)

12.3.4 South Korea - Market size and forecast 2025-2030

Chart on South Korea - Market size and forecast 2025-2030 ($ million)
Data Table on South Korea - Market size and forecast 2025-2030 ($ million)
Chart on South Korea - Year-over-year growth 2025-2030 (%)
Data Table on South Korea - Year-over-year growth 2025-2030 (%)

12.3.5 Australia - Market size and forecast 2025-2030

Chart on Australia - Market size and forecast 2025-2030 ($ million)
Data Table on Australia - Market size and forecast 2025-2030 ($ million)
Chart on Australia - Year-over-year growth 2025-2030 (%)
Data Table on Australia - Year-over-year growth 2025-2030 (%)

12.3.6 Indonesia - Market size and forecast 2025-2030

Chart on Indonesia - Market size and forecast 2025-2030 ($ million)
Data Table on Indonesia - Market size and forecast 2025-2030 ($ million)
Chart on Indonesia - Year-over-year growth 2025-2030 (%)
Data Table on Indonesia - Year-over-year growth 2025-2030 (%)

12.4 North America - Market size and forecast 2025-2030

Chart on North America - Market size and forecast 2025-2030 ($ million)
Data Table on North America - Market size and forecast 2025-2030 ($ million)
Chart on North America - Year-over-year growth 2025-2030 (%)
Data Table on North America - Year-over-year growth 2025-2030 (%)
Chart on Regional Comparison - North America
Data Table on Regional Comparison - North America

12.4.1 US - Market size and forecast 2025-2030

Chart on US - Market size and forecast 2025-2030 ($ million)
Data Table on US - Market size and forecast 2025-2030 ($ million)
Chart on US - Year-over-year growth 2025-2030 (%)
Data Table on US - Year-over-year growth 2025-2030 (%)

12.4.2 Canada - Market size and forecast 2025-2030

Chart on Canada - Market size and forecast 2025-2030 ($ million)
Data Table on Canada - Market size and forecast 2025-2030 ($ million)
Chart on Canada - Year-over-year growth 2025-2030 (%)
Data Table on Canada - Year-over-year growth 2025-2030 (%)

12.4.3 Mexico - Market size and forecast 2025-2030

Chart on Mexico - Market size and forecast 2025-2030 ($ million)
Data Table on Mexico - Market size and forecast 2025-2030 ($ million)
Chart on Mexico - Year-over-year growth 2025-2030 (%)
Data Table on Mexico - Year-over-year growth 2025-2030 (%)

12.5 Europe - Market size and forecast 2025-2030

Chart on Europe - Market size and forecast 2025-2030 ($ million)
Data Table on Europe - Market size and forecast 2025-2030 ($ million)
Chart on Europe - Year-over-year growth 2025-2030 (%)
Data Table on Europe - Year-over-year growth 2025-2030 (%)
Chart on Regional Comparison - Europe
Data Table on Regional Comparison - Europe

12.5.1 Germany - Market size and forecast 2025-2030

Chart on Germany - Market size and forecast 2025-2030 ($ million)
Data Table on Germany - Market size and forecast 2025-2030 ($ million)
Chart on Germany - Year-over-year growth 2025-2030 (%)
Data Table on Germany - Year-over-year growth 2025-2030 (%)

12.5.2 UK - Market size and forecast 2025-2030

Chart on UK - Market size and forecast 2025-2030 ($ million)
Data Table on UK - Market size and forecast 2025-2030 ($ million)
Chart on UK - Year-over-year growth 2025-2030 (%)
Data Table on UK - Year-over-year growth 2025-2030 (%)

12.5.3 Russia - Market size and forecast 2025-2030

Chart on Russia - Market size and forecast 2025-2030 ($ million)
Data Table on Russia - Market size and forecast 2025-2030 ($ million)
Chart on Russia - Year-over-year growth 2025-2030 (%)
Data Table on Russia - Year-over-year growth 2025-2030 (%)

12.5.4 France - Market size and forecast 2025-2030

Chart on France - Market size and forecast 2025-2030 ($ million)
Data Table on France - Market size and forecast 2025-2030 ($ million)
Chart on France - Year-over-year growth 2025-2030 (%)
Data Table on France - Year-over-year growth 2025-2030 (%)

12.5.5 Italy - Market size and forecast 2025-2030

Chart on Italy - Market size and forecast 2025-2030 ($ million)
Data Table on Italy - Market size and forecast 2025-2030 ($ million)
Chart on Italy - Year-over-year growth 2025-2030 (%)
Data Table on Italy - Year-over-year growth 2025-2030 (%)

12.5.6 The Netherlands - Market size and forecast 2025-2030

Chart on The Netherlands - Market size and forecast 2025-2030 ($ million)
Data Table on The Netherlands - Market size and forecast 2025-2030 ($ million)
Chart on The Netherlands - Year-over-year growth 2025-2030 (%)
Data Table on The Netherlands - Year-over-year growth 2025-2030 (%)

12.6 South America - Market size and forecast 2025-2030

Chart on South America - Market size and forecast 2025-2030 ($ million)
Data Table on South America - Market size and forecast 2025-2030 ($ million)
Chart on South America - Year-over-year growth 2025-2030 (%)
Data Table on South America - Year-over-year growth 2025-2030 (%)
Chart on Regional Comparison - South America
Data Table on Regional Comparison - South America

12.6.1 Brazil - Market size and forecast 2025-2030

Chart on Brazil - Market size and forecast 2025-2030 ($ million)
Data Table on Brazil - Market size and forecast 2025-2030 ($ million)
Chart on Brazil - Year-over-year growth 2025-2030 (%)
Data Table on Brazil - Year-over-year growth 2025-2030 (%)

12.6.2 Argentina - Market size and forecast 2025-2030

Chart on Argentina - Market size and forecast 2025-2030 ($ million)
Data Table on Argentina - Market size and forecast 2025-2030 ($ million)
Chart on Argentina - Year-over-year growth 2025-2030 (%)
Data Table on Argentina - Year-over-year growth 2025-2030 (%)

12.6.3 Chile - Market size and forecast 2025-2030

Chart on Chile - Market size and forecast 2025-2030 ($ million)
Data Table on Chile - Market size and forecast 2025-2030 ($ million)
Chart on Chile - Year-over-year growth 2025-2030 (%)
Data Table on Chile - Year-over-year growth 2025-2030 (%)

12.7 Middle East and Africa - Market size and forecast 2025-2030

Chart on Middle East and Africa - Market size and forecast 2025-2030 ($ million)
Data Table on Middle East and Africa - Market size and forecast 2025-2030 ($ million)
Chart on Middle East and Africa - Year-over-year growth 2025-2030 (%)
Data Table on Middle East and Africa - Year-over-year growth 2025-2030 (%)
Chart on Regional Comparison - Middle East and Africa
Data Table on Regional Comparison - Middle East and Africa

12.7.1 Saudi Arabia - Market size and forecast 2025-2030

Chart on Saudi Arabia - Market size and forecast 2025-2030 ($ million)
Data Table on Saudi Arabia - Market size and forecast 2025-2030 ($ million)
Chart on Saudi Arabia - Year-over-year growth 2025-2030 (%)
Data Table on Saudi Arabia - Year-over-year growth 2025-2030 (%)

12.7.2 Israel - Market size and forecast 2025-2030

Chart on Israel - Market size and forecast 2025-2030 ($ million)
Data Table on Israel - Market size and forecast 2025-2030 ($ million)
Chart on Israel - Year-over-year growth 2025-2030 (%)
Data Table on Israel - Year-over-year growth 2025-2030 (%)

12.7.3 UAE - Market size and forecast 2025-2030

Chart on UAE - Market size and forecast 2025-2030 ($ million)
Data Table on UAE - Market size and forecast 2025-2030 ($ million)
Chart on UAE - Year-over-year growth 2025-2030 (%)
Data Table on UAE - Year-over-year growth 2025-2030 (%)

12.7.4 South Africa - Market size and forecast 2025-2030

Chart on South Africa - Market size and forecast 2025-2030 ($ million)
Data Table on South Africa - Market size and forecast 2025-2030 ($ million)
Chart on South Africa - Year-over-year growth 2025-2030 (%)
Data Table on South Africa - Year-over-year growth 2025-2030 (%)

12.7.5 Turkey - Market size and forecast 2025-2030

Chart on Turkey - Market size and forecast 2025-2030 ($ million)
Data Table on Turkey - Market size and forecast 2025-2030 ($ million)
Chart on Turkey - Year-over-year growth 2025-2030 (%)
Data Table on Turkey - Year-over-year growth 2025-2030 (%)

12.8 Market opportunity by geography

Market opportunity by geography ($ million)
Data Tables on Market opportunity by geography ($ million)

13. Drivers, Challenges, and Opportunity

13.1 Market drivers

Rising demand for phosphate fertilizers
Surge in demand for phosphate rock in fertilizer industry
Growing demand for phosphate rock in food and beverage sector

13.2 Market challenges

Health hazards associated with phosphate-based fertilizers
Availability of substitutes for phosphate in animal feed industry
Supply chain disruptions and cost pressures

13.3 Impact of drivers and challenges

Impact of drivers and challenges in 2025 and 2030

13.4 Market opportunities

Production of ammonium phosphate using green phosphoric acid
Increasing population is increasing market demand
Rising demand for water treatment chemicals

14. Competitive Landscape

14.1 Overview

14.2

Overview on criticality of inputs and factors of differentiation

14.3 Landscape disruption

Overview on factors of disruption

14.4 Industry risks

Impact of key risks on business

15. Competitive Analysis

15.1 Companies profiled

Companies covered

15.2 Company ranking index

15.3 Market positioning of companies

Matrix on companies position and classification

15.4 Acron Group

Acron Group - Overview
Acron Group - Business segments
Acron Group - Key offerings
Acron Group - Segment focus
SWOT

15.5 EuroChem Group AG

EuroChem Group AG - Overview
EuroChem Group AG - Product / Service
EuroChem Group AG - Key offerings
SWOT

15.6 Foskor Pty Ltd.

Foskor Pty Ltd. - Overview
Foskor Pty Ltd. - Product / Service
Foskor Pty Ltd. - Key offerings
SWOT

15.7 Guizhou Kailin Holdings Group

Guizhou Kailin Holdings Group - Overview
Guizhou Kailin Holdings Group - Product / Service
Guizhou Kailin Holdings Group - Key offerings
SWOT

15.8 Hubei Xingfa Chemicals Group

Hubei Xingfa Chemicals Group - Overview
Hubei Xingfa Chemicals Group - Product / Service
Hubei Xingfa Chemicals Group - Key offerings
SWOT

15.9 Indorama Corp.

Indorama Corp. - Overview
Indorama Corp. - Product / Service
Indorama Corp. - Key offerings
SWOT

15.10 J. R. Simplot Co.

J. R. Simplot Co. - Overview
J. R. Simplot Co. - Product / Service
J. R. Simplot Co. - Key offerings
SWOT

15.11 Jordan Phosphate Mines Co. PLC

Jordan Phosphate Mines Co. PLC - Overview
Jordan Phosphate Mines Co. PLC - Business segments
Jordan Phosphate Mines Co. PLC - Key offerings
Jordan Phosphate Mines Co. PLC - Segment focus
SWOT

15.12 Misr Phosphate Co

Misr Phosphate Co - Overview
Misr Phosphate Co - Product / Service
Misr Phosphate Co - Key offerings
SWOT

15.13 OCP Group

OCP Group - Overview
OCP Group - Product / Service
OCP Group - Key offerings
SWOT

15.14 PhosAgro Group of Co

PhosAgro Group of Co - Overview
PhosAgro Group of Co - Product / Service
PhosAgro Group of Co - Key offerings
SWOT

15.15 Saudi Arabian Mining Co.

Saudi Arabian Mining Co. - Overview
Saudi Arabian Mining Co. - Business segments
Saudi Arabian Mining Co. - Key offerings
Saudi Arabian Mining Co. - Segment focus
SWOT

15.16 The Mosaic Co.

The Mosaic Co. - Overview
The Mosaic Co. - Business segments
The Mosaic Co. - Key offerings
The Mosaic Co. - Segment focus
SWOT

15.17 Wengfu Group Co Ltd

Wengfu Group Co Ltd - Overview
Wengfu Group Co Ltd - Product / Service
Wengfu Group Co Ltd - Key offerings
SWOT

15.18 Yara International ASA

Yara International ASA - Overview
Yara International ASA - Business segments
Yara International ASA - Key offerings
Yara International ASA - Segment focus
SWOT

16. Appendix

16.1 Scope of the report

Market definition
Objectives
Notes and caveats

16.2 Inclusions and exclusions checklist

Inclusions checklist
Exclusions checklist

16.3 Currency conversion rates for US$

16.4 Research methodology

16.5 Data procurement

Information sources

16.6 Data validation

16.7 Validation techniques employed for market sizing

16.8 Data synthesis

16.9 360 degree market analysis

16.10 List of abbreviations

Research Methodology

Technavio presents a detailed picture of the market by way of study, synthesis, and summation of data from multiple sources. The analysts have presented the various facets of the market with a particular focus on identifying the key industry influencers. The data thus presented is comprehensive, reliable, and the result of extensive research, both primary and secondary.

INFORMATION SOURCES

Primary sources

  • Manufacturers and suppliers
  • Channel partners
  • Industry experts
  • Strategic decision makers

Secondary sources

  • Industry journals and periodicals
  • Government data
  • Financial reports of key industry players
  • Historical data
  • Press releases

DATA ANALYSIS

Data Synthesis

  • Collation of data
  • Estimation of key figures
  • Analysis of derived insights

Data Validation

  • Triangulation with data models
  • Reference against proprietary databases
  • Corroboration with industry experts

REPORT WRITING

Qualitative

  • Market drivers
  • Market challenges
  • Market trends
  • Five forces analysis

Quantitative

  • Market size and forecast
  • Market segmentation
  • Geographical insights
  • Competitive landscape

Interested in this report?

Get your sample now to see our research methodology and insights!

Download Now

Frequently Asked Questions

Phosphate Rock market growth will increase by USD 5691.9 million during 2026-2030.

The Phosphate Rock market is expected to grow at a CAGR of 4.1% during 2026-2030.

Phosphate Rock market is segmented by Source (Marine phosphate deposits, Igneous phosphate deposits, Metamorphic deposits, Biogenic deposits, Weathered deposits) Application (Fertilizer, Animal feed supplement, Others) Grade type (Fertilizer grade, Feed grade, Industrial grade)

Acron Group, EuroChem Group AG, Foskor Pty Ltd., Guizhou Kailin Holdings Group, Hubei Xingfa Chemicals Group, Indorama Corp., Israel Chemicals Ltd., Itafos Inc., J. R. Simplot Co., Jordan Phosphate Mines Co. PLC, Kazphosphate LLC, Misr Phosphate Co, Nutrien Ltd., OCP Group, PhosAgro Group of Co, Saudi Arabian Mining Co., The Mosaic Co., Wengfu Group Co Ltd, Yara International ASA, Yunnan Phosphate Haikou Co Ltd are a few of the key vendors in the Phosphate Rock market.

APAC will register the highest growth rate of 47.7% among the other regions. Therefore, the Phosphate Rock market in APAC is expected to garner significant business opportunities for the vendors during the forecast period.

China, Japan, India, South Korea, Australia, Indonesia, US, Canada, Mexico, Germany, UK, Russia, France, Italy, The Netherlands, Brazil, Argentina, Chile, Saudi Arabia, Israel, UAE, South Africa, Turkey

  • Rising demand for phosphate fertilizers is the driving factor this market.

The Phosphate Rock market vendors should focus on grabbing business opportunities from the Source segment as it accounted for the largest market share in the base year.
RIA - Research AI Assistant
Ask RIA