Polybutylene Terephthalate Market Size 2024-2028
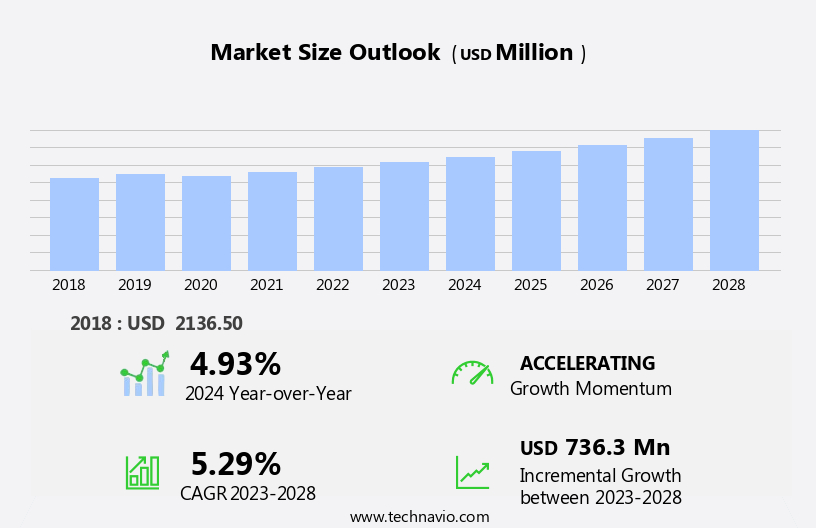
The polybutylene terephthalate market size is forecast to increase by USD 736.3 million, at a CAGR of 5.29% between 2023 and 2028.
- The Polybutylene Terephthalate (PBT) market witnesses significant growth, driven by the increasing demand in the automotive industry. This sector's continuous expansion is fueled by the material's superior properties, including high durability, excellent electrical insulation, and resistance to heat and chemicals. Moreover, market participants are expanding their production capacities to cater to the escalating demand. However, the market's landscape is not without challenges. The volatility of crude oil prices poses a significant threat to the market's stability.
- As a petrochemical derivative, PBT production relies heavily on crude oil prices, making it susceptible to price fluctuations. Therefore, market players must closely monitor and adapt to these price shifts to maintain profitability and competitiveness. The market is witnessing fluctuations in crude oil prices, leading to the shift towards the use of PBT as a cost-effective alternative to steel and other traditional materials in various applications, including medical devices, LED lighting, and injection molding for consumer electronics.
What will be the Size of the Polybutylene Terephthalate Market during the forecast period?

Explore in-depth regional segment analysis with market size data - historical 2018-2022 and forecasts 2024-2028 - in the full report.
Request Free Sample
Polybutylene terephthalate (PBT), a high-performance thermoplastic polyester, continues to gain traction in various sectors due to its unique properties. The evolving market dynamics of PBT are shaped by its versatile applications, which range from electrical insulation and automotive components to textiles and consumer products. PBT's demand is driven by its exceptional impact strength and dielectric strength, making it a preferred choice for electrical components and industrial equipment. Its Vicat softening point ensures dimensional stability during processing, enabling efficient manufacturing through techniques such as extrusion molding and injection molding. The PBT market size is expanding as new applications emerge, including biodegradable PBT in textiles and surface resistivity applications in electronic components.
The ongoing research and development in PBT manufacturing processes, such as chemical recycling and the creation of PBT alloys, further fuel market growth. PBT's heat resistance and mechanical strength make it an ideal material for automotive components, while its moisture resistance and wear resistance contribute to its popularity in industrial equipment and engineering plastics. The continuous unfolding of market activities includes the development of flame retardant PBT and the integration of ROHS compliance for environmental sustainability. As PBT's role in various industries continues to evolve, so do the challenges and opportunities within the PBT supply chain. Processing aids, such as mineral filled PBT and mold release agents, play a crucial role in optimizing production efficiency and ensuring consistent product quality.
The ongoing pursuit of high-performance polymers and the integration of PBT recycling further underscore the dynamic nature of the PBT market.
How is this Polybutylene Terephthalate Industry segmented?
The polybutylene terephthalate industry research report provides comprehensive data (region-wise segment analysis), with forecasts and estimates in "USD million" for the period 2024-2028, as well as historical data from 2018-2022 for the following segments.
- Application
- Electrical and electronics
- Automotive
- Household appliances
- Extrusion products
- Type
- Industrial grade
- Commercial grade
- Form
- Manufacturing Process
- Polymerization
- Compounding
- Geography
- North America
- Europe
- Middle East and Africa
- APAC
- South America
- Rest of World (ROW)
By Application Insights
The electrical and electronics segment is estimated to witness significant growth during the forecast period.
Polybutylene terephthalate (PBT), a thermoplastic engineering polymer, plays a significant role in various electrical and electronic applications. Devices such as data communications equipment, cameras, millimeter-wave radars, and Light Detection and Ranging (LiDAR) systems utilize PBT for sealing, encapsulating, and insulating microelectronic components and printed circuit boards. Its excellent insulation properties protect electronics from damage. PBT offers resistance to solvents, water, and high temperatures, making it an ideal choice for such applications. The selection of PBT is driven by its desirable properties, including high abrasion resistance, good electrical and adhesion properties, impact strength, and low-temperature flexibility. Major companies, including Toray and LG Chem, provide PBT for diverse electronic devices.
PBT blends are used to enhance the material's properties, such as water absorption and flammability rating. Mineral-filled PBT and recycled PBT are gaining popularity due to their eco-friendly nature and cost-effectiveness. Processing aids like mold release agents and lubricants facilitate the manufacturing process. PBT composites, with their improved mechanical strength and dimensional stability, are widely used in engineering plastics. High-performance polymers and alloys are also available, offering superior heat resistance and wear resistance. PBT's chemical resistance and melt flow rate make it suitable for various industrial applications, including packaging, automotive components, and electrical components. Its UL rating and ROHS compliance ensure regulatory compliance.
PBT's market size is growing due to the increasing demand for advanced electronic devices and the need for reliable insulation materials. The recycling of PBT through chemical and mechanical methods is also gaining traction, contributing to its sustainability and cost-effectiveness. In summary, PBT's versatility, excellent insulation properties, and resistance to various environmental conditions make it a preferred choice for numerous electrical and electronic applications. Its various forms, including blends, composites, and recycled PBT, cater to diverse industry requirements.

Request Free Sample
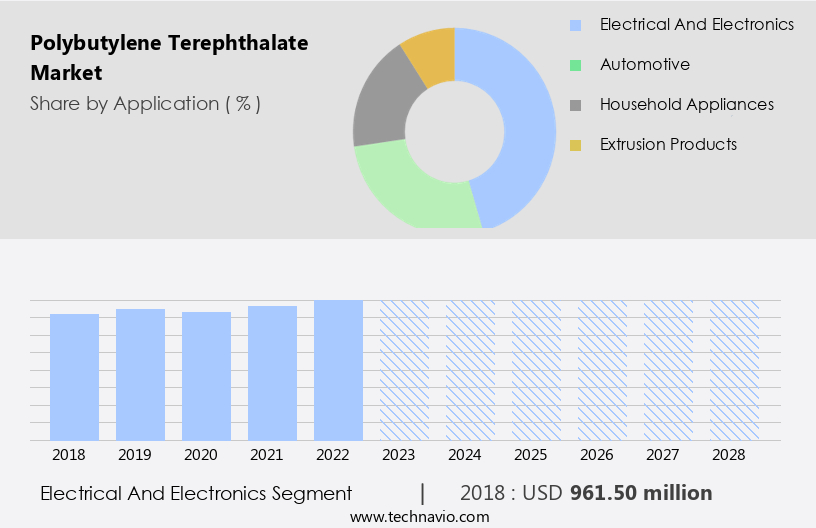
The Electrical and electronics segment was valued at USD 961.50 million in 2018 and showed a gradual increase during the forecast period.
Regional Analysis
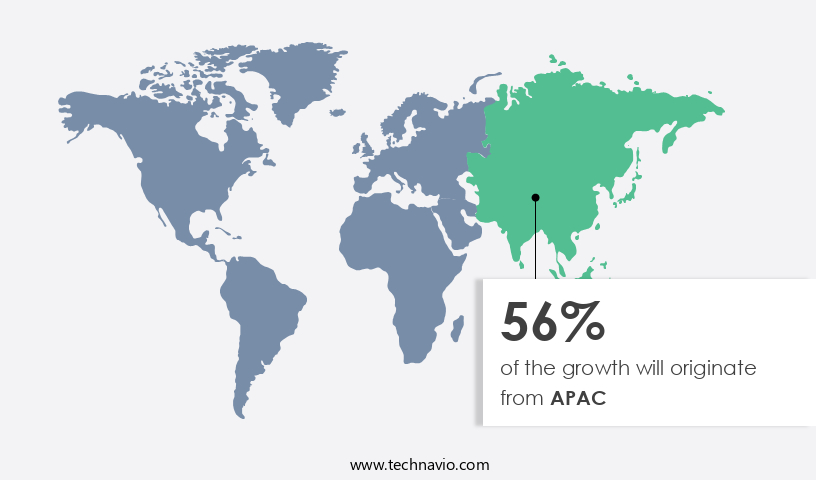
APAC is estimated to contribute 56% to the growth of the global market during the forecast period.Technavio's analysts have elaborately explained the regional trends and drivers that shape the market during the forecast period.

Request Free Sample
The polybutylene terephthalate (PBT) market in Asia Pacific (APAC) is witnessing significant growth due to the flourishing end-user industries, including automotive, construction, medical devices, and electronics. The automotive industry in APAC is experiencing growth, driven by the high demand for automobiles in countries like China, India, Indonesia, Thailand, and Vietnam. China, Japan, and India are the major contributors to this demand. PBT is extensively used in manufacturing automotive electronics due to its excellent electrical insulation properties and high impact strength. In the construction sector, PBT's dimensional stability, heat resistance, and chemical resistance make it an ideal choice for manufacturing pipes and fittings.
In the medical devices industry, PBT's biocompatibility and excellent mechanical strength make it suitable for manufacturing medical components. In the electronics industry, PBT's high dielectric strength, low moisture absorption, and excellent surface resistivity make it an ideal choice for manufacturing electrical components. The market for PBT is expected to grow further due to the increasing demand for recycled PBT, fiber-reinforced PBT, and high-performance PBT alloys. The PBT market size is anticipated to expand significantly due to the increasing demand for these advanced PBT materials. Additionally, the market is witnessing the adoption of chemical recycling and mechanical recycling techniques to produce recycled PBT, further increasing its demand.
Overall, the PBT market in APAC is expected to grow significantly due to the increasing demand from end-user industries and the development of advanced PBT materials.
Market Dynamics
Our researchers analyzed the data with 2023 as the base year, along with the key drivers, trends, and challenges. A holistic analysis of drivers will help companies refine their marketing strategies to gain a competitive advantage.
What are the key market drivers leading to the rise in the adoption of Polybutylene Terephthalate Industry?
- The automotive industry's growing requirement for polybutylene terephthalate (PBT) is the primary market driver, attributable to its extensive usage in manufacturing automotive components due to its superior thermal stability, electrical insulation properties, and resistance to chemicals and moisture.
- Polybutylene Terephthalate (PBT) is a high-performance thermoplastic material widely used in various industries due to its superior thermal, chemical, and weather resistance, as well as excellent electrical characteristics. In the automotive sector, PBT is a preferred choice for manufacturing automotive electronics, millimeter-wave radar, communication modules, and high-speed transmission-type connectors. Several key companies provide PBT blends for the automotive industry, ensuring compliance with necessary regulations. Processing aids, such as mineral filled PBT and mold release agents, are often used to enhance the material's properties. For instance, mineral-filled PBT improves its dimensional stability and heat resistance, while mold release agents facilitate the separation of the molded part from the tooling.
- PBT composites and recycled PBT are also gaining popularity due to their cost-effectiveness and eco-friendliness. These materials maintain the original properties of PBT while reducing the environmental impact. The Ul rating and flammability rating of PBT make it an ideal choice for electrical insulation applications. Injection molding is the most common processing method for manufacturing PBT components due to its ability to produce complex shapes with high precision and consistency. Price trends for PBT have been stable in recent years, with occasional fluctuations depending on market conditions and supply chain dynamics. Despite these fluctuations, the demand for PBT remains strong due to its versatility and excellent performance characteristics.
What are the market trends shaping the Polybutylene Terephthalate Industry?
- Market companies are increasingly expanding their capacity to meet growing demand, representing a significant trend in the market. This capacity expansion is a mandatory response to the increasing consumer needs and market growth.
- The global Polybutylene Terephthalate (PBT) market is experiencing significant growth due to increasing demand from industries such as automotive and electrical and electronics. To maintain their market position, key companies are expanding production capacity and entering into joint ventures. For instance, in November 2022, Lanxess announced plans to build a second line for its Durethan- and Pocan-branded PBT at its Changzhou, China manufacturing site. Similarly, in February 2022, BASF (Malaysia) announced a 5,000 metric ton per year expansion of its Ultramid polyamide and Ultradur PBT production capacity. PBT is a thermoplastic polyester known for its excellent properties, including high impact strength, dielectric strength, and Vicat softening point.
- Its dimensional stability and heat resistance make it suitable for various applications, such as extrusion molding. In addition, recent developments in biodegradable PBT have expanded its applications in textiles. PBT's surface resistivity and Izod impact test results further highlight its desirable properties for various industries. Its heat resistance and high processing temperature make it an ideal material for automotive applications, while its dimensional stability and electrical insulation properties make it suitable for electrical and electronics applications. The PBT market size is expected to grow significantly due to these factors. Despite the challenges posed by the global economic situation, the market is expected to remain strong, driven by the increasing demand for PBT in various industries.
What challenges does the Polybutylene Terephthalate Industry face during its growth?
- The volatility of crude oil prices poses a significant challenge to the growth of the industry.
- Polybutylene terephthalate (PBT), a high-performance thermoplastic polymer, is manufactured through the polycondensation of terephthalic acid or dimethyl terephthalate with 1,4-butanediol using specific catalysts. The production of PBT relies on raw materials derived from crude oil and natural gas. The global market for PBT has experienced growth due to its superior properties, including chemical resistance, high tensile and flexural strength, and melt flow rate. These characteristics make it suitable for various applications, particularly in engineering plastics, electrical components, fiber reinforced PBT, and industrial equipment. However, the increasing price of crude oil has led to higher costs for thermoplastic polymers, compelling end-user industries to explore eco-friendly alternatives.
- This trend has affected the growth of the PBT market, as industries shift towards more cost-effective solutions. Moreover, advancements in chemical recycling and the development of polymer additives have expanded the applications of PBT, enabling it to meet ROHS compliance and other industry standards. These factors will influence the market dynamics during the forecast period, making it essential for businesses to stay informed about the latest developments in the PBT industry.
Exclusive Customer Landscape
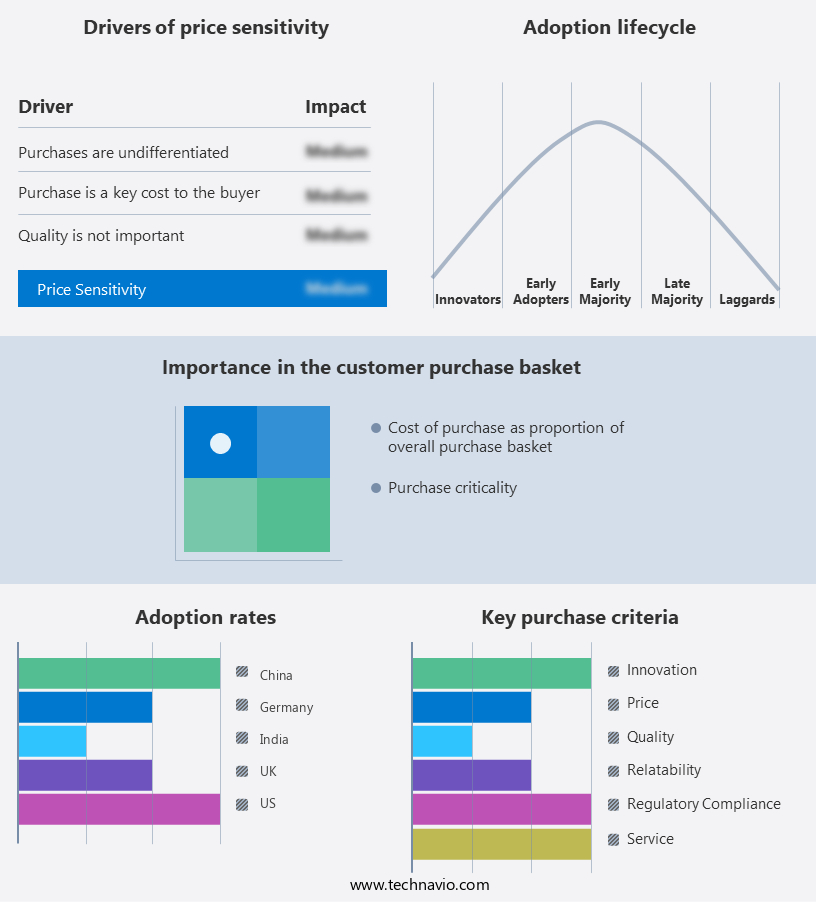
The polybutylene terephthalate market forecasting report includes the adoption lifecycle of the market, covering from the innovator's stage to the laggard's stage. It focuses on adoption rates in different regions based on penetration. Furthermore, the polybutylene terephthalate market report also includes key purchase criteria and drivers of price sensitivity to help companies evaluate and develop their market growth analysis strategies.

Customer Landscape
Key Companies & Market Insights
Companies are implementing various strategies, such as strategic alliances, polybutylene terephthalate market forecast, partnerships, mergers and acquisitions, geographical expansion, and product/service launches, to enhance their presence in the industry.
The industry research and growth report includes detailed analyses of the competitive landscape of the market and information about key companies, including:
- Aady Polymers
- Arkema SA
- BASF SE
- Celanese Corporation
- Chang Chun Group
- China National BlueStar (Group) Co., Ltd.
- Covestro AG
- DAK Americas
- DuPont de Nemours Inc.
- Ester Industries Ltd.
- Evonik Industries AG
- Far Eastern New Century Corporation
- Formosa Plastics Corporation
- Indorama Ventures Public Company Limited
- JBF Industries
- Lanxess AG
- Mitsubishi Chemical Group
- Polyplastics Co. Ltd.
- Reliance Industries Limited
- SABIC
- Toray Industries Inc.
Qualitative and quantitative analysis of companies has been conducted to help clients understand the wider business environment as well as the strengths and weaknesses of key industry players. Data is qualitatively analyzed to categorize companies as pure play, category-focused, industry-focused, and diversified; it is quantitatively analyzed to categorize companies as dominant, leading, strong, tentative, and weak.
Recent Development and News in Polybutylene Terephthalate Market
- In February 2023, BASF, a leading chemical producer, announced the expansion of its global polybutylene terephthalate (PBT) production capacity by 30,000 metric tons per year at its site in Ludwigshafen, Germany. This expansion aims to meet the growing demand for PBT in various industries, including automotive, electrical and electronics, and renewable energy (BASF press release, 2023).
- In April 2024, Covestro, another major player in the PBT market, entered into a strategic collaboration with SABIC, a leading petrochemicals manufacturer, to develop and produce innovative PBT solutions for the automotive industry. This partnership is expected to leverage Covestro's expertise in PBT technology and SABIC's global reach, enhancing their market presence and offering customers more value-added solutions (Covestro press release, 2024).
- In July 2024, LG Chem, a leading global chemical company, secured a significant investment of USD1.3 billion from the South Korean government to expand its PBT production capacity by 50,000 metric tons per year. This investment is part of the South Korean government's Green New Deal initiative to support the growth of the domestic chemical industry and reduce carbon emissions (Reuters, 2024).
- In October 2024, DuPont, a prominent player in the PBT market, showcased its new PBT grade, called Rynite XP, at the K 2022 trade fair. This advanced PBT material offers enhanced thermal stability, improved mechanical properties, and reduced emissions, making it suitable for various high-performance applications, particularly in the automotive and electrical and electronics industries (DuPont press release, 2025).
Research Analyst Overview
- In the dynamic plastics industry, Polybutylene Terephthalate (PBT) continues to hold a significant position among engineering thermoplastics. This material science innovation, a type of thermoset polymer, offers desirable properties such as high heat resistance, excellent electrical insulation, and good processability. Polymer blending, a key trend in material science, has led to the development of new PBT variants with enhanced performance. Quality control remains a top priority, with rigorous material testing and polymer characterization ensuring consistent product quality. Bio-based plastics and polymer modification are driving innovation, as companies explore sustainable alternatives to traditional PBT. The medical device industry and electronics sector are major consumers, with nanotechnology in polymers playing a crucial role in enhancing functionality.
- Meanwhile, the plastics industry grapples with the circular economy, pushing for additive manufacturing and polymer nanocomposites to reduce waste. Engineering thermoplastics like Polycarbonate (PC), Polyvinyl Chloride (PVC), Polyester Resin, Polyamide (PA), Polyethylene (PE), and Polypropylene (PP) all face similar challenges and opportunities. Polymer research continues to advance, with a focus on green technology and sustainability in plastics. Polymer development, driven by the engineering and manufacturing sectors, is a critical area of investment. As the industry evolves, the role of polymer composites and 3D printing in creating innovative solutions becomes increasingly apparent.
Dive into Technavio's robust research methodology, blending expert interviews, extensive data synthesis, and validated models for unparalleled Polybutylene Terephthalate Market insights. See full methodology.
|
Market Scope
|
|
Report Coverage
|
Details
|
|
Page number
|
184
|
|
Base year
|
2023
|
|
Historic period
|
2018-2022 |
|
Forecast period
|
2024-2028
|
|
Growth momentum & CAGR
|
Accelerate at a CAGR of 5.29%
|
|
Market growth 2024-2028
|
USD 736.3 million
|
|
Market structure
|
Fragmented
|
|
YoY growth 2023-2024(%)
|
4.93
|
|
Key countries
|
China, US, Germany, India, and UK
|
|
Competitive landscape
|
Leading Companies, Market Positioning of Companies, Competitive Strategies, and Industry Risks
|
Request Free Sample
What are the Key Data Covered in this Polybutylene Terephthalate Market Research and Growth Report?
- CAGR of the Polybutylene Terephthalate industry during the forecast period
- Detailed information on factors that will drive the growth and forecasting between 2024 and 2028
- Precise estimation of the size of the market and its contribution of the industry in focus to the parent market
- Accurate predictions about upcoming growth and trends and changes in consumer behaviour
- Growth of the market across APAC, Europe, North America, South America, and Middle East and Africa
- Thorough analysis of the market's competitive landscape and detailed information about companies
- Comprehensive analysis of factors that will challenge the polybutylene terephthalate market growth of industry companies
We can help! Our analysts can customize this polybutylene terephthalate market research report to meet your requirements.
Get in touch
1 Executive Summary
- 1.1 Market overview
- Executive Summary - Chart on Market Overview
- Executive Summary - Data Table on Market Overview
- Executive Summary - Chart on Global Market Characteristics
- Executive Summary - Chart on Market by Geography
- Executive Summary - Chart on Market Segmentation by Application
- Executive Summary - Chart on Market Segmentation by Type
- Executive Summary - Chart on Incremental Growth
- Executive Summary - Data Table on Incremental Growth
- Executive Summary - Chart on Company Market Positioning
2 Market Landscape
- 2.1 Market ecosystem
- Parent Market
- Data Table on - Parent Market
- 2.2 Market characteristics
- Market characteristics analysis
3 Market Sizing
- 3.1 Market definition
- Offerings of companies included in the market definition
- 3.2 Market segment analysis
- 3.4 Market outlook: Forecast for 2023-2028
- Chart on Global - Market size and forecast 2023-2028 ($ million)
- Data Table on Global - Market size and forecast 2023-2028 ($ million)
- Chart on Global Market: Year-over-year growth 2023-2028 (%)
- Data Table on Global Market: Year-over-year growth 2023-2028 (%)
4 Historic Market Size
- 4.1 Global Polybutylene Terephthalate Market 2018 - 2022
- Historic Market Size - Data Table on Global Polybutylene Terephthalate Market 2018 - 2022 ($ million)
- 4.2 Application segment analysis 2018 - 2022
- Historic Market Size - Application Segment 2018 - 2022 ($ million)
- 4.3 Type segment analysis 2018 - 2022
- Historic Market Size - Type Segment 2018 - 2022 ($ million)
- 4.4 Geography segment analysis 2018 - 2022
- Historic Market Size - Geography Segment 2018 - 2022 ($ million)
- 4.5 Country segment analysis 2018 - 2022
- Historic Market Size - Country Segment 2018 - 2022 ($ million)
5 Five Forces Analysis
- 5.1 Five forces summary
- Five forces analysis - Comparison between 2023 and 2028
- 5.2 Bargaining power of buyers
- Bargaining power of buyers - Impact of key factors 2023 and 2028
- 5.3 Bargaining power of suppliers
- Bargaining power of suppliers - Impact of key factors in 2023 and 2028
- 5.4 Threat of new entrants
- Threat of new entrants - Impact of key factors in 2023 and 2028
- 5.5 Threat of substitutes
- Threat of substitutes - Impact of key factors in 2023 and 2028
- 5.6 Threat of rivalry
- Threat of rivalry - Impact of key factors in 2023 and 2028
- 5.7 Market condition
- Chart on Market condition - Five forces 2023 and 2028
6 Market Segmentation by Application
- 6.1 Market segments
- Chart on Application - Market share (2023-2028) (%)
- Data Table on Application - Market share (2023-2028) (%)
- 6.2 Comparison by Application
- Chart on Comparison by Application
- Data Table on Comparison by Application
- 6.3 Electrical and electronics - Market size and forecast (2023-2028)
- Chart on Electrical and electronics - Market size and forecast (2023-2028) ($ million)
- Data Table on Electrical and electronics - Market size and forecast (2023-2028) ($ million)
- Chart on Electrical and electronics - Year-over-year growth (2023-2028) (%)
- Data Table on Electrical and electronics - Year-over-year growth (2023-2028) (%)
- 6.4 Automotive - Market size and forecast (2023-2028)
- Chart on Automotive - Market size and forecast (2023-2028) ($ million)
- Data Table on Automotive - Market size and forecast (2023-2028) ($ million)
- Chart on Automotive - Year-over-year growth (2023-2028) (%)
- Data Table on Automotive - Year-over-year growth (2023-2028) (%)
- 6.5 Household appliances - Market size and forecast (2023-2028)
- Chart on Household appliances - Market size and forecast (2023-2028) ($ million)
- Data Table on Household appliances - Market size and forecast (2023-2028) ($ million)
- Chart on Household appliances - Year-over-year growth (2023-2028) (%)
- Data Table on Household appliances - Year-over-year growth (2023-2028) (%)
- 6.6 Extrusion products - Market size and forecast (2023-2028)
- Chart on Extrusion products - Market size and forecast (2023-2028) ($ million)
- Data Table on Extrusion products - Market size and forecast (2023-2028) ($ million)
- Chart on Extrusion products - Year-over-year growth (2023-2028) (%)
- Data Table on Extrusion products - Year-over-year growth (2023-2028) (%)
- 6.7 Market opportunity by Application
- Market opportunity by Application ($ million)
- Data Table on Market opportunity by Application ($ million)
7 Market Segmentation by Type
- 7.1 Market segments
- Chart on Type - Market share (2023-2028) (%)
- Data Table on Type - Market share (2023-2028) (%)
- 7.2 Comparison by Type
- Chart on Comparison by Type
- Data Table on Comparison by Type
- 7.3 Industrial grade - Market size and forecast (2023-2028)
- Chart on Industrial grade - Market size and forecast (2023-2028) ($ million)
- Data Table on Industrial grade - Market size and forecast (2023-2028) ($ million)
- Chart on Industrial grade - Year-over-year growth (2023-2028) (%)
- Data Table on Industrial grade - Year-over-year growth (2023-2028) (%)
- 7.4 Commercial grade - Market size and forecast (2023-2028)
- Chart on Commercial grade - Market size and forecast (2023-2028) ($ million)
- Data Table on Commercial grade - Market size and forecast (2023-2028) ($ million)
- Chart on Commercial grade - Year-over-year growth (2023-2028) (%)
- Data Table on Commercial grade - Year-over-year growth (2023-2028) (%)
- 7.5 Market opportunity by Type
- Market opportunity by Type ($ million)
- Data Table on Market opportunity by Type ($ million)
8 Market Segmentation by Form
- 8.1 Market segments
- Chart on Form - Market share (2023-2028) (%)
- Data Table on Form - Market share (2023-2028) (%)
- 8.2 Comparison by Form
- Chart on Comparison by Form
- Data Table on Comparison by Form
- 8.3 Granules - Market size and forecast (2023-2028)
- Chart on Granules - Market size and forecast (2023-2028) ($ million)
- Data Table on Granules - Market size and forecast (2023-2028) ($ million)
- Chart on Granules - Year-over-year growth (2023-2028) (%)
- Data Table on Granules - Year-over-year growth (2023-2028) (%)
- 8.4 Pellets - Market size and forecast (2023-2028)
- Chart on Pellets - Market size and forecast (2023-2028) ($ million)
- Data Table on Pellets - Market size and forecast (2023-2028) ($ million)
- Chart on Pellets - Year-over-year growth (2023-2028) (%)
- Data Table on Pellets - Year-over-year growth (2023-2028) (%)
- 8.5 Market opportunity by Form
- Market opportunity by Form ($ million)
- Data Table on Market opportunity by Form ($ million)
9 Market Segmentation by Manufacturing Process
- 9.1 Market segments
- Chart on Manufacturing Process - Market share (2023-2028) (%)
- Data Table on Manufacturing Process - Market share (2023-2028) (%)
- 9.2 Comparison by Manufacturing Process
- Chart on Comparison by Manufacturing Process
- Data Table on Comparison by Manufacturing Process
- 9.3 Polymerization - Market size and forecast (2023-2028)
- Chart on Polymerization - Market size and forecast (2023-2028) ($ million)
- Data Table on Polymerization - Market size and forecast (2023-2028) ($ million)
- Chart on Polymerization - Year-over-year growth (2023-2028) (%)
- Data Table on Polymerization - Year-over-year growth (2023-2028) (%)
- 9.4 Compounding - Market size and forecast (2023-2028)
- Chart on Compounding - Market size and forecast (2023-2028) ($ million)
- Data Table on Compounding - Market size and forecast (2023-2028) ($ million)
- Chart on Compounding - Year-over-year growth (2023-2028) (%)
- Data Table on Compounding - Year-over-year growth (2023-2028) (%)
- 9.5 Market opportunity by Manufacturing Process
- Market opportunity by Manufacturing Process ($ million)
- Data Table on Market opportunity by Manufacturing Process ($ million)
10 Customer Landscape
- 10.1 Customer landscape overview
- Analysis of price sensitivity, lifecycle, customer purchase basket, adoption rates, and purchase criteria
11 Geographic Landscape
- 11.1 Geographic segmentation
- Chart on Market share by geography 2023-2028 (%)
- Data Table on Market share by geography 2023-2028 (%)
- 11.2 Geographic comparison
- Chart on Geographic comparison
- Data Table on Geographic comparison
- 11.3 APAC - Market size and forecast 2023-2028
- Chart on APAC - Market size and forecast 2023-2028 ($ million)
- Data Table on APAC - Market size and forecast 2023-2028 ($ million)
- Chart on APAC - Year-over-year growth 2023-2028 (%)
- Data Table on APAC - Year-over-year growth 2023-2028 (%)
- 11.4 Europe - Market size and forecast 2023-2028
- Chart on Europe - Market size and forecast 2023-2028 ($ million)
- Data Table on Europe - Market size and forecast 2023-2028 ($ million)
- Chart on Europe - Year-over-year growth 2023-2028 (%)
- Data Table on Europe - Year-over-year growth 2023-2028 (%)
- 11.5 North America - Market size and forecast 2023-2028
- Chart on North America - Market size and forecast 2023-2028 ($ million)
- Data Table on North America - Market size and forecast 2023-2028 ($ million)
- Chart on North America - Year-over-year growth 2023-2028 (%)
- Data Table on North America - Year-over-year growth 2023-2028 (%)
- 11.6 South America - Market size and forecast 2023-2028
- Chart on South America - Market size and forecast 2023-2028 ($ million)
- Data Table on South America - Market size and forecast 2023-2028 ($ million)
- Chart on South America - Year-over-year growth 2023-2028 (%)
- Data Table on South America - Year-over-year growth 2023-2028 (%)
- 11.7 Middle East and Africa - Market size and forecast 2023-2028
- Chart on Middle East and Africa - Market size and forecast 2023-2028 ($ million)
- Data Table on Middle East and Africa - Market size and forecast 2023-2028 ($ million)
- Chart on Middle East and Africa - Year-over-year growth 2023-2028 (%)
- Data Table on Middle East and Africa - Year-over-year growth 2023-2028 (%)
- 11.8 China - Market size and forecast 2023-2028
- Chart on China - Market size and forecast 2023-2028 ($ million)
- Data Table on China - Market size and forecast 2023-2028 ($ million)
- Chart on China - Year-over-year growth 2023-2028 (%)
- Data Table on China - Year-over-year growth 2023-2028 (%)
- 11.9 US - Market size and forecast 2023-2028
- Chart on US - Market size and forecast 2023-2028 ($ million)
- Data Table on US - Market size and forecast 2023-2028 ($ million)
- Chart on US - Year-over-year growth 2023-2028 (%)
- Data Table on US - Year-over-year growth 2023-2028 (%)
- 11.10 Germany - Market size and forecast 2023-2028
- Chart on Germany - Market size and forecast 2023-2028 ($ million)
- Data Table on Germany - Market size and forecast 2023-2028 ($ million)
- Chart on Germany - Year-over-year growth 2023-2028 (%)
- Data Table on Germany - Year-over-year growth 2023-2028 (%)
- 11.11 India - Market size and forecast 2023-2028
- Chart on India - Market size and forecast 2023-2028 ($ million)
- Data Table on India - Market size and forecast 2023-2028 ($ million)
- Chart on India - Year-over-year growth 2023-2028 (%)
- Data Table on India - Year-over-year growth 2023-2028 (%)
- 11.12 UK - Market size and forecast 2023-2028
- Chart on UK - Market size and forecast 2023-2028 ($ million)
- Data Table on UK - Market size and forecast 2023-2028 ($ million)
- Chart on UK - Year-over-year growth 2023-2028 (%)
- Data Table on UK - Year-over-year growth 2023-2028 (%)
- 11.13 Market opportunity by geography
- Market opportunity by geography ($ million)
- Data Tables on Market opportunity by geography ($ million)
- 11.14 Canada - Market size and forecast (2023-2028)
- Chart on Canada - Market size and forecast (2023-2028) ($ million)
- Data Table on Canada - Market size and forecast (2023-2028) ($ million)
- Chart on Canada - Year-over-year growth (2023-2028) (%)
- Data Table on Canada - Year-over-year growth (2023-2028) (%)
- 11.15 Italy - Market size and forecast (2023-2028)
- Chart on Italy - Market size and forecast (2023-2028) ($ million)
- Data Table on Italy - Market size and forecast (2023-2028) ($ million)
- Chart on Italy - Year-over-year growth (2023-2028) (%)
- Data Table on Italy - Year-over-year growth (2023-2028) (%)
- 11.16 France - Market size and forecast (2023-2028)
- Chart on France - Market size and forecast (2023-2028) ($ million)
- Data Table on France - Market size and forecast (2023-2028) ($ million)
- Chart on France - Year-over-year growth (2023-2028) (%)
- Data Table on France - Year-over-year growth (2023-2028) (%)
- 11.17 Japan - Market size and forecast (2023-2028)
- Chart on Japan - Market size and forecast (2023-2028) ($ million)
- Data Table on Japan - Market size and forecast (2023-2028) ($ million)
- Chart on Japan - Year-over-year growth (2023-2028) (%)
- Data Table on Japan - Year-over-year growth (2023-2028) (%)
- 11.18 Brazil - Market size and forecast (2023-2028)
- Chart on Brazil - Market size and forecast (2023-2028) ($ million)
- Data Table on Brazil - Market size and forecast (2023-2028) ($ million)
- Chart on Brazil - Year-over-year growth (2023-2028) (%)
- Data Table on Brazil - Year-over-year growth (2023-2028) (%)
- 11.19 Egypt - Market size and forecast (2023-2028)
- Chart on Egypt - Market size and forecast (2023-2028) ($ million)
- Data Table on Egypt - Market size and forecast (2023-2028) ($ million)
- Chart on Egypt - Year-over-year growth (2023-2028) (%)
- Data Table on Egypt - Year-over-year growth (2023-2028) (%)
- 11.20 UAE - Market size and forecast (2023-2028)
- Chart on UAE - Market size and forecast (2023-2028) ($ million)
- Data Table on UAE - Market size and forecast (2023-2028) ($ million)
- Chart on UAE - Year-over-year growth (2023-2028) (%)
- Data Table on UAE - Year-over-year growth (2023-2028) (%)
- 11.21 Oman - Market size and forecast (2023-2028)
- Chart on Oman - Market size and forecast (2023-2028) ($ million)
- Data Table on Oman - Market size and forecast (2023-2028) ($ million)
- Chart on Oman - Year-over-year growth (2023-2028) (%)
- Data Table on Oman - Year-over-year growth (2023-2028) (%)
- 11.22 Argentina - Market size and forecast (2023-2028)
- Chart on Argentina - Market size and forecast (2023-2028) ($ million)
- Data Table on Argentina - Market size and forecast (2023-2028) ($ million)
- Chart on Argentina - Year-over-year growth (2023-2028) (%)
- Data Table on Argentina - Year-over-year growth (2023-2028) (%)
- 11.23 KSA - Market size and forecast (2023-2028)
- Chart on KSA - Market size and forecast (2023-2028) ($ million)
- Data Table on KSA - Market size and forecast (2023-2028) ($ million)
- Chart on KSA - Year-over-year growth (2023-2028) (%)
- Data Table on KSA - Year-over-year growth (2023-2028) (%)
- 11.24 Rest of World (ROW) - Market size and forecast (2023-2028)
- Chart on Rest of World (ROW) - Market size and forecast (2023-2028) ($ million)
- Data Table on Rest of World (ROW) - Market size and forecast (2023-2028) ($ million)
- Chart on Rest of World (ROW) - Year-over-year growth (2023-2028) (%)
- Data Table on Rest of World (ROW) - Year-over-year growth (2023-2028) (%)
12 Drivers, Challenges, and Opportunity/Restraints
- 12.3 Impact of drivers and challenges
- Impact of drivers and challenges in 2023 and 2028
- 12.4 Market opportunities/restraints
13 Competitive Landscape
- 13.2 Competitive Landscape
- Overview on criticality of inputs and factors of differentiation
- 13.3 Landscape disruption
- Overview on factors of disruption
- 13.4 Industry risks
- Impact of key risks on business
14 Competitive Analysis
- 14.2 Market positioning of companies
- Matrix on companies position and classification
- 14.3 Aady Polymers
- Aady Polymers - Overview
- Aady Polymers - Product / Service
- Aady Polymers - Key offerings
- 14.4 Arkema SA
- Arkema SA - Overview
- Arkema SA - Product / Service
- Arkema SA - Key offerings
- 14.5 BASF SE
- BASF SE - Overview
- BASF SE - Product / Service
- BASF SE - Key offerings
- 14.6 Celanese Corporation
- Celanese Corporation - Overview
- Celanese Corporation - Product / Service
- Celanese Corporation - Key offerings
- 14.7 Chang Chun Group
- Chang Chun Group - Overview
- Chang Chun Group - Product / Service
- Chang Chun Group - Key offerings
- 14.8 China National BlueStar (Group) Co., Ltd.
- China National BlueStar (Group) Co., Ltd. - Overview
- China National BlueStar (Group) Co., Ltd. - Product / Service
- China National BlueStar (Group) Co., Ltd. - Key offerings
- 14.9 Covestro AG
- Covestro AG - Overview
- Covestro AG - Product / Service
- Covestro AG - Key offerings
- 14.10 DAK Americas
- DAK Americas - Overview
- DAK Americas - Product / Service
- DAK Americas - Key offerings
- 14.11 DuPont de Nemours Inc.
- DuPont de Nemours Inc. - Overview
- DuPont de Nemours Inc. - Product / Service
- DuPont de Nemours Inc. - Key offerings
- 14.12 Ester Industries Ltd.
- Ester Industries Ltd. - Overview
- Ester Industries Ltd. - Product / Service
- Ester Industries Ltd. - Key offerings
- 14.13 Evonik Industries AG
- Evonik Industries AG - Overview
- Evonik Industries AG - Product / Service
- Evonik Industries AG - Key offerings
- 14.14 Far Eastern New Century Corporation
- Far Eastern New Century Corporation - Overview
- Far Eastern New Century Corporation - Product / Service
- Far Eastern New Century Corporation - Key offerings
- 14.15 Formosa Plastics Corporation
- Formosa Plastics Corporation - Overview
- Formosa Plastics Corporation - Product / Service
- Formosa Plastics Corporation - Key offerings
- 14.16 Indorama Ventures Public Company Limited
- Indorama Ventures Public Company Limited - Overview
- Indorama Ventures Public Company Limited - Product / Service
- Indorama Ventures Public Company Limited - Key offerings
- 14.17 JBF Industries
- JBF Industries - Overview
- JBF Industries - Product / Service
- JBF Industries - Key offerings
- 14.18 Lanxess AG
- Lanxess AG - Overview
- Lanxess AG - Product / Service
- Lanxess AG - Key offerings
- 14.19 Mitsubishi Chemical Group
- Mitsubishi Chemical Group - Overview
- Mitsubishi Chemical Group - Product / Service
- Mitsubishi Chemical Group - Key offerings
- 14.20 Polyplastics Co. Ltd.
- Polyplastics Co. Ltd. - Overview
- Polyplastics Co. Ltd. - Product / Service
- Polyplastics Co. Ltd. - Key offerings
- 14.21 Reliance Industries Limited
- Reliance Industries Limited - Overview
- Reliance Industries Limited - Product / Service
- Reliance Industries Limited - Key offerings
- 14.22 SABIC
- SABIC - Overview
- SABIC - Product / Service
- SABIC - Key offerings
- 14.23 Toray Industries Inc.
- Toray Industries Inc. - Overview
- Toray Industries Inc. - Product / Service
- Toray Industries Inc. - Key offerings
- 14.24 BASF SE
- BASF SE - Overview
- BASF SE - Product / Service
- BASF SE - Key offerings
- 14.25 Celanese Corp.
- Celanese Corp. - Overview
- Celanese Corp. - Product / Service
- Celanese Corp. - Key offerings
- 14.26 Chang Chun Group
- Chang Chun Group - Overview
- Chang Chun Group - Product / Service
- Chang Chun Group - Key offerings
- 14.27 China Petrochemical Corp.
- China Petrochemical Corp. - Overview
- China Petrochemical Corp. - Product / Service
- China Petrochemical Corp. - Key offerings
- 14.28 Daicel Corp.
- Daicel Corp. - Overview
- Daicel Corp. - Product / Service
- Daicel Corp. - Key offerings
- 14.29 DuPont de Nemours Inc.
- DuPont de Nemours Inc. - Overview
- DuPont de Nemours Inc. - Product / Service
- DuPont de Nemours Inc. - Key offerings
- 14.30 Kingfa SCI. and TECH. Co. Ltd.
- Kingfa SCI. and TECH. Co. Ltd. - Overview
- Kingfa SCI. and TECH. Co. Ltd. - Product / Service
- Kingfa SCI. and TECH. Co. Ltd. - Key offerings
- 14.31 Kolon Industries Inc.
- Kolon Industries Inc. - Overview
- Kolon Industries Inc. - Product / Service
- Kolon Industries Inc. - Key offerings
- 14.32 Lanxess AG
- Lanxess AG - Overview
- Lanxess AG - Product / Service
- Lanxess AG - Key offerings
- 14.33 LG Chem Ltd.
- LG Chem Ltd. - Overview
- LG Chem Ltd. - Product / Service
- LG Chem Ltd. - Key offerings
- 14.34 LyondellBasell Industries N.V.
- LyondellBasell Industries N.V. - Overview
- LyondellBasell Industries N.V. - Product / Service
- LyondellBasell Industries N.V. - Key offerings
- 14.35 Mitsubishi Chemical Corp.
- Mitsubishi Chemical Corp. - Overview
- Mitsubishi Chemical Corp. - Product / Service
- Mitsubishi Chemical Corp. - Key offerings
- 14.36 Mitsui and Co. Ltd.
- Mitsui and Co. Ltd. - Overview
- Mitsui and Co. Ltd. - Product / Service
- Mitsui and Co. Ltd. - Key offerings
- 14.37 Radici Partecipazioni Spa
- Radici Partecipazioni Spa - Overview
- Radici Partecipazioni Spa - Product / Service
- Radici Partecipazioni Spa - Key offerings
- 14.38 RTP Co.
- RTP Co. - Overview
- RTP Co. - Product / Service
- RTP Co. - Key offerings
- 14.39 S.S.B. POLYMERS and S.S.B. ENTERPRISES
- S.S.B. POLYMERS and S.S.B. ENTERPRISES - Overview
- S.S.B. POLYMERS and S.S.B. ENTERPRISES - Product / Service
- S.S.B. POLYMERS and S.S.B. ENTERPRISES - Key offerings
- 14.40 Samyang Corp.
- Samyang Corp. - Overview
- Samyang Corp. - Product / Service
- Samyang Corp. - Key offerings
- 14.41 Saudi Basic Industries Corp.
- Saudi Basic Industries Corp. - Overview
- Saudi Basic Industries Corp. - Product / Service
- Saudi Basic Industries Corp. - Key offerings
- 14.42 Sinochem Group Co. Ltd.
- Sinochem Group Co. Ltd. - Overview
- Sinochem Group Co. Ltd. - Product / Service
- Sinochem Group Co. Ltd. - Key offerings
- 14.43 Toray Industries Inc.
- Toray Industries Inc. - Overview
- Toray Industries Inc. - Product / Service
- Toray Industries Inc. - Key offerings
15 Appendix
- 15.2 Inclusions and exclusions checklist
- Inclusions checklist
- Exclusions checklist
- 15.3 Currency conversion rates for US$
- Currency conversion rates for US$
- 15.4 Research methodology
- 15.7 Validation techniques employed for market sizing
- Validation techniques employed for market sizing
- 15.9 360 degree market analysis
- 360 degree market analysis
- 15.10 List of abbreviations