
Polyurethane Microspheres Market Size 2024-2028
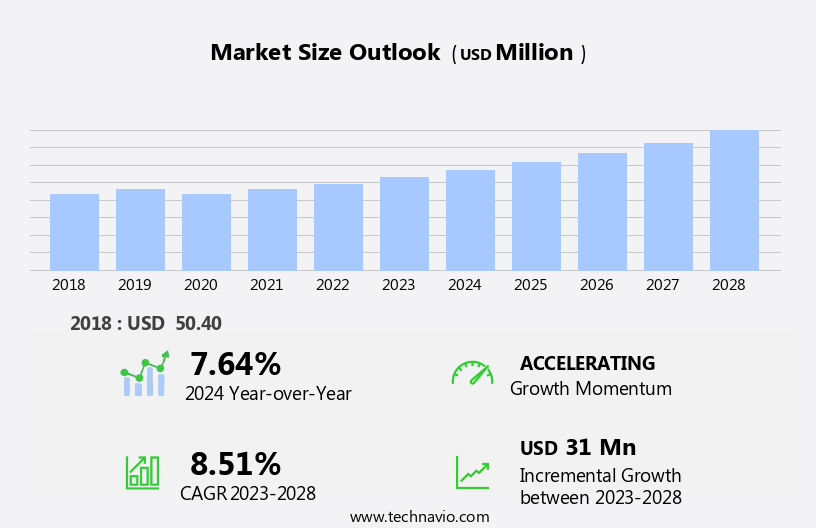
The polyurethane microspheres market size is forecast to increase by USD 31 million, at a CAGR of 8.51% between 2023 and 2028.
- The market is experiencing significant growth, driven primarily by the expanding demand for polyurethane adhesives in the building and construction industry. The versatility and high performance of these adhesives make them an indispensable component in various construction applications, from insulation to bonding and sealing. However, market growth is not without challenges. Environmental regulations are increasingly stringent, posing significant hurdles for manufacturers.
- Compliance with these regulations adds to production costs, necessitating innovative solutions to maintain competitiveness. Additionally, the growing trend towards sustainable and eco-friendly products is influencing consumer preferences and market dynamics. Companies must respond by investing in research and development to create environmentally friendly polyurethane microspheres, ensuring long-term success in this evolving market landscape.
What will be the Size of the Polyurethane Microspheres Market during the forecast period?
Explore in-depth regional segment analysis with market size data - historical 2018-2022 and forecasts 2024-2028 - in the full report.
Request Free Sample
The market continues to evolve, driven by the diverse applications and advancements in material science. These microspheres offer exceptional properties such as creep resistance, thermal insulation, and fatigue resistance, making them valuable in various sectors. In medical devices, they provide excellent water absorption and serve as effective filter media. In construction materials, they contribute to acoustic insulation and enhance the shelf life of concrete. The production process of polyurethane microspheres involves intricate material science, with methods including fluidized bed drying, spray drying, and emulsion polymerization. The particles' surface area, size distribution, and compression set are crucial factors in ensuring batch consistency and meeting regulatory compliance.
The market's dynamics extend to supply chain management, with distribution networks and catalyst supports playing a significant role in maintaining quality assurance. Construction materials, automotive parts, and aerospace components all benefit from the energy efficiency and dimensional stability provided by these microspheres. Environmental impact is a growing concern, with research focusing on the production process's energy efficiency and the development of sustainable raw material sourcing. The market's continuous unfolding also involves addressing handling precautions, UV resistance, and safety standards. As the market evolves, so do the testing methods and quality control measures. Tensile strength, compressive strength, and open-cell structure are essential factors in assessing the microspheres' performance.
The closed-cell structure and chemical resistance further expand their applications, from sporting goods to aerospace components. Pricing strategies and safety standards are essential considerations in the market's dynamics. As the demand for polyurethane microspheres grows, so does the importance of understanding their unique properties and applications.
How is this Polyurethane Microspheres Industry segmented?
The polyurethane microspheres industry research report provides comprehensive data (region-wise segment analysis), with forecasts and estimates in "USD million" for the period 2024-2028, as well as historical data from 2018-2022 for the following segments.
- Application
- Encapsulation
- Paints and coatings
- Adhesives
- Cosmetics
- Geography
- North America
- US
- Europe
- Germany
- Russia
- UK
- APAC
- China
- Rest of World (ROW)
- North America
By Application Insights
The encapsulation segment is estimated to witness significant growth during the forecast period.
In the dynamic and evolving market, various industries leverage encapsulation technology to maximize benefits. Encapsulation, which involves coating or embedding active ingredients within these microspheres, offers protection, stability, and controlled release. Pharmaceuticals, cosmetics, and agrochemicals are major sectors that adopt this technology. In pharmaceuticals, encapsulation ensures precise drug delivery and enhances bioavailability. The cosmetics industry gains from controlled release of active ingredients, boosting product efficacy and longevity. In agrochemicals, encapsulation enables the gradual release of pesticides and fertilizers, promoting effective pest control, nutrient delivery, and minimizing environmental impact. Material science plays a pivotal role in the production process, ensuring creep resistance, fatigue resistance, and dimensional stability.
Thermal insulation and acoustic insulation properties make these microspheres valuable in construction materials and aerospace components. Water absorption, particle size distribution, and surface area are crucial factors affecting the performance and application scope. Quality control and safety standards are essential in the manufacturing process. Regulatory compliance, energy efficiency, and flame retardancy are essential considerations to meet industry demands. Distribution networks and supply chain management are critical for maintaining batch consistency and ensuring timely delivery. Surface treatment, pricing strategies, and handling precautions are essential aspects of the market. Understanding the material science behind polymer chemistry, including emulsion polymerization, melt polymerization, and suspension polymerization, is vital for optimizing production processes.
Catalyst supports and packaging materials are essential components in the manufacturing process, while testing methods and particle counting ensure product quality. In conclusion, the market is characterized by its diverse applications, driven by the need for enhanced product performance, environmental sustainability, and regulatory compliance. Encapsulation technology, production processes, and material science are key factors shaping the market's dynamics and trends.
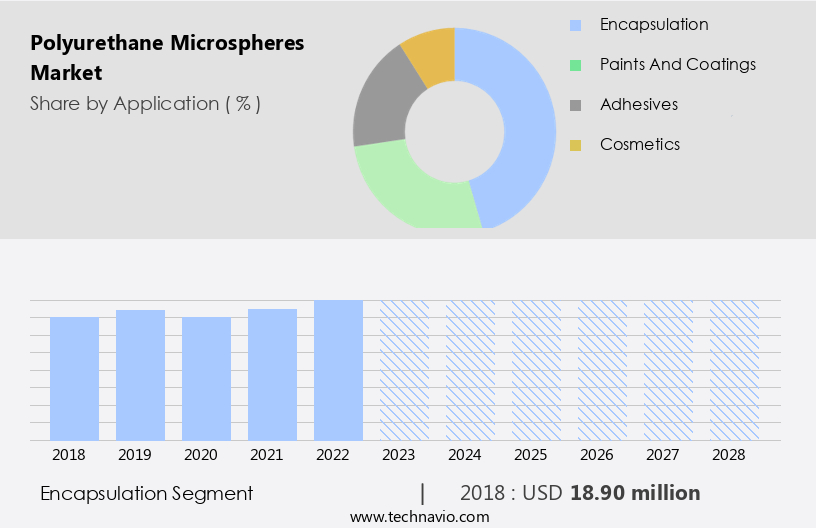
The Encapsulation segment was valued at USD 18.90 million in 2018 and showed a gradual increase during the forecast period.
Regional Analysis
Europe is estimated to contribute 42% to the growth of the global market during the forecast period. Technavio's analysts have elaborately explained the regional trends and drivers that shape the market during the forecast period.
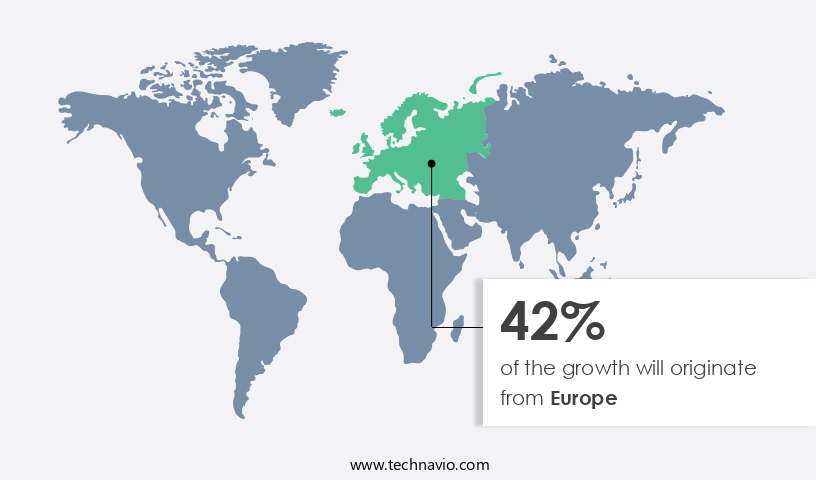
The European market is experiencing significant growth due to the increasing demand for paints, coatings, and adhesives in both residential and non-residential construction activities. In countries like the UK, Germany, Spain, Poland, and France, the construction sector is expanding, leading to increased usage of these materials. In Germany, the non-residential and commercial building sector is expected to grow substantially, as the economy recovers and urbanization continues. The shortage of housing units in urban areas, coupled with a rising population, is creating a supply-demand imbalance. Polyurethane microspheres offer superior creep resistance and thermal insulation, making them an ideal choice for various applications.
The production process involves material science techniques such as emulsion polymerization, suspension polymerization, and melt polymerization, ensuring consistency and quality. These microspheres also exhibit excellent fatigue resistance, making them suitable for use in medical devices, filter media, and automotive parts. Environmental impact is a crucial consideration in the market, with manufacturers focusing on energy efficiency and regulatory compliance. The distribution networks are well-established, ensuring the availability of raw materials and finished products. Supply chain management is optimized through the use of advanced technologies and safety standards. The material's properties, such as dimensional stability, thermal conductivity, and surface area, are essential for various applications.
The microspheres can be processed using methods like spray drying and fluidized bed drying to achieve the desired particle size distribution and shape. Quality assurance measures, including particle counting, surface treatment, and tensile strength testing, ensure the consistency and reliability of the final product. The market's pricing strategies are influenced by factors like raw material sourcing, production costs, and competition. The microspheres' properties, such as compressive strength, open-cell structure, closed-cell structure, and chemical resistance, impact their applications and pricing. The market's growth is also driven by emerging trends, such as the use of polyurethane microspheres in acoustic insulation, aerospace components, sporting goods, and flame retardancy.
Market Dynamics
Our researchers analyzed the data with 2023 as the base year, along with the key drivers, trends, and challenges. A holistic analysis of drivers will help companies refine their marketing strategies to gain a competitive advantage.
What are the key market drivers leading to the rise in the adoption of Polyurethane Microspheres Industry?
- The building and construction industry's increasing requirement for polyurethane adhesives serves as the primary market driver.
- Polyurethane microspheres are a type of adhesive with unique properties, including an open-cell structure that ensures excellent chemical resistance and a closed-cell structure for enhanced strength. These microspheres are produced through either suspension or melt polymerization processes, resulting in a particle size distribution that caters to various applications. The construction industry benefits significantly from polyurethane microspheres due to their quick curing and high strength qualities. Their adaptability to bond various materials, such as plastics, glass, PVFs, aluminum, stainless steel, and other metals, makes them a versatile choice for construction applications. Quality assurance is crucial in the production of polyurethane microspheres, with surface treatment and quality control measures ensuring consistent product performance.
- Pricing strategies and safety standards are essential factors in the market. Stringent safety regulations and the need for flame retardancy have driven innovations in the industry. Despite these challenges, the market continues to grow, driven by increasing investments in infrastructure development in Asia Pacific and Central and South America. The housing market in these regions, particularly in countries like India, Thailand, the Philippines, Indonesia, Peru, Colombia, Brazil, Mexico, and Chile, is experiencing significant growth, leading to increased demand for construction adhesives from both residential and commercial sectors.
What are the market trends shaping the Polyurethane Microspheres Industry?
- Sustainable products are gaining increasing popularity in the market, making it a significant trend for businesses to adopt them. This shift towards eco-friendly options reflects consumers' growing awareness and preference for reducing their carbon footprint.
- The global market for Polyurethane Microspheres is experiencing significant growth due to their unique properties, including creep resistance and fatigue resistance. These microspheres are widely used in various industries for thermal insulation and acoustic insulation. In the production process, they offer excellent supply chain management benefits, ensuring consistent quality and reliability. One of the primary applications of Polyurethane Microspheres is in the manufacturing of medical devices, where their low water absorption properties are crucial. They are also used in filter media to enhance filtration efficiency and reduce pressure drops. In the construction industry, these microspheres are utilized as lightweight fillers for concrete and as insulation materials for roofing and wall systems.
- Moreover, Polyurethane Microspheres are increasingly being used in automotive parts due to their excellent thermal insulation properties. They help maintain optimal temperature conditions, ensuring improved fuel efficiency and enhanced passenger comfort. Despite their numerous benefits, the production and use of Polyurethane Microspheres have environmental implications. Therefore, efforts are being made to minimize their environmental impact through the development of eco-friendly production processes and the use of recycled materials. In summary, the market is expected to grow steadily during the forecast period due to their unique properties and wide range of applications in various industries.
- The increasing demand for energy efficiency and environmental sustainability is also driving the market's growth.
What challenges does the Polyurethane Microspheres Industry face during its growth?
- The growth of the industry is significantly impacted by the stringent environmental regulations that businesses must adhere to.
- The market faces significant challenges due to increasing regulatory pressures on volatile organic compounds (VOCs) emissions in the paints and coatings industry. VOCs are released during the drying process of solvent-based coatings, posing health and environmental risks. Governments worldwide, particularly in North America and Europe, have enacted stringent regulations to limit VOC emissions. To address these challenges, advanced drying technologies such as fluidized bed drying and spray drying are being adopted. These methods reduce VOC emissions by up to 90% compared to traditional methods. Additionally, material science advancements in polymer chemistry have led to the development of UV-resistant and compression-set resistant microspheres, extending their shelf life and improving their surface area for better adhesion.
- Distribution networks and packaging materials play a crucial role in maintaining batch consistency and ensuring product quality. Particle counting and catalyst supports are essential in the manufacturing process to ensure uniform particle size distribution and optimal catalyst efficiency. These factors contribute to the growth and sustainability of the market.
Exclusive Customer Landscape
The polyurethane microspheres market forecasting report includes the adoption lifecycle of the market, covering from the innovator's stage to the laggard's stage. It focuses on adoption rates in different regions based on penetration. Furthermore, the polyurethane microspheres market report also includes key purchase criteria and drivers of price sensitivity to help companies evaluate and develop their market growth analysis strategies.

Customer Landscape
Key Companies & Market Insights
Companies are implementing various strategies, such as strategic alliances, polyurethane microspheres market forecast, partnerships, mergers and acquisitions, geographical expansion, and product/service launches, to enhance their presence in the industry.
Asahi Kasei Corp. - The company specializes in producing polyurethane microspheres, featuring DUALITE U's heat expandable variety.
The industry research and growth report includes detailed analyses of the competitive landscape of the market and information about key companies, including:
- Asahi Kasei Corp.
- Bagavathiamman Hi-Tech Coatings
- Chase Corp.
- Covestro AG
- HEYO ENTERPRISES Co. Ltd.
- HOS Technik Vertriebs und Produktions GmbH
- ICB PHARMA
- Inesfly
- Koehler Paper SE
- KOLON LIFE SCIENCE
- Lamberti SpA
- Microchem
- MikroCaps d.o.o
- Sanyo Chemical Industries Ltd.
- Solvay SA
- TAGRA Biotechnologies Ltd.
Qualitative and quantitative analysis of companies has been conducted to help clients understand the wider business environment as well as the strengths and weaknesses of key industry players. Data is qualitatively analyzed to categorize companies as pure play, category-focused, industry-focused, and diversified; it is quantitatively analyzed to categorize companies as dominant, leading, strong, tentative, and weak.
Recent Development and News in Polyurethane Microspheres Market
- In January 2024, BASF SE, a leading chemical producer, announced the expansion of its production capacity for polyurethane microspheres at its site in Ludwigshafen, Germany. This expansion aimed to cater to the growing demand for lightweight materials in various industries, including automotive and construction (BASF press release, 2024).
- In March 2024, Covestro AG, another major player in the polyurethane industry, entered into a strategic collaboration with Dow Inc. To develop and commercialize new polyurethane microspheres for use in coatings and adhesives applications. This partnership was expected to drive innovation and growth in the market (Dow Inc. Press release, 2024).
- In May 2024, Huntsman Corporation, a global chemical company, completed the acquisition of CVC Thermoset Specialties, a leading manufacturer of polyurethane microspheres. This acquisition expanded Huntsman's portfolio in the high-performance materials segment and strengthened its position in the market (Huntsman Corporation press release, 2024).
- In February 2025, the European Commission approved the use of polyurethane microspheres in road construction applications, paving the way for their increased adoption in the European market. This approval was expected to boost the demand for these lightweight, insulating materials in the construction sector (European Commission press release, 2025).
Research Analyst Overview
- The market is experiencing significant activity and trends, driven by industry collaboration and technological advancement. Safety regulations and health and safety concerns continue to shape market dynamics, with a focus on ensuring mechanical and thermal properties meet stringent standards. Competitive advantage is achieved through product differentiation, achieved through the development of hybrid materials and surface modification techniques. Technological barriers are being addressed through process optimization and the use of reactive blends. Future trends include sustainability initiatives, such as the use of environmental regulations and microsphere synthesis methods that minimize waste.
- Customer needs are driving application techniques, with a focus on quality control and intellectual property protection. Process monitoring and reaction kinetics are critical for ensuring consistent product performance and meeting industry regulations. Composite materials are gaining popularity due to their enhanced physical properties, while emerging applications in various industries continue to expand market opportunities.
Dive into Technavio's robust research methodology, blending expert interviews, extensive data synthesis, and validated models for unparalleled Polyurethane Microspheres Market insights. See full methodology.
|
Market Scope |
|
|
Report Coverage |
Details |
|
Page number |
139 |
|
Base year |
2023 |
|
Historic period |
2018-2022 |
|
Forecast period |
2024-2028 |
|
Growth momentum & CAGR |
Accelerate at a CAGR of 8.51% |
|
Market growth 2024-2028 |
USD 31 million |
|
Market structure |
Fragmented |
|
YoY growth 2023-2024(%) |
7.64 |
|
Key countries |
US, China, Germany, UK, and Russia |
|
Competitive landscape |
Leading Companies, Market Positioning of Companies, Competitive Strategies, and Industry Risks |
What are the Key Data Covered in this Polyurethane Microspheres Market Research and Growth Report?
- CAGR of the Polyurethane Microspheres industry during the forecast period
- Detailed information on factors that will drive the growth and forecasting between 2024 and 2028
- Precise estimation of the size of the market and its contribution of the industry in focus to the parent market
- Accurate predictions about upcoming growth and trends and changes in consumer behaviour
- Growth of the market across Europe, North America, APAC, Middle East and Africa, and South America
- Thorough analysis of the market's competitive landscape and detailed information about companies
- Comprehensive analysis of factors that will challenge the polyurethane microspheres market growth of industry companies
We can help! Our analysts can customize this polyurethane microspheres market research report to meet your requirements.
 RIA -
RIA - 
