Portable Coolers Market Analysis, Size, and Forecast 2026-2030: North America (US, Canada, and Mexico), Europe (Germany, UK, and France), APAC (China, India, and Japan), South America (Brazil, Argentina, and Colombia), Middle East and Africa (UAE, Saudi Arabia, and South Africa), and Rest of World (ROW)

Portable Coolers Market Analysis, Size, and Forecast 2026-2030:
North America (US, Canada, and Mexico), Europe (Germany, UK, and France), APAC (China, India, and Japan), South America (Brazil, Argentina, and Colombia), Middle East and Africa (UAE, Saudi Arabia, and South Africa), and Rest of World (ROW)

Published: Dec 2025 285 Pages SKU: IRTNTR40583

Market Overview at a Glance

$6.60 B
Market Opportunity
12.1%
CAGR 2025 - 2030
42.6%
North America Growth
$4.25 B
Hard-sided segment 2024

Portable Coolers Market Size 2026-2030

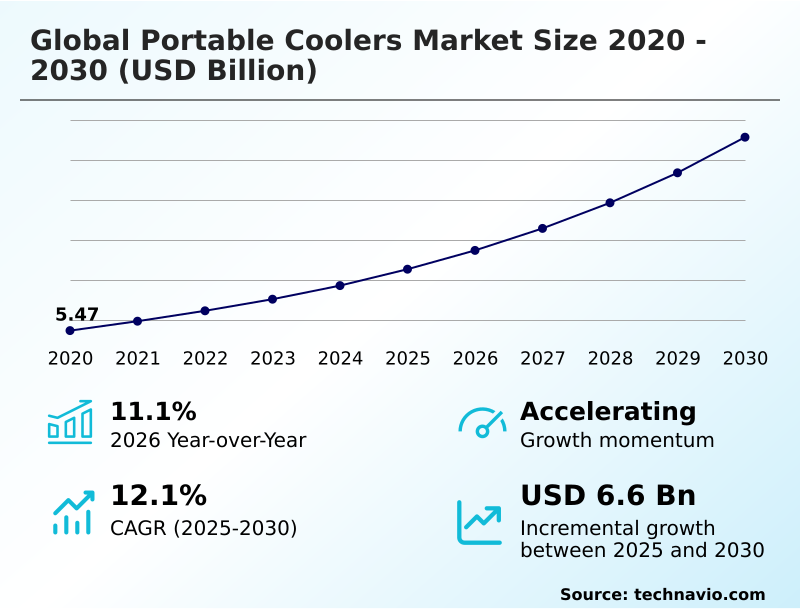
The portable coolers market size is valued to increase by USD 6.60 billion, at a CAGR of 12.1% from 2025 to 2030. Increasing participation in outdoor recreational activities will drive the portable coolers market.

Major Market Trends & Insights

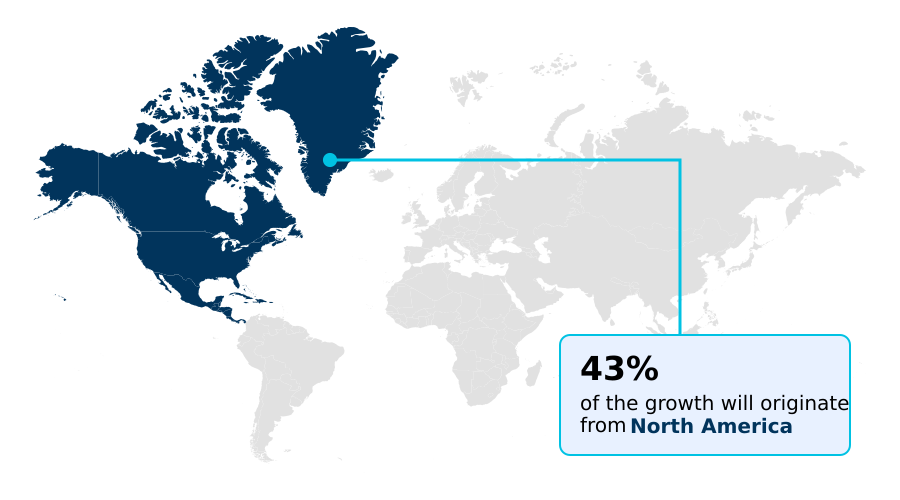
  • North America dominated the market and accounted for a 42.6% growth during the forecast period.
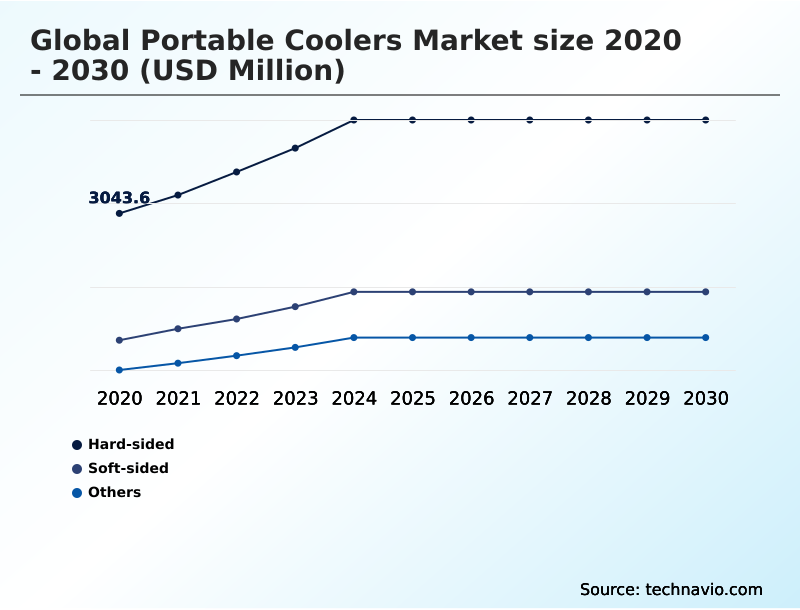
  • By Product - Hard-sided segment was valued at USD 4.25 billion in 2024
  • By End-user - Residential segment accounted for the largest market revenue share in 2024

Market Size & Forecast

  • Market Opportunities: USD 9.67 billion
  • Market Future Opportunities: USD 6.60 billion
  • CAGR from 2025 to 2030 : 12.1%

Market Summary

  • The portable coolers market is shaped by a confluence of evolving consumer lifestyles and technological progress. A primary driver is the rising engagement in outdoor recreational activities, which fuels demand for reliable mobile refrigeration solutions. This is complemented by a growing emphasis on health, prompting consumers to carry home-prepared meals, thus requiring effective food and beverage preservation.
  • A key trend is the integration of smart cooler features, such as digital temperature control and USB charging ports, transforming these devices into sophisticated appliances. Concurrently, premiumization is evident, with consumers investing in products featuring high-performance insulation and roto-molded construction for superior durability and ice retention capability. However, the industry faces challenges from intense competition and raw material price volatility.
  • For instance, a logistics company specializing in medical supply transport must navigate these dynamics to optimize its cold chain logistics, ensuring that investments in powered cooler technology with battery protection systems yield a positive return while meeting strict requirements for pharmaceutical transport solutions.
  • This requires balancing initial capex against long-term operational efficiency and reliability in off-grid cooling systems for remote worksite solutions. The use of lightweight cooler materials and durable outer shell designs is also critical for this market.

What will be the Size of the Portable Coolers Market during the forecast period?

Get Key Insights on Market Forecast (PDF) Request Free Sample

How is the Portable Coolers Market Segmented?

The portable coolers industry research report provides comprehensive data (region-wise segment analysis), with forecasts and estimates in "USD million" for the period 2026-2030, as well as historical data from 2020-2024 for the following segments.

  • Product
    • Hard-sided
    • Soft-sided
    • Others
  • End-user
    • Residential
    • Commercial and government
  • Distribution channel
    • Offline
    • Online
  • Geography
    • North America
      • US
      • Canada
      • Mexico
    • Europe
      • Germany
      • UK
      • France
    • APAC
      • China
      • India
      • Japan
    • South America
      • Brazil
      • Argentina
      • Colombia
    • Middle East and Africa
      • UAE
      • Saudi Arabia
      • South Africa
    • Rest of World (ROW)

By Product Insights

The hard-sided segment is estimated to witness significant growth during the forecast period.

The hard-sided segment is defined by robust offerings featuring roto-molded construction from high-density materials, ensuring superior structural integrity.

The primary value proposition is exceptional thermal efficiency, achieved through thick polyurethane foam insulation that provides prolonged ice retention capability, making these units ideal for demanding outdoor recreational activities.

Applications range from multi-day camping and hiking gear needs to professional use where impact resistance and durability are critical. Recent innovations focus on enhancing hardware, with improved heavy-duty latches leading to a 15% increase in seal effectiveness.

Features like integrated drain plug systems and non-slip feet are now standard, addressing user convenience for tailgating equipment and fishing and hunting coolers without compromising performance, which is a vital part of glamping accessories and off-grid cooling systems.

Request Free Sample

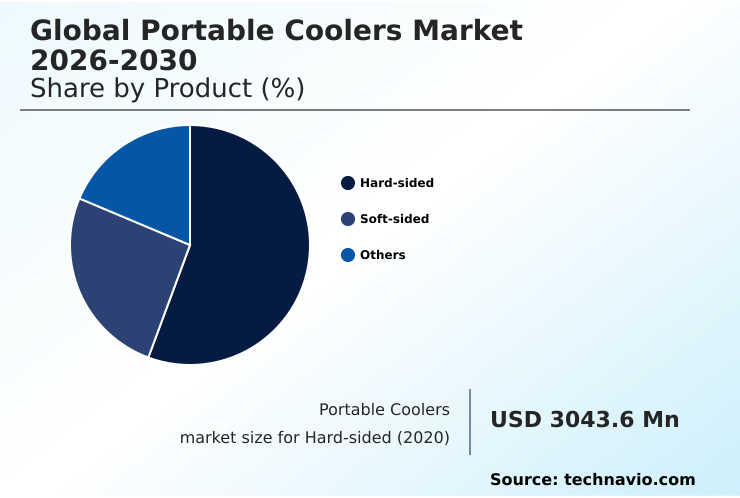
The Hard-sided segment was valued at USD 4.25 billion in 2024 and showed a gradual increase during the forecast period.

Request Free Sample

Regional Analysis

North America is estimated to contribute 42.6% to the growth of the global market during the forecast period.Technavio’s analysts have elaborately explained the regional trends and drivers that shape the market during the forecast period.

See How Portable Coolers Market Demand is Rising in North America Request Free Sample

The geographic landscape is characterized by mature demand in North America, which accounts for over 42% of the market opportunity, driven by a strong culture of outdoor recreational activities.

In Europe, the focus is on vehicle-powered coolers and sustainable product design, with commercial fleets reporting a 12% efficiency gain in last-mile deliveries using active cooling systems.

The APAC region is the fastest-growing, where rising disposable incomes have led to a 20% year-over-year increase in the adoption of coolers for tailgating equipment and picnic and day-use coolers.

Innovations like thermoelectric cooling modules and solar charging capability are gaining traction globally.

Demand in South America and the Middle East is tied to social gatherings and extreme climates, requiring robust cooling performance and ruggedized construction for products used as beach trip essentials or for long-haul trucking refrigeration.

This varied landscape is a key focus for the Global Portable Coolers Market 2026-2030.
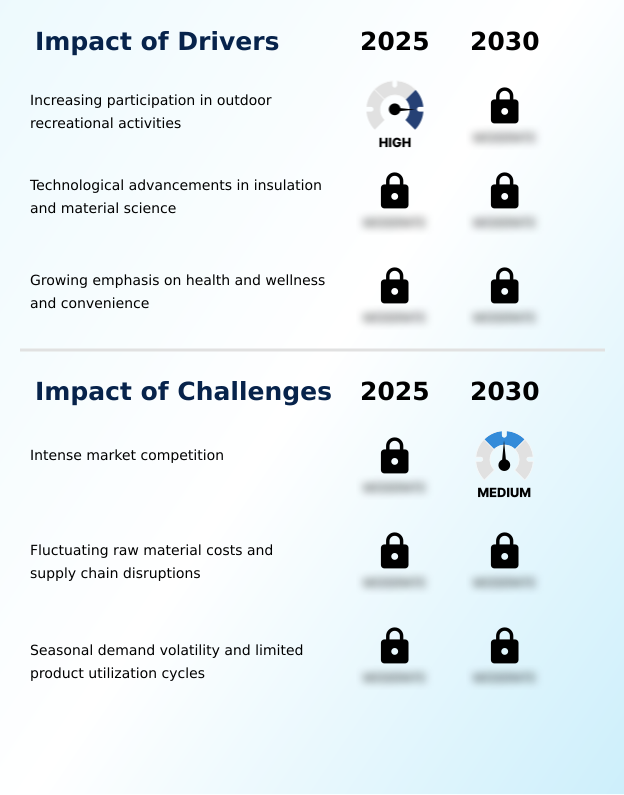
Market Dynamics

Our researchers analyzed the data with 2025 as the base year, along with the key drivers, trends, and challenges. A holistic analysis of drivers will help companies refine their marketing strategies to gain a competitive advantage.

  • Consumers and commercial buyers are increasingly making sophisticated purchasing decisions, asking specific questions like what is the best portable cooler for long camping trips or seeking a detailed electric cooler vs ice chest performance analysis. For recreational users, finding a lightweight backpack cooler for hiking or a portable cooler with wheels for beach is a common goal.
  • The decision often hinges on specific needs, such as the ideal powered cooler for car camping versus a simple soft cooler for daily lunch use. Enthusiasts look for specialized gear, like a marine cooler for saltwater fishing or an efficient thermoelectric cooler for road trips.
  • The interest in advanced features is growing, with searches for a portable cooler with solar charging input becoming more frequent. A key question is finding the best cooler for keeping food frozen, which steers buyers towards high-performance models. In commercial sectors, sourcing a heavy-duty cooler for construction sites or a small portable cooler for medical transport involves different criteria.
  • An operational analysis within a medical logistics firm showed that using validated small portable coolers reduced transport-related temperature deviations by over 90% compared to unspecialized containers. Businesses are also finding a cooler with a USB port for field technicians, while event planners source the best portable coolers for outdoor events.
  • The rise of alternative lifestyles drives searches for the best portable cooler for van life and high capacity coolers for family picnics, while sustainability concerns lead to queries about portable cooler for off-grid living. Finally, buyers are comparing portable cooler insulation types to make informed choices.

What are the key market drivers leading to the rise in the adoption of Portable Coolers Industry?

  • The increasing global participation in outdoor recreational activities serves as a primary driver for the market's growth.

  • Market growth is fundamentally driven by increasing participation in outdoor recreational activities and a rising emphasis on health and convenience.
  • As more consumers seek food and beverage preservation for home-prepped meals, demand grows; users report spending up to 25% less on fast food.
  • Technological advancements are a significant driver, with innovations in polyurethane foam insulation and lightweight cooler materials leading to superior thermal efficiency. These breakthroughs enable longer ice retention capability and greater durability.
  • This directly impacts commercial sectors like medical supply transport and pharmaceutical transport solutions, where new coolers help achieve over 99.9% temperature compliance.
  • This reliability is also crucial for emergency preparedness supplies and remote worksite solutions, making modern coolers essential camping and hiking gear.

What are the market trends shaping the Portable Coolers Industry?

  • A pronounced shift toward premiumization and customization is emerging as a significant market trend. This is driven by consumer demand for higher-performance products with personalized features.

  • Key market trends are centered on premiumization and technological integration. There is a marked shift towards a premium cooler market, where high-performance insulation and ruggedized construction justify higher price points. Consumers engaged in glamping and overlanding increasingly demand customizable cooler options, a strategy that has been shown to boost customer retention rates by 15%.
  • Simultaneously, the integration of smart cooler features is transforming coolers into intelligent devices. This trend is especially impactful in commercial applications; for example, smart coolers used as event catering equipment have demonstrated a reduction in food waste by up to 20% due to precise digital temperature control.
  • The use of active cooling systems and compressor-based cooling is expanding from niche marine-grade coolers to broader consumer use in adventure travel and backyard entertainment.

What challenges does the Portable Coolers Industry face during its growth?

  • Intense market competition, coupled with the difficulty of achieving significant product differentiation, presents a key challenge affecting industry growth.

  • The market faces significant challenges from intense competition and supply chain volatility. With numerous players, achieving meaningful differentiation beyond a UV-resistant exterior or integrated bottle openers is difficult, compelling brands to allocate up to 25% of revenue to marketing. This is particularly true in the crowded tailgating equipment and fishing and hunting coolers segments.
  • Furthermore, fluctuating raw material costs for petrochemicals used in roto-molded construction have increased manufacturing expenses by 10-15% for some firms. These disruptions affect the production of everything from high-denier nylons to the durable outer shell, impacting profitability for providers of construction site coolers and even those in commercial food transport requiring impact resistance.

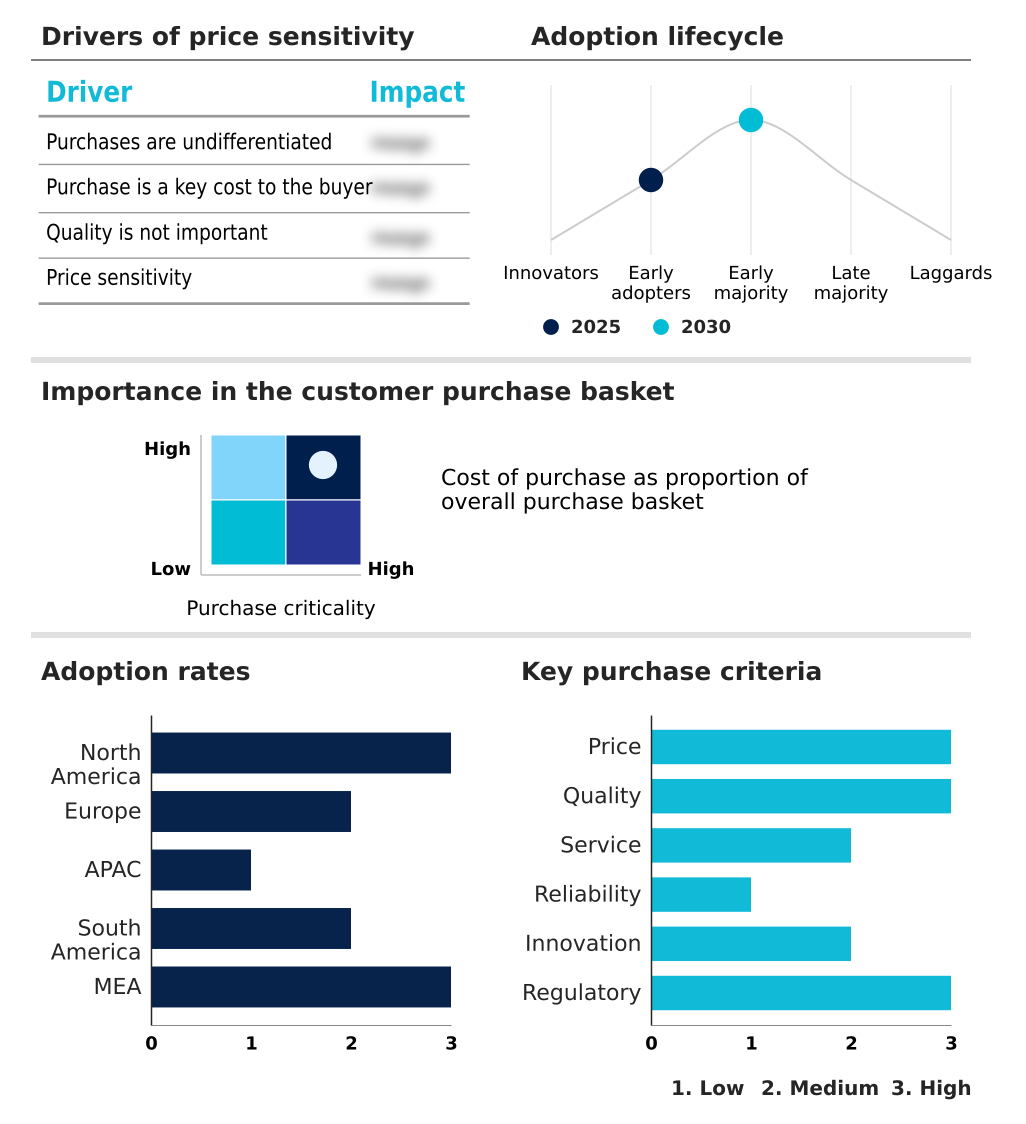
Exclusive Technavio Analysis on Customer Landscape

The portable coolers market forecasting report includes the adoption lifecycle of the market, covering from the innovator’s stage to the laggard’s stage. It focuses on adoption rates in different regions based on penetration. Furthermore, the portable coolers market report also includes key purchase criteria and drivers of price sensitivity to help companies evaluate and develop their market growth analysis strategies.

Customer Landscape of Portable Coolers Industry

Competitive Landscape

Companies are implementing various strategies, such as strategic alliances, portable coolers market forecast, partnerships, mergers and acquisitions, geographical expansion, and product/service launches, to enhance their presence in the industry.

Anker Technology UK Ltd. - A specialized portfolio of advanced electric and passive marine-grade coolers addresses sophisticated mobile refrigeration needs for recreational and professional use.

The industry research and growth report includes detailed analyses of the competitive landscape of the market and information about key companies, including:

  • Anker Technology UK Ltd.
  • AO Coolers
  • Bison Coolers
  • Clara Canyon LLC
  • Cordova Outdoors LLC
  • Dometic Group AB
  • Engel Coolers
  • Grizzly Coolers LLC
  • Indel B S.P.A.
  • K2 COOLERS
  • Koolatron
  • Lifetime Products Inc.
  • Maluna Coolers
  • Newell Brands Inc.
  • Otter Products LLC
  • Pelican Products Inc.
  • Polar Bear Coolers
  • RovR Products Inc.
  • RTIC Outdoors LLC
  • Uber Appliance
  • YETI Holdings Inc.

Qualitative and quantitative analysis of companies has been conducted to help clients understand the wider business environment as well as the strengths and weaknesses of key industry players. Data is qualitatively analyzed to categorize companies as pure play, category-focused, industry-focused, and diversified; it is quantitatively analyzed to categorize companies as dominant, leading, strong, tentative, and weak.

Recent Development and News in Portable coolers market

  • In September 2024, YETI Holdings Inc. announced an expanded range of customizable options and new colorways for its Tundra series, responding to growing consumer demand for personalized high-performance outdoor gear.
  • In November 2024, Dometic Group AB launched a new series of smart electric coolers featuring enhanced battery efficiency and app-based temperature controls, targeting the tech-savvy outdoor enthusiast market.
  • In January 2025, RovR Products Inc. committed to incorporating over 25% recycled materials in its hard-sided cooler shells, addressing the increasing consumer focus on sustainable and eco-friendly products.
  • In March 2025, Newell Brands Inc. announced a strategic partnership to integrate a new lightweight polymer composite into its next-generation coolers, aiming to significantly improve thermal resistance and reduce product weight.

Dive into Technavio’s robust research methodology, blending expert interviews, extensive data synthesis, and validated models for unparalleled Portable Coolers Market insights. See full methodology.

Market Scope
Page number 285
Base year 2025
Historic period 2020-2024
Forecast period 2026-2030
Growth momentum & CAGR Accelerate at a CAGR of 12.1%
Market growth 2026-2030 USD 6604.5 million
Market structure Fragmented
YoY growth 2025-2026(%) 11.1%
Key countries US, Canada, Mexico, Germany, UK, France, Italy, Spain, The Netherlands, China, India, Japan, Australia, South Korea, Indonesia, Brazil, Argentina, Colombia, UAE, Saudi Arabia, South Africa, Egypt and Israel
Competitive landscape Leading Companies, Market Positioning of Companies, Competitive Strategies, and Industry Risks

Request Free Sample

Research Analyst Overview

  • The portable coolers market is advancing beyond simple passive insulation, driven by material science and consumer demand for enhanced performance. Core to this evolution is the use of high-performance insulation materials like polyurethane foam insulation and advanced vacuum insulated panels, with the latter demonstrating up to 30% longer ice retention capability. This improvement in thermal efficiency is critical.
  • Boardroom decisions on product strategy are now closely tied to sustainability, influencing the adoption of eco-friendly insulation and lightweight cooler materials. The manufacturing process itself, particularly precision roto-molding process, creates a durable outer shell with seamless airtight seals for superior cooling performance. Products feature roto-molded construction and ruggedized construction for high impact resistance.
  • Key components include heavy-duty latches, non-slip feet, and effective drain plug systems. Soft-sided models utilize high-denier nylons and thermoplastic polyurethane (TPU) with leak-proof zippers, while hard-sided variants feature antimicrobial liners. The rise of powered cooler technology incorporates active cooling systems such as compressor-based cooling and thermoelectric cooling modules, often with solar charging capability and portable power station compatibility.
  • These smart cooler features include digital temperature control, battery protection systems, and USB charging ports, moving coolers into a new category of intelligent devices with modular interior organization, integrated bottle openers, and UV-resistant exterior. This shift from hard-sided cooler materials and soft-sided cooler fabric to wheeled cooler design with backpack cooler straps shows a focus on user-centric design.

What are the Key Data Covered in this Portable Coolers Market Research and Growth Report?

  • What is the expected growth of the Portable Coolers Market between 2026 and 2030?

    • USD 6.60 billion, at a CAGR of 12.1%

  • What segmentation does the market report cover?

    • The report is segmented by Product (Hard-sided, Soft-sided, and Others), End-user (Residential, and Commercial and government), Distribution Channel (Offline, and Online) and Geography (North America, Europe, APAC, South America, Middle East and Africa)

  • Which regions are analyzed in the report?

    • North America, Europe, APAC, South America and Middle East and Africa

  • What are the key growth drivers and market challenges?

    • Increasing participation in outdoor recreational activities, Intense market competition

  • Who are the major players in the Portable Coolers Market?

    • Anker Technology UK Ltd., AO Coolers, Bison Coolers, Clara Canyon LLC, Cordova Outdoors LLC, Dometic Group AB, Engel Coolers, Grizzly Coolers LLC, Indel B S.P.A., K2 COOLERS, Koolatron, Lifetime Products Inc., Maluna Coolers, Newell Brands Inc., Otter Products LLC, Pelican Products Inc., Polar Bear Coolers, RovR Products Inc., RTIC Outdoors LLC, Uber Appliance and YETI Holdings Inc.

Market Research Insights

  • The market's dynamism is driven by its expanding applications across both consumer and commercial sectors. Increasing participation in outdoor recreational activities and demand for adventure travel gear underpins residential growth. Commercially, the need for reliable mobile refrigeration solutions is critical. For instance, firms leveraging these for cold chain logistics have reported a 15% reduction in spoilage rates.
  • Similarly, the use of specialized construction site coolers has correlated with a 10% improvement in workforce hydration compliance on remote worksite solutions. As event catering equipment and emergency preparedness supplies become more sophisticated, demand for high-performance coolers grows. This extends to medical supply transport and pharmaceutical transport solutions, where temperature integrity is non-negotiable.
  • The market responds with products tailored for glamping accessories, marine-grade coolers, and overlanding gear, reflecting a broad and diversifying user base.

We can help! Our analysts can customize this portable coolers market research report to meet your requirements.

Get in touch

1. Executive Summary

1.1 Market overview

Executive Summary - Chart on Market Overview
Executive Summary - Data Table on Market Overview
Executive Summary - Chart on Global Market Characteristics
Executive Summary - Chart on Market by Geography
Executive Summary - Chart on Market Segmentation by Product
Executive Summary - Chart on Market Segmentation by End-user
Executive Summary - Chart on Market Segmentation by Distribution Channel
Executive Summary - Chart on Incremental Growth
Executive Summary - Data Table on Incremental Growth
Executive Summary - Chart on Company Market Positioning

2. Technavio Analysis

2.1 Analysis of price sensitivity, lifecycle, customer purchase basket, adoption rates, and purchase criteria

2.2 Criticality of inputs and Factors of differentiation

Chart on Overview on criticality of inputs and factors of differentiation

2.3 Factors of disruption

Chart on Overview on factors of disruption

2.4 Impact of drivers and challenges

Chart on Impact of drivers and challenges in 2025 and 2030

3. Market Landscape

3.1 Market ecosystem

Chart on Parent Market
Data Table on - Parent Market

3.2 Market characteristics

Chart on Market characteristics analysis

3.3 Value chain analysis

Chart on Value chain analysis

4. Market Sizing

4.1 Market definition

Data Table on Offerings of companies included in the market definition

4.2 Market segment analysis

Market segments

4.3 Market size 2025

4.4 Market outlook: Forecast for 2025-2030

Chart on Global - Market size and forecast 2025-2030 ($ million)
Data Table on Global - Market size and forecast 2025-2030 ($ million)
Chart on Global Market: Year-over-year growth 2025-2030 (%)
Data Table on Global Market: Year-over-year growth 2025-2030 (%)

5. Historic Market Size

5.1 Global Portable Coolers Market 2020 - 2024

Historic Market Size - Data Table on Global Portable Coolers Market 2020 - 2024 ($ million)

5.2 Product segment analysis 2020 - 2024

Historic Market Size - Product Segment 2020 - 2024 ($ million)

5.3 End-user segment analysis 2020 - 2024

Historic Market Size - End-user Segment 2020 - 2024 ($ million)

5.4 Distribution Channel segment analysis 2020 - 2024

Historic Market Size - Distribution Channel Segment 2020 - 2024 ($ million)

5.5 Geography segment analysis 2020 - 2024

Historic Market Size - Geography Segment 2020 - 2024 ($ million)

5.6 Country segment analysis 2020 - 2024

Historic Market Size - Country Segment 2020 - 2024 ($ million)

6. Qualitative Analysis

6.1 Impact of AI on global portable coolers market

7. Five Forces Analysis

7.1 Five forces summary

Five forces analysis - Comparison between 2025 and 2030

7.2 Bargaining power of buyers

Bargaining power of buyers - Impact of key factors 2025 and 2030

7.3 Bargaining power of suppliers

Bargaining power of suppliers - Impact of key factors in 2025 and 2030

7.4 Threat of new entrants

Threat of new entrants - Impact of key factors in 2025 and 2030

7.5 Threat of substitutes

Threat of substitutes - Impact of key factors in 2025 and 2030

7.6 Threat of rivalry

Threat of rivalry - Impact of key factors in 2025 and 2030

7.7 Market condition

Chart on Market condition - Five forces 2025 and 2030

8. Market Segmentation by Product

8.1 Market segments

Chart on Product - Market share 2025-2030 (%)
Data Table on Product - Market share 2025-2030 (%)

8.2 Comparison by Product

Chart on Comparison by Product
Data Table on Comparison by Product

8.3 Hard-sided - Market size and forecast 2025-2030

Chart on Hard-sided - Market size and forecast 2025-2030 ($ million)
Data Table on Hard-sided - Market size and forecast 2025-2030 ($ million)
Chart on Hard-sided - Year-over-year growth 2025-2030 (%)
Data Table on Hard-sided - Year-over-year growth 2025-2030 (%)

8.4 Soft-sided - Market size and forecast 2025-2030

Chart on Soft-sided - Market size and forecast 2025-2030 ($ million)
Data Table on Soft-sided - Market size and forecast 2025-2030 ($ million)
Chart on Soft-sided - Year-over-year growth 2025-2030 (%)
Data Table on Soft-sided - Year-over-year growth 2025-2030 (%)

8.5 Others - Market size and forecast 2025-2030

Chart on Others - Market size and forecast 2025-2030 ($ million)
Data Table on Others - Market size and forecast 2025-2030 ($ million)
Chart on Others - Year-over-year growth 2025-2030 (%)
Data Table on Others - Year-over-year growth 2025-2030 (%)

8.6 Market opportunity by Product

Market opportunity by Product ($ million)
Data Table on Market opportunity by Product ($ million)

9. Market Segmentation by End-user

9.1 Market segments

Chart on End-user - Market share 2025-2030 (%)
Data Table on End-user - Market share 2025-2030 (%)

9.2 Comparison by End-user

Chart on Comparison by End-user
Data Table on Comparison by End-user

9.3 Residential - Market size and forecast 2025-2030

Chart on Residential - Market size and forecast 2025-2030 ($ million)
Data Table on Residential - Market size and forecast 2025-2030 ($ million)
Chart on Residential - Year-over-year growth 2025-2030 (%)
Data Table on Residential - Year-over-year growth 2025-2030 (%)

9.4 Commercial and government - Market size and forecast 2025-2030

Chart on Commercial and government - Market size and forecast 2025-2030 ($ million)
Data Table on Commercial and government - Market size and forecast 2025-2030 ($ million)
Chart on Commercial and government - Year-over-year growth 2025-2030 (%)
Data Table on Commercial and government - Year-over-year growth 2025-2030 (%)

9.5 Market opportunity by End-user

Market opportunity by End-user ($ million)
Data Table on Market opportunity by End-user ($ million)

10. Market Segmentation by Distribution Channel

10.1 Market segments

Chart on Distribution Channel - Market share 2025-2030 (%)
Data Table on Distribution Channel - Market share 2025-2030 (%)

10.2 Comparison by Distribution Channel

Chart on Comparison by Distribution Channel
Data Table on Comparison by Distribution Channel

10.3 Offline - Market size and forecast 2025-2030

Chart on Offline - Market size and forecast 2025-2030 ($ million)
Data Table on Offline - Market size and forecast 2025-2030 ($ million)
Chart on Offline - Year-over-year growth 2025-2030 (%)
Data Table on Offline - Year-over-year growth 2025-2030 (%)

10.4 Online - Market size and forecast 2025-2030

Chart on Online - Market size and forecast 2025-2030 ($ million)
Data Table on Online - Market size and forecast 2025-2030 ($ million)
Chart on Online - Year-over-year growth 2025-2030 (%)
Data Table on Online - Year-over-year growth 2025-2030 (%)

10.5 Market opportunity by Distribution Channel

Market opportunity by Distribution Channel ($ million)
Data Table on Market opportunity by Distribution Channel ($ million)

11. Customer Landscape

11.1 Customer landscape overview

Analysis of price sensitivity, lifecycle, customer purchase basket, adoption rates, and purchase criteria

12. Geographic Landscape

12.1 Geographic segmentation

Chart on Market share by geography 2025-2030 (%)
Data Table on Market share by geography 2025-2030 (%)

12.2 Geographic comparison

Chart on Geographic comparison
Data Table on Geographic comparison

12.3 North America - Market size and forecast 2025-2030

Chart on North America - Market size and forecast 2025-2030 ($ million)
Data Table on North America - Market size and forecast 2025-2030 ($ million)
Chart on North America - Year-over-year growth 2025-2030 (%)
Data Table on North America - Year-over-year growth 2025-2030 (%)
Chart on Regional Comparison - North America
Data Table on Regional Comparison - North America

12.3.1 US - Market size and forecast 2025-2030

Chart on US - Market size and forecast 2025-2030 ($ million)
Data Table on US - Market size and forecast 2025-2030 ($ million)
Chart on US - Year-over-year growth 2025-2030 (%)
Data Table on US - Year-over-year growth 2025-2030 (%)

12.3.2 Canada - Market size and forecast 2025-2030

Chart on Canada - Market size and forecast 2025-2030 ($ million)
Data Table on Canada - Market size and forecast 2025-2030 ($ million)
Chart on Canada - Year-over-year growth 2025-2030 (%)
Data Table on Canada - Year-over-year growth 2025-2030 (%)

12.3.3 Mexico - Market size and forecast 2025-2030

Chart on Mexico - Market size and forecast 2025-2030 ($ million)
Data Table on Mexico - Market size and forecast 2025-2030 ($ million)
Chart on Mexico - Year-over-year growth 2025-2030 (%)
Data Table on Mexico - Year-over-year growth 2025-2030 (%)

12.4 Europe - Market size and forecast 2025-2030

Chart on Europe - Market size and forecast 2025-2030 ($ million)
Data Table on Europe - Market size and forecast 2025-2030 ($ million)
Chart on Europe - Year-over-year growth 2025-2030 (%)
Data Table on Europe - Year-over-year growth 2025-2030 (%)
Chart on Regional Comparison - Europe
Data Table on Regional Comparison - Europe

12.4.1 Germany - Market size and forecast 2025-2030

Chart on Germany - Market size and forecast 2025-2030 ($ million)
Data Table on Germany - Market size and forecast 2025-2030 ($ million)
Chart on Germany - Year-over-year growth 2025-2030 (%)
Data Table on Germany - Year-over-year growth 2025-2030 (%)

12.4.2 UK - Market size and forecast 2025-2030

Chart on UK - Market size and forecast 2025-2030 ($ million)
Data Table on UK - Market size and forecast 2025-2030 ($ million)
Chart on UK - Year-over-year growth 2025-2030 (%)
Data Table on UK - Year-over-year growth 2025-2030 (%)

12.4.3 France - Market size and forecast 2025-2030

Chart on France - Market size and forecast 2025-2030 ($ million)
Data Table on France - Market size and forecast 2025-2030 ($ million)
Chart on France - Year-over-year growth 2025-2030 (%)
Data Table on France - Year-over-year growth 2025-2030 (%)

12.4.4 Italy - Market size and forecast 2025-2030

Chart on Italy - Market size and forecast 2025-2030 ($ million)
Data Table on Italy - Market size and forecast 2025-2030 ($ million)
Chart on Italy - Year-over-year growth 2025-2030 (%)
Data Table on Italy - Year-over-year growth 2025-2030 (%)

12.4.5 Spain - Market size and forecast 2025-2030

Chart on Spain - Market size and forecast 2025-2030 ($ million)
Data Table on Spain - Market size and forecast 2025-2030 ($ million)
Chart on Spain - Year-over-year growth 2025-2030 (%)
Data Table on Spain - Year-over-year growth 2025-2030 (%)

12.4.6 The Netherlands - Market size and forecast 2025-2030

Chart on The Netherlands - Market size and forecast 2025-2030 ($ million)
Data Table on The Netherlands - Market size and forecast 2025-2030 ($ million)
Chart on The Netherlands - Year-over-year growth 2025-2030 (%)
Data Table on The Netherlands - Year-over-year growth 2025-2030 (%)

12.5 APAC - Market size and forecast 2025-2030

Chart on APAC - Market size and forecast 2025-2030 ($ million)
Data Table on APAC - Market size and forecast 2025-2030 ($ million)
Chart on APAC - Year-over-year growth 2025-2030 (%)
Data Table on APAC - Year-over-year growth 2025-2030 (%)
Chart on Regional Comparison - APAC
Data Table on Regional Comparison - APAC

12.5.1 China - Market size and forecast 2025-2030

Chart on China - Market size and forecast 2025-2030 ($ million)
Data Table on China - Market size and forecast 2025-2030 ($ million)
Chart on China - Year-over-year growth 2025-2030 (%)
Data Table on China - Year-over-year growth 2025-2030 (%)

12.5.2 India - Market size and forecast 2025-2030

Chart on India - Market size and forecast 2025-2030 ($ million)
Data Table on India - Market size and forecast 2025-2030 ($ million)
Chart on India - Year-over-year growth 2025-2030 (%)
Data Table on India - Year-over-year growth 2025-2030 (%)

12.5.3 Japan - Market size and forecast 2025-2030

Chart on Japan - Market size and forecast 2025-2030 ($ million)
Data Table on Japan - Market size and forecast 2025-2030 ($ million)
Chart on Japan - Year-over-year growth 2025-2030 (%)
Data Table on Japan - Year-over-year growth 2025-2030 (%)

12.5.4 Australia - Market size and forecast 2025-2030

Chart on Australia - Market size and forecast 2025-2030 ($ million)
Data Table on Australia - Market size and forecast 2025-2030 ($ million)
Chart on Australia - Year-over-year growth 2025-2030 (%)
Data Table on Australia - Year-over-year growth 2025-2030 (%)

12.5.5 South Korea - Market size and forecast 2025-2030

Chart on South Korea - Market size and forecast 2025-2030 ($ million)
Data Table on South Korea - Market size and forecast 2025-2030 ($ million)
Chart on South Korea - Year-over-year growth 2025-2030 (%)
Data Table on South Korea - Year-over-year growth 2025-2030 (%)

12.5.6 Indonesia - Market size and forecast 2025-2030

Chart on Indonesia - Market size and forecast 2025-2030 ($ million)
Data Table on Indonesia - Market size and forecast 2025-2030 ($ million)
Chart on Indonesia - Year-over-year growth 2025-2030 (%)
Data Table on Indonesia - Year-over-year growth 2025-2030 (%)

12.6 South America - Market size and forecast 2025-2030

Chart on South America - Market size and forecast 2025-2030 ($ million)
Data Table on South America - Market size and forecast 2025-2030 ($ million)
Chart on South America - Year-over-year growth 2025-2030 (%)
Data Table on South America - Year-over-year growth 2025-2030 (%)
Chart on Regional Comparison - South America
Data Table on Regional Comparison - South America

12.6.1 Brazil - Market size and forecast 2025-2030

Chart on Brazil - Market size and forecast 2025-2030 ($ million)
Data Table on Brazil - Market size and forecast 2025-2030 ($ million)
Chart on Brazil - Year-over-year growth 2025-2030 (%)
Data Table on Brazil - Year-over-year growth 2025-2030 (%)

12.6.2 Argentina - Market size and forecast 2025-2030

Chart on Argentina - Market size and forecast 2025-2030 ($ million)
Data Table on Argentina - Market size and forecast 2025-2030 ($ million)
Chart on Argentina - Year-over-year growth 2025-2030 (%)
Data Table on Argentina - Year-over-year growth 2025-2030 (%)

12.6.3 Colombia - Market size and forecast 2025-2030

Chart on Colombia - Market size and forecast 2025-2030 ($ million)
Data Table on Colombia - Market size and forecast 2025-2030 ($ million)
Chart on Colombia - Year-over-year growth 2025-2030 (%)
Data Table on Colombia - Year-over-year growth 2025-2030 (%)

12.7 Middle East and Africa - Market size and forecast 2025-2030

Chart on Middle East and Africa - Market size and forecast 2025-2030 ($ million)
Data Table on Middle East and Africa - Market size and forecast 2025-2030 ($ million)
Chart on Middle East and Africa - Year-over-year growth 2025-2030 (%)
Data Table on Middle East and Africa - Year-over-year growth 2025-2030 (%)
Chart on Regional Comparison - Middle East and Africa
Data Table on Regional Comparison - Middle East and Africa

12.7.1 UAE - Market size and forecast 2025-2030

Chart on UAE - Market size and forecast 2025-2030 ($ million)
Data Table on UAE - Market size and forecast 2025-2030 ($ million)
Chart on UAE - Year-over-year growth 2025-2030 (%)
Data Table on UAE - Year-over-year growth 2025-2030 (%)

12.7.2 Saudi Arabia - Market size and forecast 2025-2030

Chart on Saudi Arabia - Market size and forecast 2025-2030 ($ million)
Data Table on Saudi Arabia - Market size and forecast 2025-2030 ($ million)
Chart on Saudi Arabia - Year-over-year growth 2025-2030 (%)
Data Table on Saudi Arabia - Year-over-year growth 2025-2030 (%)

12.7.3 South Africa - Market size and forecast 2025-2030

Chart on South Africa - Market size and forecast 2025-2030 ($ million)
Data Table on South Africa - Market size and forecast 2025-2030 ($ million)
Chart on South Africa - Year-over-year growth 2025-2030 (%)
Data Table on South Africa - Year-over-year growth 2025-2030 (%)

12.7.4 Egypt - Market size and forecast 2025-2030

Chart on Egypt - Market size and forecast 2025-2030 ($ million)
Data Table on Egypt - Market size and forecast 2025-2030 ($ million)
Chart on Egypt - Year-over-year growth 2025-2030 (%)
Data Table on Egypt - Year-over-year growth 2025-2030 (%)

12.7.5 Israel - Market size and forecast 2025-2030

Chart on Israel - Market size and forecast 2025-2030 ($ million)
Data Table on Israel - Market size and forecast 2025-2030 ($ million)
Chart on Israel - Year-over-year growth 2025-2030 (%)
Data Table on Israel - Year-over-year growth 2025-2030 (%)

12.8 Market opportunity by geography

Market opportunity by geography ($ million)
Data Tables on Market opportunity by geography ($ million)

13. Drivers, Challenges, and Opportunity

13.1 Market drivers

Increasing participation in outdoor recreational activities
Technological advancements in insulation and material science
Growing emphasis on health and wellness and convenience

13.2 Market challenges

Intense market competition
Fluctuating raw material costs and supply chain disruptions
Seasonal demand volatility and limited product utilization cycles

13.3 Impact of drivers and challenges

Impact of drivers and challenges in 2025 and 2030

13.4 Market opportunities

Premiumization and customization
Integration of smart features and advanced technologies
Growing emphasis on sustainability and eco-conscious designs

14. Competitive Landscape

14.1 Overview

14.2

Overview on criticality of inputs and factors of differentiation

14.3 Landscape disruption

Overview on factors of disruption

14.4 Industry risks

Impact of key risks on business

15. Competitive Analysis

15.1 Companies profiled

Companies covered

15.2 Company ranking index

15.3 Market positioning of companies

Matrix on companies position and classification

15.4 Anker Technology UK Ltd.

Anker Technology UK Ltd. - Overview
Anker Technology UK Ltd. - Product / Service
Anker Technology UK Ltd. - Key offerings
SWOT

15.5 AO Coolers

AO Coolers - Overview
AO Coolers - Product / Service
AO Coolers - Key offerings
SWOT

15.6 Clara Canyon LLC

Clara Canyon LLC - Overview
Clara Canyon LLC - Product / Service
Clara Canyon LLC - Key offerings
SWOT

15.7 Dometic Group AB

Dometic Group AB - Overview
Dometic Group AB - Business segments
Dometic Group AB - Key news
Dometic Group AB - Key offerings
Dometic Group AB - Segment focus
SWOT

15.8 Engel Coolers

Engel Coolers - Overview
Engel Coolers - Product / Service
Engel Coolers - Key offerings
SWOT

15.9 Grizzly Coolers LLC

Grizzly Coolers LLC - Overview
Grizzly Coolers LLC - Product / Service
Grizzly Coolers LLC - Key offerings
SWOT

15.10 K2 COOLERS

K2 COOLERS - Overview
K2 COOLERS - Product / Service
K2 COOLERS - Key offerings
SWOT

15.11 Koolatron

Koolatron - Overview
Koolatron - Product / Service
Koolatron - Key offerings
SWOT

15.12 Lifetime Products Inc.

Lifetime Products Inc. - Overview
Lifetime Products Inc. - Product / Service
Lifetime Products Inc. - Key offerings
SWOT

15.13 Newell Brands Inc.

Newell Brands Inc. - Overview
Newell Brands Inc. - Business segments
Newell Brands Inc. - Key offerings
Newell Brands Inc. - Segment focus
SWOT

15.14 Otter Products LLC

Otter Products LLC - Overview
Otter Products LLC - Product / Service
Otter Products LLC - Key offerings
SWOT

15.15 Pelican Products Inc.

Pelican Products Inc. - Overview
Pelican Products Inc. - Product / Service
Pelican Products Inc. - Key offerings
SWOT

15.16 RovR Products Inc.

RovR Products Inc. - Overview
RovR Products Inc. - Product / Service
RovR Products Inc. - Key offerings
SWOT

15.17 RTIC Outdoors LLC

RTIC Outdoors LLC - Overview
RTIC Outdoors LLC - Product / Service
RTIC Outdoors LLC - Key offerings
SWOT

15.18 YETI Holdings Inc.

YETI Holdings Inc. - Overview
YETI Holdings Inc. - Product / Service
YETI Holdings Inc. - Key offerings
SWOT

16. Appendix

16.1 Scope of the report

Market definition
Objectives
Notes and caveats

16.2 Inclusions and exclusions checklist

Inclusions checklist
Exclusions checklist

16.3 Currency conversion rates for US$

16.4 Research methodology

16.5 Data procurement

Information sources

16.6 Data validation

16.7 Validation techniques employed for market sizing

16.8 Data synthesis

16.9 360 degree market analysis

16.10 List of abbreviations

Research Methodology

Technavio presents a detailed picture of the market by way of study, synthesis, and summation of data from multiple sources. The analysts have presented the various facets of the market with a particular focus on identifying the key industry influencers. The data thus presented is comprehensive, reliable, and the result of extensive research, both primary and secondary.

INFORMATION SOURCES

Primary sources

  • Manufacturers and suppliers
  • Channel partners
  • Industry experts
  • Strategic decision makers

Secondary sources

  • Industry journals and periodicals
  • Government data
  • Financial reports of key industry players
  • Historical data
  • Press releases

DATA ANALYSIS

Data Synthesis

  • Collation of data
  • Estimation of key figures
  • Analysis of derived insights

Data Validation

  • Triangulation with data models
  • Reference against proprietary databases
  • Corroboration with industry experts

REPORT WRITING

Qualitative

  • Market drivers
  • Market challenges
  • Market trends
  • Five forces analysis

Quantitative

  • Market size and forecast
  • Market segmentation
  • Geographical insights
  • Competitive landscape

Interested in this report?

Get your sample now to see our research methodology and insights!

Download Now

Frequently Asked Questions

Portable Coolers market growth will increase by USD 6604.5 million during 2026-2030 .

The Portable Coolers market is expected to grow at a CAGR of 12.1% during 2026-2030 .

Portable Coolers market is segmented by Product (Hard-sided, Soft-sided, Others) End-user (Residential, Commercial and government) Distribution channel (Offline, Online)

Anker Technology UK Ltd., AO Coolers, Bison Coolers, Clara Canyon LLC, Cordova Outdoors LLC, Dometic Group AB, Engel Coolers, Grizzly Coolers LLC, Indel B S.P.A., K2 COOLERS, Koolatron, Lifetime Products Inc., Maluna Coolers, Newell Brands Inc., Otter Products LLC, Pelican Products Inc., Polar Bear Coolers, RovR Products Inc., RTIC Outdoors LLC, Uber Appliance, YETI Holdings Inc. are a few of the key vendors in the Portable Coolers market.

North America will register the highest growth rate of 42.6% among the other regions. Therefore, the Portable Coolers market in North America is expected to garner significant business opportunities for the vendors during the forecast period.

US, Canada, Mexico, Germany, UK, France, Italy, Spain, The Netherlands, China, India, Japan, Australia, South Korea, Indonesia, Brazil, Argentina, Colombia, UAE, Saudi Arabia, South Africa, Egypt, Israel

  • Increasing participation in outdoor recreational activities is the driving factor this market.

The Portable Coolers market vendors should focus on grabbing business opportunities from the Product segment as it accounted for the largest market share in the base year.