Poufs Market Analysis North America, Europe, APAC, Middle East and Africa, South America - US, Canada, China, Germany, UK - Size and Forecast 2024-2028

Poufs Market Analysis North America, Europe, APAC, Middle East and Africa, South America - US, Canada, China, Germany, UK - Size and Forecast 2024-2028

Published: Jan 2024 161 Pages SKU: IRTNTR77312

Market Overview at a Glance

$150.55 Mn
Market Opportunity
4.19%
CAGR
3.9
YoY growth 2023-2024(%)

Poufs Market Size 2024-2028

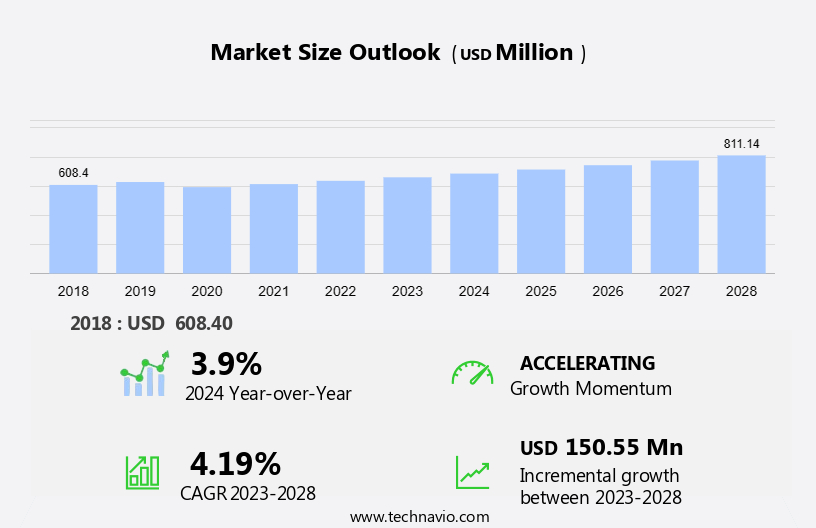
The poufs market size is forecast to increase by USD 150.55 million at a CAGR of 4.19% between 2023 and 2028.

  • The market is experiencing significant growth due to the increase in residential and commercial construction projects. This trend is driven by the rising demand for comfortable and stylish seating solutions in various sectors. Additionally, the development of eco-friendly poufs, which are made from sustainable materials, is gaining popularity among consumers. The market is expanding as their versatility makes them a popular choice in both construction projects and home decor, adding functional and stylish elements to modern interiors. However, the market is also facing challenges, such as the high volatility in raw material prices, which can impact the profitability of poufs manufacturers. Despite these challenges, the market is expected to continue its growth trajectory, driven by the increasing demand for poufs in various applications. The market analysis report provides a comprehensive study of these trends and growth factors, offering valuable insights for stakeholders In the poufs industry.

What will be the Size of the Poufs Market During the Forecast Period?

Poufs Market Size

 Request Free Sample

  • The market encompasses a diverse range of versatile seating solutions, including those made of fabric, metal, and wooden materials. This market has experienced significant growth due to its advanced versatility, catering to various applications in both residential and commercial settings. The latest trends reflect an increase In the variety of poufs, with designs that seamlessly blend into family rooms, offices, and public spaces.
  • Driving factors include the infrastructure development in various industries and the demand for functional yet aesthetically pleasing seating options. The cost-effective nature of poufs, combined with their ability to accommodate multiple functions, makes them an attractive choice for consumers and businesses alike. Overall, the market is poised for continued expansion, offering numerous opportunities for innovation and growth.

How is this Poufs Industry segmented and which is the largest segment?

The poufs industry research report provides comprehensive data (region-wise segment analysis), with forecasts and estimates in "USD million" for the period 2024-2028, as well as historical data from 2018-2022 for the following segments.

  • Distribution Channel
    • Offline
    • Online
  • Application
    • Residential
    • Commercial
  • Geography
    • North America
      • Canada
      • US
    • Europe
      • Germany
      • UK
    • APAC
      • China
    • Middle East and Africa
    • South America

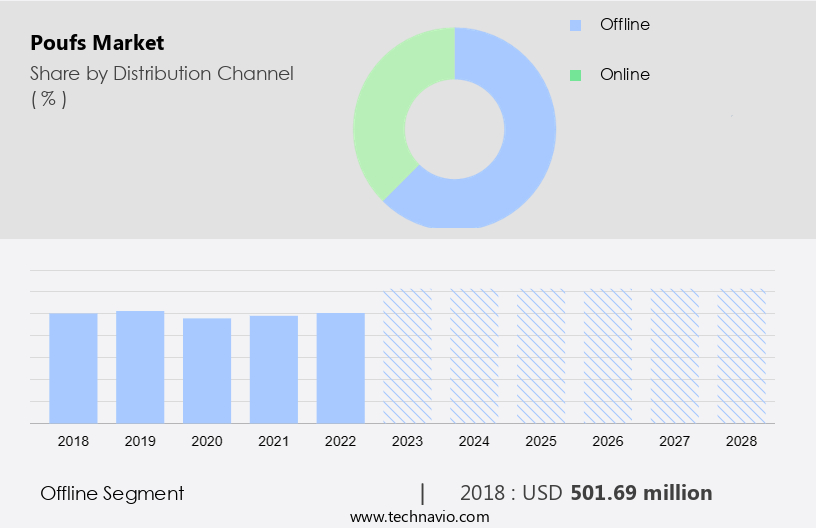
By Distribution Channel Insights

  • The offline segment is estimated to witness significant growth during the forecast period.

The market exhibits significant growth due to various driving factors, including the increasing demand for advanced versatility and comfort in furniture. The market caters to diverse segments, including family, office, and driving, among others. The fabric, metal, and wooden poufs are popular choices based on material preference. The infrastructure development in commercial areas and increasing government spending on public spaces further boost the market growth. The market offers an extensive variety of poufs, enabling consumers to choose according to their specific needs and preferences. Companies have adopted various strategies, such as cost reduction and product pricing, to cater to the price-sensitive consumer base.

Intermediaries play a crucial role In the distribution network, ensuring the availability of poufs in various retail channels. Despite the challenges posed by the shutdown of industries, the market is expected to continue its positive growth trajectory.

Poufs Market Size

Get a glance at the Poufs Industry report of share of various segments Request Free Sample

The offline segment was valued at USD 501.69 million in 2018 and showed a gradual increase during the forecast period.
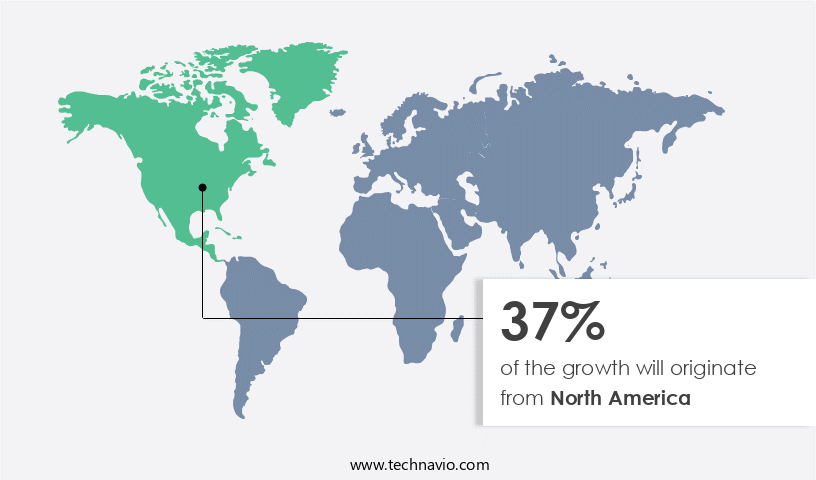
Regional Analysis

  • North America is estimated to contribute 37% to the growth of the global market during the forecast period.

Technavio's analysts have elaborately explained the regional trends and drivers that shape the market during the forecast period.

Poufs Market Share by Geography

For more insights on the market share of various regions, Request Free Sample

The market in North America is experiencing growth due to the expanding residential and commercial construction sectors. The US and Canada are major importers of poufs In the region, with the demand for office furniture and luxury poufs being key growth drivers. The real estate and commercial leasing industries have seen significant expansion, leading to an increase in commercial properties and the subsequent sale of office furniture, including poufs. The strong economy and the shift towards modern workspaces are compelling companies to invest in advanced and versatile furniture solutions in North America. Infrastructure development and government spending on commercial projects further boost the market. Cost-effective pricing and the involvement of intermediaries also contribute to the market's growth. The market in North America is poised for continued expansion In the coming years.

Market Dynamics

Our researchers analyzed the data with 2023 as the base year, along with the key drivers, trends, and challenges. A holistic analysis of drivers will help companies refine their marketing strategies to gain a competitive advantage.

What are the key market drivers leading to the rise In the adoption of Poufs Industry?

An increase in residential and commercial construction is the key driver of the market.

  • The market is experiencing significant growth due to the expansion of the real estate sector and the rise in residential and commercial construction projects worldwide. In developed economies, such as the US, substantial investments in infrastructure development are anticipated, fueling the demand for furniture products, including poufs. In emerging economies like India, the potential for 100% Foreign Direct Investment (FDI) in townships and settlement projects is projected to boost the demand for furniture during the forecast period. Government initiatives such as the Smart Cities Mission, Pradhan Mantri Awas Yojana (PMAY), and the Sardar Patel National Urban Housing Mission are estimated to increase urban population growth, which will be a crucial factor driving market expansion.
  • The market dynamics include the use of various materials, such as fabric, metal, and wooden poufs, advanced versatility, and an increase in variety to cater to diverse customer preferences. Cost remains a significant factor, with commercial development and product pricing influencing market growth. Intermediaries play a vital role In the supply chain, ensuring the smooth distribution of poufs to consumers. Government spending on urban infrastructure and housing projects is expected to bring about positive changes for the market.

What are the market trends shaping the Poufs Industry?

The development of environment-friendly poufs is the upcoming market trend.

  • The market is experiencing significant shifts due to increasing environmental concerns and the drive for advanced versatility. Traditional poufs, often made from foam and either metal or wooden frames, are being replaced with eco-friendly alternatives. These new poufs are manufactured using fabric derived from recycled materials, such as sailcloth, esparto grass, and cypress wood. Moreover, regenerated fiberfill and soy-based foam made from recycled plastic waste are gaining popularity. The soy-based foam offers the same retention rate as traditional foam, making it an acceptable alternative among pouf companies. This shift towards sustainable materials is driven by the need to reduce the environmental impact of the industry and the energy required for manufacturing foam.
  • The infrastructure development and commercial growth in various sectors, including offices and families, are key factors fueling the increase in variety and demand for these eco-friendly poufs. Government spending on green initiatives and the cost savings associated with using recycled materials further contribute to the positive changes In the market.

What challenges does the Poufs Industry face during its growth?

High volatility in raw material prices of poufs is a key challenge affecting the industry growth.

  • The market is currently experiencing increased costs for raw materials, including wood, metal, and fabric. Prices for chipboard, timber, foam, polish chemical materials, color paints, hardware, and other essential components have risen significantly. The volatility of input and transportation costs, coupled with decreased production capacities among pouf manufacturers, has led to a narrowing gap between production costs and companies' ability to increase product prices. This market dynamic poses a challenge for companies, as they strive to maintain profitability amidst these rising costs. The infrastructure required for commercial development of poufs, such as machinery and labor, also adds to the overall expense.
  • Government spending and the increase in variety and advanced versatility of poufs are driving factors for growth In the market. Intermediaries play a crucial role In the supply chain, but their involvement can add to the cost of production and distribution. Despite these challenges, the market continues to show positive changes, offering opportunities for companies to innovate and adapt to the changing market landscape.

Exclusive Customer Landscape

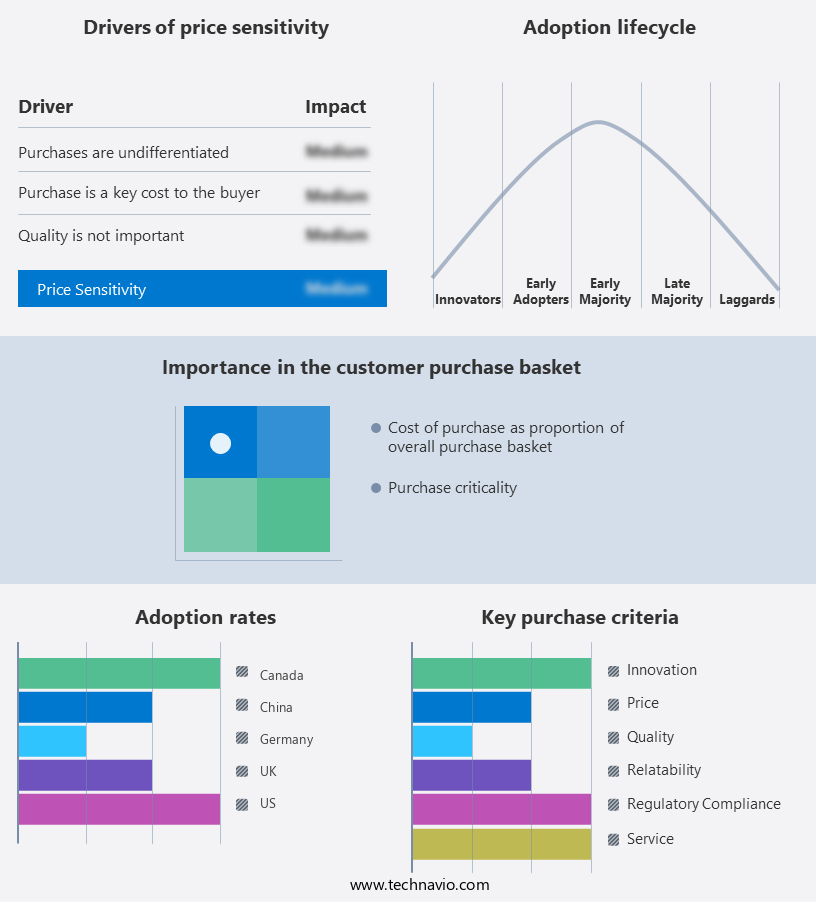
The market forecasting report includes the adoption lifecycle of the market, covering from the innovator's stage to the laggard's stage. It focuses on adoption rates in different regions based on penetration. Furthermore, the market report also includes key purchase criteria and drivers of price sensitivity to help companies evaluate and develop their market growth analysis strategies.

Poufs Market Share by Geography

 Customer Landscape

Key Companies & Market Insights

Companies are implementing various strategies, such as strategic alliances, poufs market forecast, partnerships, mergers and acquisitions, geographical expansion, and product/service launches, to enhance their presence In the industry.

The industry research and growth report includes detailed analyses of the competitive landscape of the market and information about key companies, including:

  • Abbyson Living LLC
  • Artisanal Abode
  • Ashley Global Retail LLC
  • Century Furniture LLC
  • Dunns Furniture
  • Ethan Allen Interiors Inc.
  • FurnitureRoots
  • Giessegi Industria Mobili Spa
  • Godrej and Boyce Manufacturing Co. Ltd.
  • HNI Corp.
  • hulsta werke Huls GmbH and Co. KG
  • Inter IKEA Holding BV
  • LaZBoy Inc.
  • MillerKnoll Inc.
  • Nitori Holdings Co. Ltd.
  • Restoration Hardware Inc.
  • ROCHE BOBOIS SA
  • Roomstogo.com Inc.
  • Steelcase Inc.
  • Wayfair Inc.

Qualitative and quantitative analysis of companies has been conducted to help clients understand the wider business environment as well as the strengths and weaknesses of key industry players. Data is qualitatively analyzed to categorize companies as pure play, category-focused, industry-focused, and diversified; it is quantitatively analyzed to categorize companies as dominant, leading, strong, tentative, and weak.

Research Analyst Overview

The market has experienced significant growth in recent years, driven by various factors that have influenced its advanced versatility and increased variety. One of the primary driving forces behind this expansion has been the infrastructure development in both residential and commercial sectors. In the family setting, poufs have emerged as a popular alternative to traditional seating options due to their compact size and multifunctional capabilities. These flexible pieces of furniture can serve as footrests, additional seating, or even as a storage solution, making them an essential addition to modern homes. Simultaneously, In the office environment, poufs have gained traction as an innovative solution for creating collaborative and flexible workspaces.

Moreover, their compact design allows for easy rearrangement, making them an ideal choice for open-plan offices and meeting areas. The increase in variety within the market can be attributed to the evolution of materials used in their production, along with the rise of e-commerce platforms and the growing demand for charcoal products. While traditional poufs were often made of fabric, recent advancements have led to the emergence of metal and wooden options. Each material offers unique benefits, with metal poufs providing a modern and sleek look, while wooden poufs add a touch of warmth and natural elegance. Cost has also played a significant role In the growth of the market. With their affordability, poufs have become an accessible furniture option for both homeowners and businesses, allowing them to enhance their spaces without breaking the bank.

Furthermore, intermediaries, such as retailers and distributors, have played a crucial role in the commercial development of the market. These entities have facilitated the distribution of poufs to various markets, enabling widespread access and adoption. Government spending on infrastructure projects and public spaces has further fueled the demand for poufs. These investments have led to the creation of new parks, plazas, and public spaces, which in turn have increased the need for versatile and affordable seating solutions like poufs. Despite the positive changes In the market, product pricing remains a critical factor influencing its growth. Producers and retailers must have a balance between maintaining competitive pricing and ensuring profitability, as price sensitivity remains a significant concern for consumers.

Market Scope

Report Coverage

Details

Page number

161

Base year

2023

Historic period

2018-2022

Forecast period

2024-2028

Growth momentum & CAGR

Accelerate at a CAGR of 4.19%

Market Growth 2024-2028

USD 150.55 million

Market structure

Fragmented

YoY growth 2023-2024(%)

3.9

Key countries

US, Canada, China, Germany, and UK

Competitive landscape

Leading Companies, Market Positioning of Companies, Competitive Strategies, and Industry Risks

Request Free Sample

What are the Key Data Covered in this Poufs Market Research and Growth Report?

  • CAGR of the Poufs industry during the forecast period
  • Detailed information on factors that will drive the market growth and forecasting between 2024 and 2028
  • Precise estimation of the size of the market and its contribution of the industry in focus to the parent market
  • Accurate predictions about upcoming growth and trends and changes in consumer behaviour
  • Growth of the market across North America, Europe, APAC, Middle East and Africa, and South America
  • Thorough analysis of the market's competitive landscape and detailed information about companies
  • Comprehensive analysis of factors that will challenge the poufs market growth of industry companies

We can help! Our analysts can customize this poufs market research report to meet your requirements.

Get in touch

1 Executive Summary

  • 1.1 Market overview
    • Exhibit 01: Executive Summary – Chart on Market Overview
    • Exhibit 02: Executive Summary – Data Table on Market Overview
    • Exhibit 03: Executive Summary – Chart on Global Market Characteristics
    • Exhibit 04: Executive Summary – Chart on Market by Geography
    • Exhibit 05: Executive Summary – Chart on Market Segmentation by Distribution Channel
    • Exhibit 06: Executive Summary – Chart on Market Segmentation by Application
    • Exhibit 07: Executive Summary – Chart on Incremental Growth
    • Exhibit 08: Executive Summary – Data Table on Incremental Growth
    • Exhibit 09: Executive Summary – Chart on Vendor Market Positioning

2 Market Landscape

  • 2.1 Market ecosystem
    • Exhibit 10: Parent market
    • Exhibit 11: Market Characteristics

3 Market Sizing

  • 3.1 Market definition
    • Exhibit 12: Offerings of vendors included in the market definition
  • 3.2 Market segment analysis
    • Exhibit 13: Market segments
  • 3.3 Market size 2023
    • 3.4 Market outlook: Forecast for 2023-2028
      • Exhibit 14: Chart on Global - Market size and forecast 2023-2028 ($ million)
      • Exhibit 15: Data Table on Global - Market size and forecast 2023-2028 ($ million)
      • Exhibit 16: Chart on Global Market: Year-over-year growth 2023-2028 (%)
      • Exhibit 17: Data Table on Global Market: Year-over-year growth 2023-2028 (%)

    4 Historic Market Size

    • 4.1 Global poufs market 2018 - 2022
      • Exhibit 18: Historic Market Size – Data Table on global poufs market 2018 - 2022 ($ million)
    • 4.2 Distribution Channel Segment Analysis 2018 - 2022
      • Exhibit 19: Historic Market Size – Distribution Channel Segment 2018 - 2022 ($ million)
    • 4.3 Application Segment Analysis 2018 - 2022
      • Exhibit 20: Historic Market Size – Application Segment 2018 - 2022 ($ million)
    • 4.4 Geography Segment Analysis 2018 - 2022
      • Exhibit 21: Historic Market Size – Geography Segment 2018 - 2022 ($ million)
    • 4.5 Country Segment Analysis 2018 - 2022
      • Exhibit 22: Historic Market Size – Country Segment 2018 - 2022 ($ million)

    5 Five Forces Analysis

    • 5.1 Five forces summary
      • Exhibit 23: Five forces analysis - Comparison between 2023 and 2028
    • 5.2 Bargaining power of buyers
      • Exhibit 24: Chart on Bargaining power of buyers – Impact of key factors 2023 and 2028
    • 5.3 Bargaining power of suppliers
      • Exhibit 25: Bargaining power of suppliers – Impact of key factors in 2023 and 2028
    • 5.4 Threat of new entrants
      • Exhibit 26: Threat of new entrants – Impact of key factors in 2023 and 2028
    • 5.5 Threat of substitutes
      • Exhibit 27: Threat of substitutes – Impact of key factors in 2023 and 2028
    • 5.6 Threat of rivalry
      • Exhibit 28: Threat of rivalry – Impact of key factors in 2023 and 2028
    • 5.7 Market condition
      • Exhibit 29: Chart on Market condition - Five forces 2023 and 2028

    6 Market Segmentation by Distribution Channel

    • 6.1 Market segments
      • Exhibit 30: Chart on Distribution Channel - Market share 2023-2028 (%)
      • Exhibit 31: Data Table on Distribution Channel - Market share 2023-2028 (%)
    • 6.2 Comparison by Distribution Channel
      • Exhibit 32: Chart on Comparison by Distribution Channel
      • Exhibit 33: Data Table on Comparison by Distribution Channel
    • 6.3 Offline - Market size and forecast 2023-2028
      • Exhibit 34: Chart on Offline - Market size and forecast 2023-2028 ($ million)
      • Exhibit 35: Data Table on Offline - Market size and forecast 2023-2028 ($ million)
      • Exhibit 36: Chart on Offline - Year-over-year growth 2023-2028 (%)
      • Exhibit 37: Data Table on Offline - Year-over-year growth 2023-2028 (%)
    • 6.4 Online - Market size and forecast 2023-2028
      • Exhibit 38: Chart on Online - Market size and forecast 2023-2028 ($ million)
      • Exhibit 39: Data Table on Online - Market size and forecast 2023-2028 ($ million)
      • Exhibit 40: Chart on Online - Year-over-year growth 2023-2028 (%)
      • Exhibit 41: Data Table on Online - Year-over-year growth 2023-2028 (%)
    • 6.5 Market opportunity by Distribution Channel
      • Exhibit 42: Market opportunity by Distribution Channel ($ million)
      • Exhibit 43: Data Table on Market opportunity by Distribution Channel ($ million)

    7 Market Segmentation by Application

    • 7.1 Market segments
      • Exhibit 44: Chart on Application - Market share 2023-2028 (%)
      • Exhibit 45: Data Table on Application - Market share 2023-2028 (%)
    • 7.2 Comparison by Application
      • Exhibit 46: Chart on Comparison by Application
      • Exhibit 47: Data Table on Comparison by Application
    • 7.3 Residential - Market size and forecast 2023-2028
      • Exhibit 48: Chart on Residential - Market size and forecast 2023-2028 ($ million)
      • Exhibit 49: Data Table on Residential - Market size and forecast 2023-2028 ($ million)
      • Exhibit 50: Chart on Residential - Year-over-year growth 2023-2028 (%)
      • Exhibit 51: Data Table on Residential - Year-over-year growth 2023-2028 (%)
    • 7.4 Commercial - Market size and forecast 2023-2028
      • Exhibit 52: Chart on Commercial - Market size and forecast 2023-2028 ($ million)
      • Exhibit 53: Data Table on Commercial - Market size and forecast 2023-2028 ($ million)
      • Exhibit 54: Chart on Commercial - Year-over-year growth 2023-2028 (%)
      • Exhibit 55: Data Table on Commercial - Year-over-year growth 2023-2028 (%)
    • 7.5 Market opportunity by Application
      • Exhibit 56: Market opportunity by Application ($ million)
      • Exhibit 57: Data Table on Market opportunity by Application ($ million)

    8 Customer Landscape

    • 8.1 Customer landscape overview
      • Exhibit 58: Analysis of price sensitivity, lifecycle, customer purchase basket, adoption rates, and purchase criteria

    9 Geographic Landscape

    • 9.1 Geographic segmentation
      • Exhibit 59: Chart on Market share by geography 2023-2028 (%)
      • Exhibit 60: Data Table on Market share by geography 2023-2028 (%)
    • 9.2 Geographic comparison
      • Exhibit 61: Chart on Geographic comparison
      • Exhibit 62: Data Table on Geographic comparison
    • 9.3 North America - Market size and forecast 2023-2028
      • Exhibit 63: Chart on North America - Market size and forecast 2023-2028 ($ million)
      • Exhibit 64: Data Table on North America - Market size and forecast 2023-2028 ($ million)
      • Exhibit 65: Chart on North America - Year-over-year growth 2023-2028 (%)
      • Exhibit 66: Data Table on North America - Year-over-year growth 2023-2028 (%)
    • 9.4 Europe - Market size and forecast 2023-2028
      • Exhibit 67: Chart on Europe - Market size and forecast 2023-2028 ($ million)
      • Exhibit 68: Data Table on Europe - Market size and forecast 2023-2028 ($ million)
      • Exhibit 69: Chart on Europe - Year-over-year growth 2023-2028 (%)
      • Exhibit 70: Data Table on Europe - Year-over-year growth 2023-2028 (%)
    • 9.5 APAC - Market size and forecast 2023-2028
      • Exhibit 71: Chart on APAC - Market size and forecast 2023-2028 ($ million)
      • Exhibit 72: Data Table on APAC - Market size and forecast 2023-2028 ($ million)
      • Exhibit 73: Chart on APAC - Year-over-year growth 2023-2028 (%)
      • Exhibit 74: Data Table on APAC - Year-over-year growth 2023-2028 (%)
    • 9.6 Middle East and Africa - Market size and forecast 2023-2028
      • Exhibit 75: Chart on Middle East and Africa - Market size and forecast 2023-2028 ($ million)
      • Exhibit 76: Data Table on Middle East and Africa - Market size and forecast 2023-2028 ($ million)
      • Exhibit 77: Chart on Middle East and Africa - Year-over-year growth 2023-2028 (%)
      • Exhibit 78: Data Table on Middle East and Africa - Year-over-year growth 2023-2028 (%)
    • 9.7 South America - Market size and forecast 2023-2028
      • Exhibit 79: Chart on South America - Market size and forecast 2023-2028 ($ million)
      • Exhibit 80: Data Table on South America - Market size and forecast 2023-2028 ($ million)
      • Exhibit 81: Chart on South America - Year-over-year growth 2023-2028 (%)
      • Exhibit 82: Data Table on South America - Year-over-year growth 2023-2028 (%)
    • 9.8 US - Market size and forecast 2023-2028
      • Exhibit 83: Chart on US - Market size and forecast 2023-2028 ($ million)
      • Exhibit 84: Data Table on US - Market size and forecast 2023-2028 ($ million)
      • Exhibit 85: Chart on US - Year-over-year growth 2023-2028 (%)
      • Exhibit 86: Data Table on US - Year-over-year growth 2023-2028 (%)
    • 9.9 China - Market size and forecast 2023-2028
      • Exhibit 87: Chart on China - Market size and forecast 2023-2028 ($ million)
      • Exhibit 88: Data Table on China - Market size and forecast 2023-2028 ($ million)
      • Exhibit 89: Chart on China - Year-over-year growth 2023-2028 (%)
      • Exhibit 90: Data Table on China - Year-over-year growth 2023-2028 (%)
    • 9.10 Germany - Market size and forecast 2023-2028
      • Exhibit 91: Chart on Germany - Market size and forecast 2023-2028 ($ million)
      • Exhibit 92: Data Table on Germany - Market size and forecast 2023-2028 ($ million)
      • Exhibit 93: Chart on Germany - Year-over-year growth 2023-2028 (%)
      • Exhibit 94: Data Table on Germany - Year-over-year growth 2023-2028 (%)
    • 9.11 Canada - Market size and forecast 2023-2028
      • Exhibit 95: Chart on Canada - Market size and forecast 2023-2028 ($ million)
      • Exhibit 96: Data Table on Canada - Market size and forecast 2023-2028 ($ million)
      • Exhibit 97: Chart on Canada - Year-over-year growth 2023-2028 (%)
      • Exhibit 98: Data Table on Canada - Year-over-year growth 2023-2028 (%)
    • 9.12 UK - Market size and forecast 2023-2028
      • Exhibit 99: Chart on UK - Market size and forecast 2023-2028 ($ million)
      • Exhibit 100: Data Table on UK - Market size and forecast 2023-2028 ($ million)
      • Exhibit 101: Chart on UK - Year-over-year growth 2023-2028 (%)
      • Exhibit 102: Data Table on UK - Year-over-year growth 2023-2028 (%)
    • 9.13 Market opportunity by geography
      • Exhibit 103: Market opportunity by geography ($ million)
      • Exhibit 104: Data Tables on Market opportunity by geography ($ million)

    10 Drivers, Challenges, and Trends

    • 10.1 Market drivers
      • 10.2 Market challenges
        • 10.3 Impact of drivers and challenges
          • Exhibit 105: Impact of drivers and challenges in 2023 and 2028
        • 10.4 Market trends

          11 Vendor Landscape

          • 11.1 Overview
            • 11.2 Vendor landscape
              • Exhibit 106: Overview on Criticality of inputs and Factors of differentiation
            • 11.3 Landscape disruption
              • Exhibit 107: Overview on factors of disruption
            • 11.4 Industry risks
              • Exhibit 108: Impact of key risks on business

            12 Vendor Analysis

            • 12.1 Vendors covered
              • Exhibit 109: Vendors covered
            • 12.2 Market positioning of vendors
              • Exhibit 110: Matrix on vendor position and classification
            • 12.3 Abbyson Living LLC
              • Exhibit 111: Abbyson Living LLC - Overview
              • Exhibit 112: Abbyson Living LLC - Product / Service
              • Exhibit 113: Abbyson Living LLC - Key offerings
            • 12.4 Artisanal Abode
              • Exhibit 114: Artisanal Abode - Overview
              • Exhibit 115: Artisanal Abode - Product / Service
              • Exhibit 116: Artisanal Abode - Key offerings
            • 12.5 Ashley Global Retail LLC
              • Exhibit 117: Ashley Global Retail LLC - Overview
              • Exhibit 118: Ashley Global Retail LLC - Product / Service
              • Exhibit 119: Ashley Global Retail LLC - Key offerings
            • 12.6 Century Furniture LLC
              • Exhibit 120: Century Furniture LLC - Overview
              • Exhibit 121: Century Furniture LLC - Product / Service
              • Exhibit 122: Century Furniture LLC - Key offerings
            • 12.7 Ethan Allen Interiors Inc.
              • Exhibit 123: Ethan Allen Interiors Inc. - Overview
              • Exhibit 124: Ethan Allen Interiors Inc. - Business segments
              • Exhibit 125: Ethan Allen Interiors Inc. - Key offerings
              • Exhibit 126: Ethan Allen Interiors Inc. - Segment focus
            • 12.8 Giessegi Industria Mobili Spa
              • Exhibit 127: Giessegi Industria Mobili Spa - Overview
              • Exhibit 128: Giessegi Industria Mobili Spa - Product / Service
              • Exhibit 129: Giessegi Industria Mobili Spa - Key offerings
            • 12.9 Godrej and Boyce Manufacturing Co. Ltd.
              • Exhibit 130: Godrej and Boyce Manufacturing Co. Ltd. - Overview
              • Exhibit 131: Godrej and Boyce Manufacturing Co. Ltd. - Business segments
              • Exhibit 132: Godrej and Boyce Manufacturing Co. Ltd. - Key offerings
              • Exhibit 133: Godrej and Boyce Manufacturing Co. Ltd. - Segment focus
            • 12.10 HNI Corp.
              • Exhibit 134: HNI Corp. - Overview
              • Exhibit 135: HNI Corp. - Business segments
              • Exhibit 136: HNI Corp. - Key offerings
              • Exhibit 137: HNI Corp. - Segment focus
            • 12.11 hulsta werke Huls GmbH and Co. KG
              • Exhibit 138: hulsta werke Huls GmbH and Co. KG - Overview
              • Exhibit 139: hulsta werke Huls GmbH and Co. KG - Product / Service
              • Exhibit 140: hulsta werke Huls GmbH and Co. KG - Key offerings
            • 12.12 Inter IKEA Holding BV
              • Exhibit 141: Inter IKEA Holding BV - Overview
              • Exhibit 142: Inter IKEA Holding BV - Product / Service
              • Exhibit 143: Inter IKEA Holding BV - Key news
              • Exhibit 144: Inter IKEA Holding BV - Key offerings
            • 12.13 LaZBoy Inc.
              • Exhibit 145: LaZBoy Inc. - Overview
              • Exhibit 146: LaZBoy Inc. - Business segments
              • Exhibit 147: LaZBoy Inc. - Key offerings
              • Exhibit 148: LaZBoy Inc. - Segment focus
            • 12.14 MillerKnoll Inc.
              • Exhibit 149: MillerKnoll Inc. - Overview
              • Exhibit 150: MillerKnoll Inc. - Business segments
              • Exhibit 151: MillerKnoll Inc. - Key offerings
              • Exhibit 152: MillerKnoll Inc. - Segment focus
            • 12.15 Restoration Hardware Inc.
              • Exhibit 153: Restoration Hardware Inc. - Overview
              • Exhibit 154: Restoration Hardware Inc. - Business segments
              • Exhibit 155: Restoration Hardware Inc. - Key offerings
              • Exhibit 156: Restoration Hardware Inc. - Segment focus
            • 12.16 Roomstogo.com Inc.
              • Exhibit 157: Roomstogo.com Inc. - Overview
              • Exhibit 158: Roomstogo.com Inc. - Product / Service
              • Exhibit 159: Roomstogo.com Inc. - Key offerings
            • 12.17 Wayfair Inc.
              • Exhibit 160: Wayfair Inc. - Overview
              • Exhibit 161: Wayfair Inc. - Business segments
              • Exhibit 162: Wayfair Inc. - Key news
              • Exhibit 163: Wayfair Inc. - Key offerings
              • Exhibit 164: Wayfair Inc. - Segment focus

            13 Appendix

            • 13.1 Scope of the report
              • 13.2 Inclusions and exclusions checklist
                • Exhibit 165: Inclusions checklist
                • Exhibit 166: Exclusions checklist
              • 13.3 Currency conversion rates for US$
                • Exhibit 167: Currency conversion rates for US$
              • 13.4 Research methodology
                • Exhibit 168: Research methodology
                • Exhibit 169: Validation techniques employed for market sizing
                • Exhibit 170: Information sources
              • 13.5 List of abbreviations
                • Exhibit 171: List of abbreviations

              Research Methodology

              Technavio presents a detailed picture of the market by way of study, synthesis, and summation of data from multiple sources. The analysts have presented the various facets of the market with a particular focus on identifying the key industry influencers. The data thus presented is comprehensive, reliable, and the result of extensive research, both primary and secondary.

              INFORMATION SOURCES

              Primary sources

              • Manufacturers and suppliers
              • Channel partners
              • Industry experts
              • Strategic decision makers

              Secondary sources

              • Industry journals and periodicals
              • Government data
              • Financial reports of key industry players
              • Historical data
              • Press releases

              DATA ANALYSIS

              Data Synthesis

              • Collation of data
              • Estimation of key figures
              • Analysis of derived insights

              Data Validation

              • Triangulation with data models
              • Reference against proprietary databases
              • Corroboration with industry experts

              REPORT WRITING

              Qualitative

              • Market drivers
              • Market challenges
              • Market trends
              • Five forces analysis

              Quantitative

              • Market size and forecast
              • Market segmentation
              • Geographical insights
              • Competitive landscape

              Interested in this report?

              Get your sample now to see our research methodology and insights!

              Download Now

              Frequently Asked Questions

              Poufs market growth will increase by $ 150.55 mn during 2024-2028 .

              The Poufs market is expected to grow at a CAGR of 4.19% during 2024-2028 .

              Poufs market is segmented by Distribution Channel( Offline, Online) Application( Residential, Commercial)

              Abbyson Living LLC, Artisanal Abode, Ashley Global Retail LLC, Century Furniture LLC, Dunns Furniture, Ethan Allen Interiors Inc., FurnitureRoots, Giessegi Industria Mobili Spa, Godrej and Boyce Manufacturing Co. Ltd., HNI Corp., hulsta werke Huls GmbH and Co. KG, Inter IKEA Holding BV, LaZBoy Inc., MillerKnoll Inc., Nitori Holdings Co. Ltd., Restoration Hardware Inc., ROCHE BOBOIS SA, Roomstogo.com Inc., Steelcase Inc., Wayfair Inc. are a few of the key vendors in the Poufs market.

              North America will register the highest growth rate of 37% among the other regions. Therefore, the Poufs market in North America is expected to garner significant business opportunities for the vendors during the forecast period.

              US, Canada, China, Germany, UK

              • Increase in residential and commercial constructionA key driver of the growth of the global poufs market is the growth of global real estate and increasing residential and commercial construction across the world. Developed economies such as the US are planning to invest billions in infrastructural development. In emerging economies such as India is the driving factor this market.
              • the possibility of 100% FDI for townships and settlement projects is estimated to increase the demand for furniture products is the driving factor this market.
              • including poufs is the driving factor this market.
              • during the forecast period. In the country is the driving factor this market.
              • government initiatives such as the Smart Cities Mission is the driving factor this market.
              • Pradhan Mantri Awas Yojana (PMAY) is the driving factor this market.
              • and the Sardar Patel National Urban Housing Mission are estimated to increase the number of people living in urban areas is the driving factor this market.
              • which is expected to be a key factor that will drive the growth of the market during the forecast period. The rising focus on infrastructural and real estate development is the driving factor this market.
              • as well as the construction of new residences and offices is the driving factor this market.
              • is expected to increase the sales of new furniture and furnishings such as poufs. In addition to new construction is the driving factor this market.
              • the rising demand for furniture is also complemented by the increase in the number of renovation and modification projects across key countries such as the US is the driving factor this market.
              • China is the driving factor this market.
              • and India. The rise in the number of multinational and global companies is the driving factor this market.
              • as well as technology and business parks due to favorable trade relations between countries and government policies is the driving factor this market.
              • such as FDI relaxation is the driving factor this market.
              • is estimated to increase the demand for office and commercial furniture during the forecast period. The demand for office spaces in the Bay Area of California; Quezon City in the Philippines; and Gurugram is the driving factor this market.
              • Bengaluru is the driving factor this market.
              • and Hyderabad in India is estimated to drive the growth of the global poufs market during the forecast period. The real estate industry is growing significantly in key countries such as the US due to the increasing construction of offices is the driving factor this market.
              • commercial complexes is the driving factor this market.
              • and residences. This is estimated to be a key factor that will drive the growth of the regional and global poufs market during the forecast period. Hence is the driving factor this market.
              • the growth of real estate across the world is estimated to be a key driver that will drive the growth of the global poufs market during the forecast period. is the driving factor this market.

              The Poufs market vendors should focus on grabbing business opportunities from the Offline segment as it accounted for the largest market share in the base year.