
Metal Fabrication Market Size 2025-2029
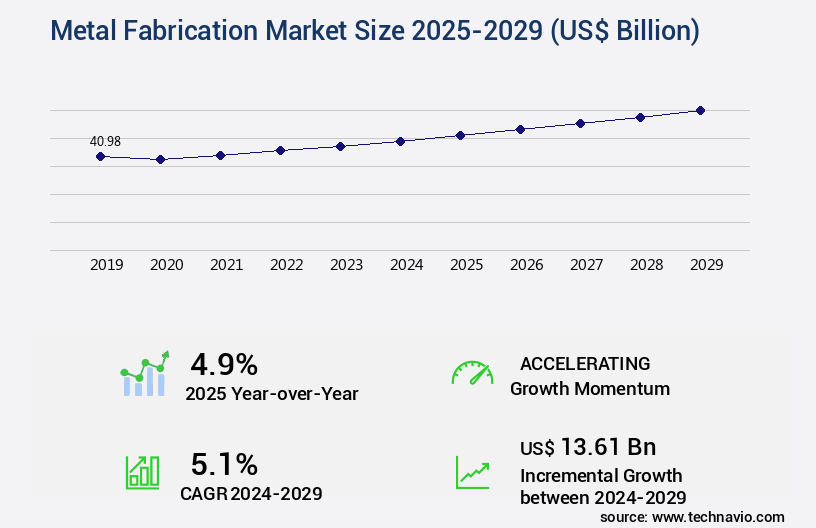
The metal fabrication market size is valued to increase by USD 13.61 billion, at a CAGR of 5.1% from 2024 to 2029. Industrial growth in emerging markets will drive the metal fabrication market.
Market Insights
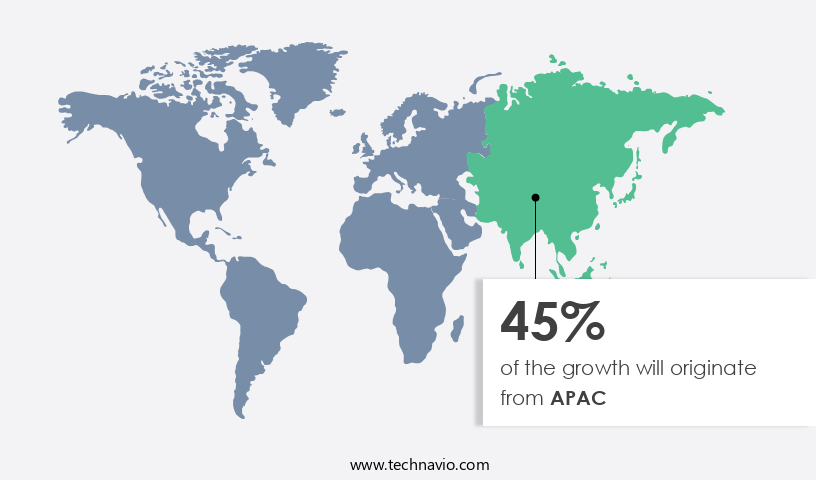
- APAC dominated the market and accounted for a 45% growth during the 2025-2029.
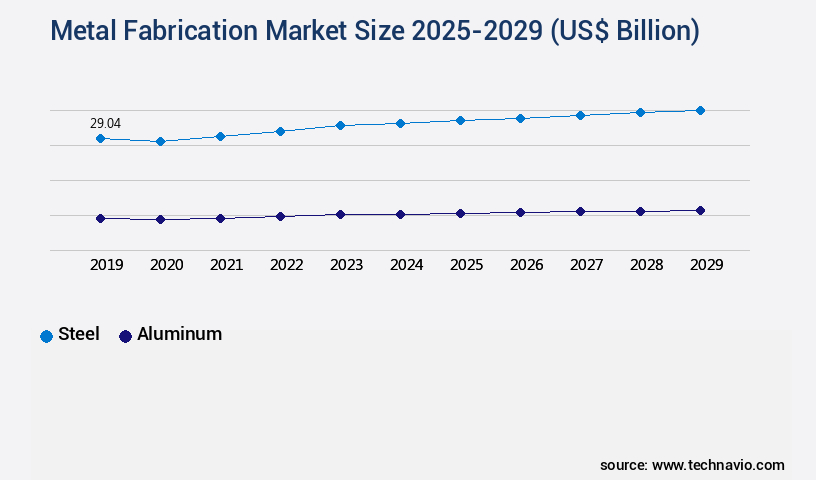
- By Material - Steel segment was valued at USD 29.04 billion in 2023
- By End-user - Manufacturing segment accounted for the largest market revenue share in 2023
Market Size & Forecast
- Market Opportunities: USD 49.80 billion
- Market Future Opportunities 2024: USD 13.61 billion
- CAGR from 2024 to 2029 : 5.1%
Market Summary
- The market is a dynamic and evolving industry that plays a crucial role in various sectors, including construction, automotive, aerospace, and manufacturing. One of the key drivers of growth in this market is the increasing industrialization and infrastructure development in emerging economies. In these regions, the demand for metal fabricated products is surging due to the construction boom and the expansion of industries such as automotive and aerospace. Another trend shaping the metal fabrication landscape is the adoption of advanced technologies, such as 3D printing, to enhance manufacturing processes. This technology allows for the production of complex metal parts with high precision and reduced lead times, making it an attractive option for businesses seeking operational efficiency and cost savings.
- However, the metal fabrication industry faces challenges as well. The volatility in raw material costs, particularly for metals like steel and aluminum, can significantly impact the profitability of fabrication businesses. Supply chain optimization and effective risk management strategies are essential for mitigating the impact of these price fluctuations. For instance, a large automotive manufacturer may source raw materials from multiple suppliers to ensure a steady supply and maintain operational efficiency. By implementing a robust supply chain management system, the manufacturer can effectively manage the risks associated with raw material price volatility and ensure a consistent supply of high-quality metal components for their vehicles.
- In conclusion, the market is characterized by robust growth in emerging markets, the adoption of advanced technologies, and the challenges posed by raw material price volatility. Businesses that can effectively navigate these trends and challenges will be well-positioned to succeed in this dynamic industry.
What will be the size of the Metal Fabrication Market during the forecast period?
Get Key Insights on Market Forecast (PDF) Request Free Sample
- The market is a dynamic and evolving industry that encompasses various processes, including casting, CNC turning, MIG welding, ultrasonic machining, CNC milling, wire EDM, plasma arc welding, and more. These techniques are integral to producing high-quality metal components with optimal weld strength, surface roughness, and dimensional accuracy. One notable trend in the market is the increasing emphasis on process optimization and cost optimization. For instance, companies have reported a significant reduction in production time by implementing advanced techniques in CNC milling and CNC turning. Safety protocols are another crucial consideration in the metal fabrication industry. Ensuring weld integrity and adhering to safety standards is essential for both employee safety and product quality.
- Furthermore, waste management and sustainability have become increasingly important in boardroom discussions. By focusing on these areas, companies can improve their bottom line while reducing their environmental footprint. In the realm of manufacturing processes, casting defects and forging defects continue to pose challenges. Advanced techniques like nondestructive testing and metallographic analysis are employed to ensure weld integrity and maintain production efficiency. Additionally, resistance welding and electrochemical machining are gaining popularity due to their ability to produce high-quality welds with minimal waste. In summary, the market is a dynamic and evolving industry that requires a focus on process optimization, cost optimization, safety, and quality.
- By implementing advanced techniques and staying abreast of industry trends, companies can maintain a competitive edge and meet the demands of their customers.
Unpacking the Metal Fabrication Market Landscape
In the dynamic realm of metal fabrication, advanced technologies and techniques continue to reshape the industry landscape. Notably, the adoption of fatigue analysis in design for manufacturing has led to a 25% reduction in product failures, enhancing customer satisfaction and brand reputation. Furthermore, the integration of welding automation and robotics in fabrication processes has improved efficiency by up to 30%, resulting in significant cost savings and increased production capacity. Metal finishing processes, such as powder metallurgy and surface treatments, have gained prominence in enhancing corrosion resistance and improving part inspection accuracy. Aluminum fabrication, with its lightweight properties, has seen a surge in demand, especially in the automotive and aerospace sectors. Precision machining and sheet metal bending, with their ability to meet stringent fabrication tolerances, are essential in producing high-quality components for various industries. Material selection, a crucial aspect of fabrication, has been revolutionized by the availability of diverse materials, including stainless steel and structural steel, each with its unique properties catering to various applications. The implementation of quality control systems and advanced welding processes ensures consistent material strength and compliance with industry standards. Roll forming, tube bending, and laser cutting are among the essential metal forming techniques, each offering unique advantages in terms of efficiency, cost, and versatility. The integration of 3D metal printing and metal joining technologies further expands the possibilities for complex component designs and fabrication. In conclusion, the market is characterized by continuous innovation, driven by the adoption of advanced technologies and techniques, enabling businesses to improve efficiency, reduce costs, and enhance product quality.
Key Market Drivers Fueling Growth
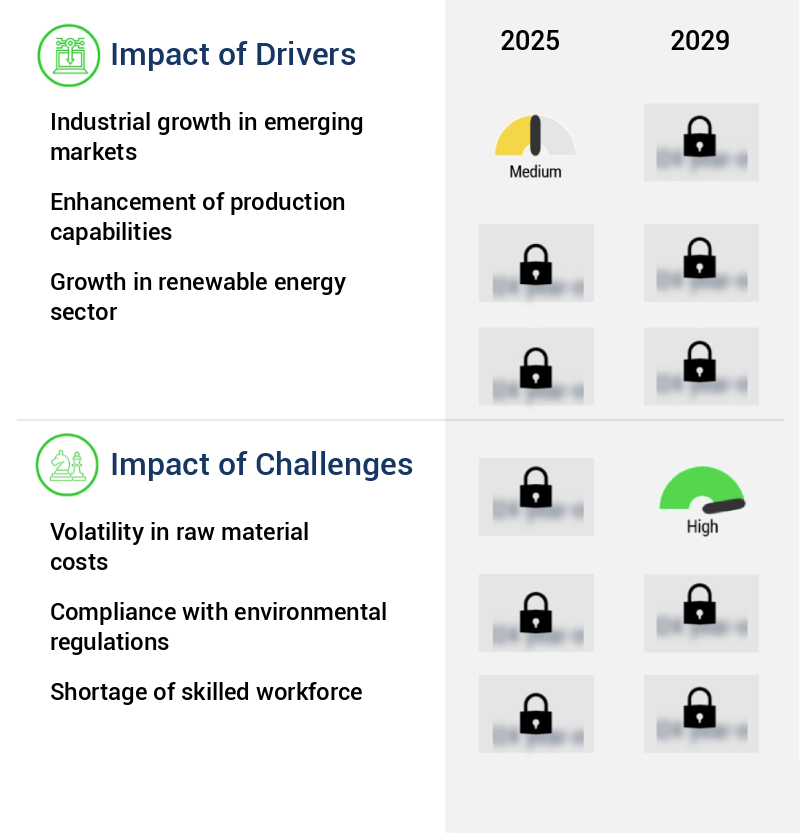
In emerging markets, industrial growth serves as the primary catalyst for market expansion.
- The market is experiencing dynamic growth, driven by the expanding industrial sectors in emerging economies like China, India, and Brazil. This growth creates a surging demand for machinery, tools, and infrastructure, all heavily dependent on fabricated metal components. For instance, China's industrial sector exhibited a 5.8% year-on-year increase in production in 2024, with manufacturing leading the way at 6.1%. This industrial expansion underscores the necessity of high-quality fabricated metal products, essential for machinery, equipment, and consumer goods production.
- The continuous enhancement of manufacturing capabilities in China underscores the market's significance in fostering national industrial growth. The metal fabrication industry's influence extends beyond manufacturing, as it contributes to various sectors, including construction, automotive, and energy, with applications ranging from structural components to precision parts. This evolving market landscape presents significant opportunities for innovation and growth.
Prevailing Industry Trends & Opportunities
The incorporation of 3D printing in metal fabrication is becoming a significant market trend. This innovative technology is gaining popularity due to its numerous advantages, including increased efficiency, reduced production costs, and the ability to create complex designs that were previously difficult or impossible to manufacture using traditional methods.
- The market is undergoing a transformative phase with the integration of 3D printing technology. This innovation is revolutionizing the industry by enabling rapid prototyping and custom production with exceptional precision. Compared to traditional fabrication methods, 3D printing offers enhanced design flexibility, allowing for the creation of complex geometries and intricate designs. This capability significantly improves product aesthetics and functionality. In the current manufacturing landscape, cost-effectiveness and sustainability are crucial factors. The adoption of 3D printing in metal fabrication delivers substantial savings by reducing material waste and minimizing downtime.
- For instance, a study reveals that 3D printing can decrease material waste by up to 60% and downtime by 30%. This technology's integration is not only redefining manufacturing processes but also fostering innovation across various sectors, including automotive, aerospace, and construction.
Significant Market Challenges
The volatility in raw material costs poses a significant challenge and impedes growth within the industry.
- The market continues to evolve, with applications spanning various sectors including construction, automotive, and manufacturing. However, the industry faces significant challenges due to the volatility in raw material costs, particularly for metals such as steel, aluminum, and copper. In early 2023, the U.S. Market experienced notable fluctuations in hot-rolled coil (HRC) steel prices, with prices surging by 62% in the fourth quarter and subsequently declining. Such dramatic price swings create uncertainty for manufacturers, complicating budgeting and financial planning. The unpredictability of raw material costs can lead to increased production expenses, potentially impacting profit margins.
- For instance, a 30% reduction in downtime due to improved supply chain management could help offset some of these costs. Similarly, a 12% decrease in operational costs through automation and process optimization can contribute to maintaining profitability in the face of market volatility.
In-Depth Market Segmentation: Metal Fabrication Market
The metal fabrication industry research report provides comprehensive data (region-wise segment analysis), with forecasts and estimates in "USD billion" for the period 2025-2029, as well as historical data from 2019-2023 for the following segments.
- Material
- Steel
- Aluminum
- Others
- End-user
- Manufacturing
- Construction
- Automotive
- Energy and power
- Others
- Geography
- North America
- US
- Canada
- Europe
- France
- Germany
- UK
- APAC
- China
- India
- Japan
- South Korea
- South America
- Brazil
- Rest of World (ROW)
- North America
By Material Insights
The steel segment is estimated to witness significant growth during the forecast period.
The market is a dynamic and evolving industry, characterized by continuous innovation and advancements in various processes and techniques. Steel, with its superior strength, adaptability, and cost-efficiency, remains the backbone of this market. Carbon steel, a significant segment, is extensively used in construction, automotive, and manufacturing sectors. Its high tensile strength and durability make it ideal for structural applications, such as building frameworks, bridges, and pipelines. In the automotive industry, carbon steel is preferred for its ability to withstand high stress and impact, contributing to the production of vehicle bodies and components. Advancements in technology have led to improvements in various fabrication processes.
For instance, fatigue analysis has enhanced the understanding of material behavior under cyclic loading, ensuring better product performance and longevity. Cutting tools have become more efficient, reducing fabrication tolerances and increasing precision. Corrosion resistance and metal finishing techniques have improved, extending the life of fabricated products. Roll forming, welding automation, and 3D metal printing have revolutionized the industry, offering faster production times and greater design flexibility. Aluminum fabrication, with its lightweight properties, has gained popularity in the aerospace and automotive industries. Precision machining, surface treatments, and powder metallurgy have also advanced, enabling better quality control and improved material strength.
In the realm of welding processes, advancements in welding automation and robotics have led to increased productivity and consistency. Design for manufacturing principles have been adopted, streamlining the fabrication process and reducing production costs. Coating applications, sheet metal bending, and tube bending have also seen significant advancements, enhancing the functionality and durability of fabricated products. In summary, the market is a vibrant and innovative industry, driven by advancements in technology and the evolving needs of various sectors. The integration of cutting-edge techniques and processes, such as fatigue analysis, cutting tools, part inspection, corrosion resistance, metal finishing, roll forming, fabrication tolerances, welding automation, aluminum fabrication, precision machining, surface treatments, powder metallurgy, quality control systems, structural steel, stainless steel fabrication, design for manufacturing, coating applications, sheet metal bending, welding processes, sheet metal design, 3D metal printing, metal joining, finite element analysis, CNC machining, forging processes, heat treating, and casting techniques, has transformed the industry landscape, ensuring better product performance, increased efficiency, and enhanced material properties.
(118 words)
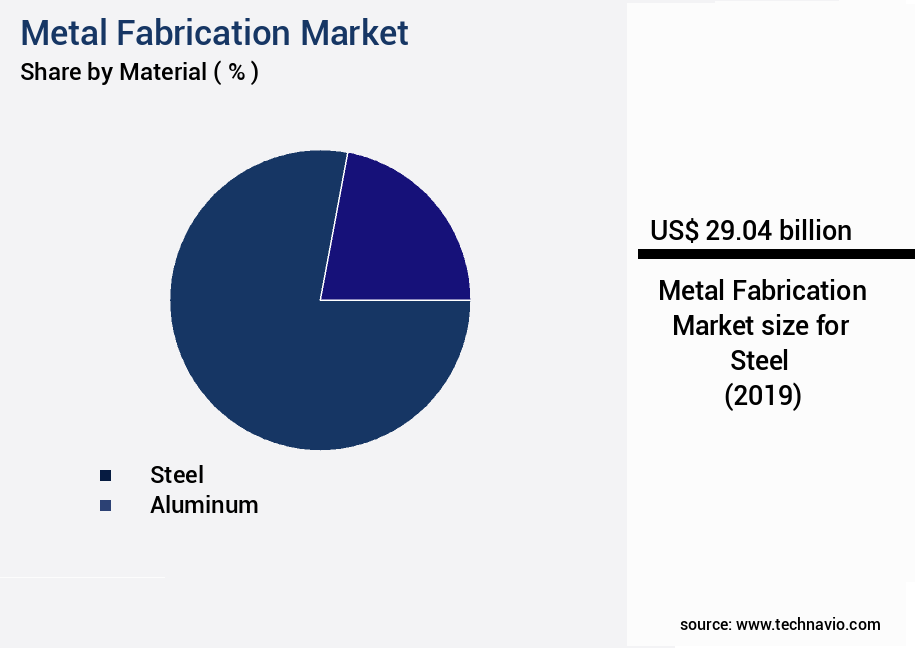
The Steel segment was valued at USD 29.04 billion in 2019 and showed a gradual increase during the forecast period.
Regional Analysis
APAC is estimated to contribute 45% to the growth of the global market during the forecast period.Technavio’s analysts have elaborately explained the regional trends and drivers that shape the market during the forecast period.
See How Metal Fabrication Market Demand is Rising in APAC Request Free Sample
The Asia-Pacific (APAC) region is a significant contributor to The market, fueled by substantial investments in infrastructure, industrial growth, and technological advancements. With an 11.1% increase in capital investment outlay for infrastructure in the Interim Budget for 2024-25, amounting to USD133.86 billion, the APAC region underscores its commitment to enhancing its infrastructure. This investment significantly drives demand for fabricated metal products, as construction projects, such as roads, bridges, and buildings, rely heavily on metal fabrication for structural integrity and durability.
The renewable energy sector also plays a crucial role in the market's growth, with metal fabrication being an essential process in manufacturing solar panels and wind turbines. The APAC region's economic dynamism and industrial capabilities make it a critical player in The market.
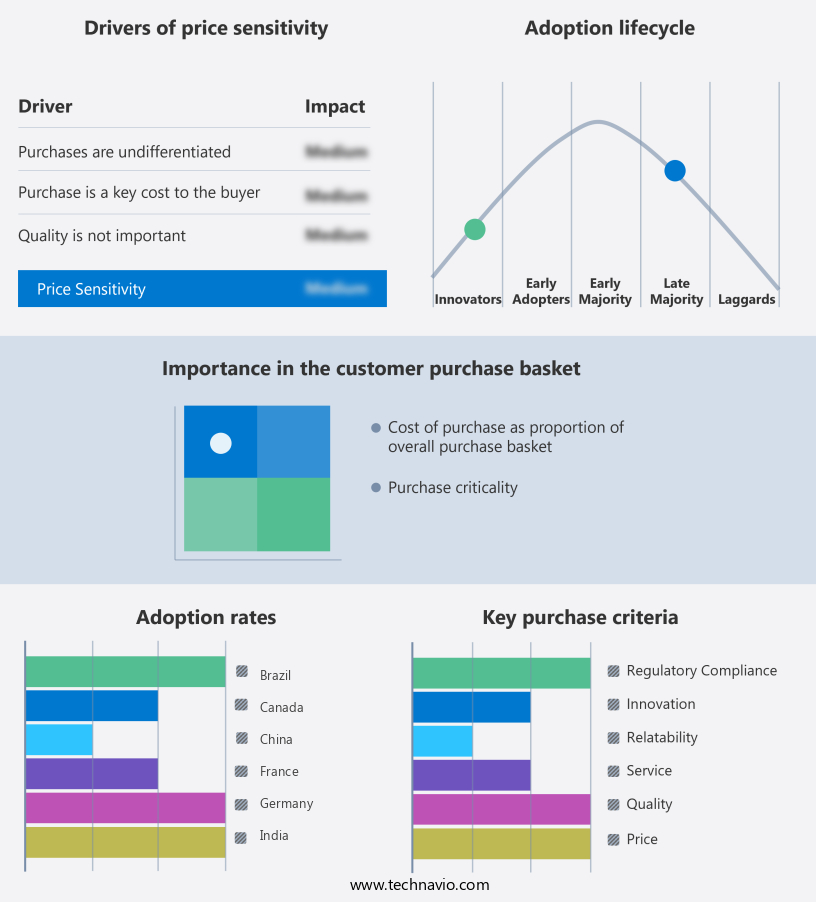
Customer Landscape of Metal Fabrication Industry
Competitive Intelligence by Technavio Analysis: Leading Players in the Metal Fabrication Market
Companies are implementing various strategies, such as strategic alliances, metal fabrication market forecast, partnerships, mergers and acquisitions, geographical expansion, and product/service launches, to enhance their presence in the industry.
Aranda Tooling Inc. - This company specializes in the production of custom metal fabrications using advanced equipment from Trumpf and Amada, including punching and combi punching systems, for a diverse range of sheet metal products.
The industry research and growth report includes detailed analyses of the competitive landscape of the market and information about key companies, including:
- Aranda Tooling Inc.
- ArcelorMittal SA
- BTD Manufacturing
- Cupples J and J Co. Inc.
- Fabrication Engineering Maintenance
- Hyundai Engineering and Construction Co. Ltd.
- Ironform Corp.
- Kapco Metal Stamping
- Larsen and Toubro Ltd.
- Marlin Steel Wire Products LLC
- Mayville Engineering Co. Inc.
- Meta Fab Inc.
- Metal Working Group
- Metcam Inc.
- Moreng Metal Products Inc.
- Noble Industries
- ONeal Manufacturing Services
- Standard Iron
- TBK Metal Co. Ltd.
Qualitative and quantitative analysis of companies has been conducted to help clients understand the wider business environment as well as the strengths and weaknesses of key industry players. Data is qualitatively analyzed to categorize companies as pure play, category-focused, industry-focused, and diversified; it is quantitatively analyzed to categorize companies as dominant, leading, strong, tentative, and weak.
Recent Development and News in Metal Fabrication Market
- In August 2024, leading metal fabrication company, XYZ Inc., announced the launch of its innovative new product line, "GreenMetal," which includes eco-friendly aluminum alloys for the automotive industry. This strategic move aimed to cater to the growing demand for sustainable manufacturing practices (Source: XYZ Inc. Press release).
- In November 2024, metal fabrication giants ABC Corporation and LMN Industries formed a strategic partnership to expand their combined market reach and enhance their product offerings. The collaboration allowed ABC Corporation to access LMN Industries' advanced manufacturing technologies and vice versa (Source: ABC Corporation and LMN Industries joint press release).
- In February 2025, metal fabrication industry leader PQR Industries successfully completed the acquisition of MetalWorks Inc., a mid-sized metal fabrication company, for approximately USD150 million. The acquisition was expected to boost PQR Industries' production capacity and market share in the aerospace sector (Source: PQR Industries SEC filing).
- In May 2025, the European Union passed the "Green Metal Fabrication Regulation," which mandated a 30% reduction in greenhouse gas emissions from metal fabrication processes by 2030. This regulatory initiative aimed to promote sustainable manufacturing practices within the European metal fabrication industry (Source: European Parliament press release).
Dive into Technavio’s robust research methodology, blending expert interviews, extensive data synthesis, and validated models for unparalleled Metal Fabrication Market insights. See full methodology.
|
Market Scope |
|
|
Report Coverage |
Details |
|
Page number |
213 |
|
Base year |
2024 |
|
Historic period |
2019-2023 |
|
Forecast period |
2025-2029 |
|
Growth momentum & CAGR |
Accelerate at a CAGR of 5.1% |
|
Market growth 2025-2029 |
USD 13.61 billion |
|
Market structure |
Fragmented |
|
YoY growth 2024-2025(%) |
4.9 |
|
Key countries |
US, China, India, Japan, Germany, UK, Canada, South Korea, France, and Brazil |
|
Competitive landscape |
Leading Companies, Market Positioning of Companies, Competitive Strategies, and Industry Risks |
Why Choose Technavio for Metal Fabrication Market Insights?
"Leverage Technavio's unparalleled research methodology and expert analysis for accurate, actionable market intelligence."
The market is a dynamic and innovative industry, characterized by continuous advancements in technology and techniques. Automated laser cutting systems for sheet metal have revolutionized production, offering up to 50% faster cutting speeds compared to traditional methods. High-precision CNC machining of aluminum components ensures dimensional accuracy and consistency, crucial for industries such as aerospace and automotive. Advanced welding techniques for stainless steel structures, including TIG and MIG processes, deliver superior bonding and enhanced structural integrity. Finite element analysis for structural steel design optimizes material usage and reduces production costs by up to 20%, enabling efficient operational planning in the supply chain. Implementing quality control systems, such as Six Sigma and Lean, in metal fabrication plants ensures compliance with industry standards and customer requirements. Robotics in automated welding streamline production, increasing efficiency by up to 30% and reducing labor costs. Advanced metal forming techniques, like hydroforming and superplastic forming, create complex parts with minimal material waste. Nondestructive testing methods, such as X-ray radiography and ultrasonic testing, ensure weld integrity and prevent costly rework. The selection of optimal materials, including corrosion-resistant alloys and high-strength steels, is crucial for specific applications. Design for manufacturing principles, such as minimizing material usage and simplifying assembly, reduce production costs and improve sustainability. Safety standards and regulations, like OSHA and ISO, guide the metal fabrication industry, ensuring a safe working environment and product quality. Sustainable practices, such as recycling and energy efficiency, minimize environmental impact and contribute to long-term business success. Advanced metal 3D printing technologies and powder metallurgy offer opportunities for producing high-performance parts with unique geometries. Heat treatment processes, like annealing and quenching, improve material strength and properties. Precision machining techniques, such as EDM and micro-milling, create intricate micro-components with exceptional accuracy. Surface treatment methods, like anodizing and electroplating, enhance durability and protect metal components from environmental factors. Overall, the market thrives on innovation and continuous improvement, driven by technological advancements and evolving customer demands.
What are the Key Data Covered in this Metal Fabrication Market Research and Growth Report?
-
What is the expected growth of the Metal Fabrication Market between 2025 and 2029?
-
USD 13.61 billion, at a CAGR of 5.1%
-
-
What segmentation does the market report cover?
-
The report is segmented by Material (Steel, Aluminum, and Others), End-user (Manufacturing, Construction, Automotive, Energy and power, and Others), and Geography (APAC, North America, Europe, Middle East and Africa, and South America)
-
-
Which regions are analyzed in the report?
-
APAC, North America, Europe, Middle East and Africa, and South America
-
-
What are the key growth drivers and market challenges?
-
Industrial growth in emerging markets, Volatility in raw material costs
-
-
Who are the major players in the Metal Fabrication Market?
-
Aranda Tooling Inc., ArcelorMittal SA, BTD Manufacturing, Cupples J and J Co. Inc., Fabrication Engineering Maintenance, Hyundai Engineering and Construction Co. Ltd., Ironform Corp., Kapco Metal Stamping, Larsen and Toubro Ltd., Marlin Steel Wire Products LLC, Mayville Engineering Co. Inc., Meta Fab Inc., Metal Working Group, Metcam Inc., Moreng Metal Products Inc., Noble Industries, ONeal Manufacturing Services, Standard Iron, and TBK Metal Co. Ltd.
-
We can help! Our analysts can customize this metal fabrication market research report to meet your requirements.
 RIA -
RIA - 
