
Preclinical Software For Physiology Da And As Market Size and Growth Forecast 2026-2030
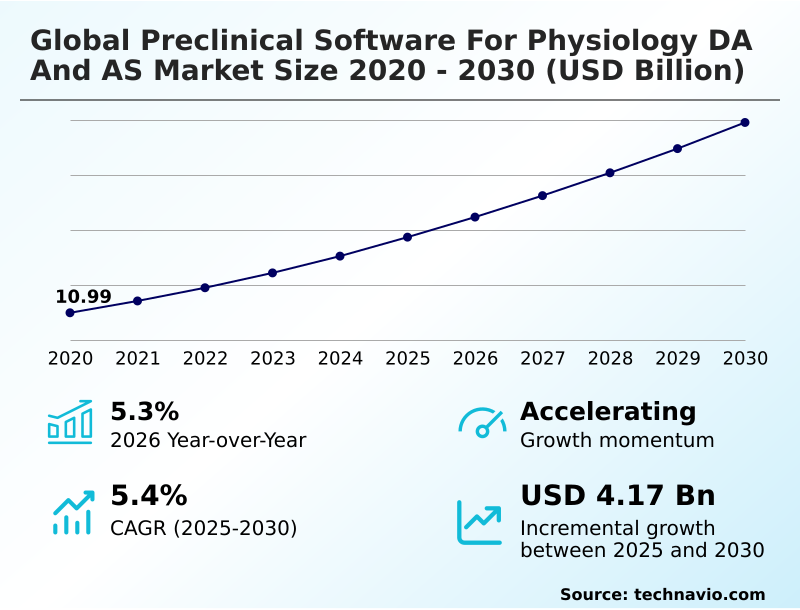
The Preclinical Software For Physiology Da And As Market size was valued at USD 13.74 billion in 2025 growing at a CAGR of 5.4% during the forecast period 2026-2030.
North America accounts for 41.3% of incremental growth during the forecast period. The Industrial labs and CROs segment by End-user was valued at USD 8.21 billion in 2024, while the On-premises segment holds the largest revenue share by Deployment.
The market is projected to grow by USD 6.92 billion from 2020 to 2030, with USD 4.17 billion of the growth expected during the forecast period of 2025 to 2030.
Get Key Insights on Market Forecast (PDF) Request Free Sample
Preclinical Software For Physiology Da And As Market Overview
The preclinical software for physiology DA and AS market is defined by the critical need to manage vast datasets from data-intensive methodologies within a stringent regulatory environment. Growth is underpinned by a significant shift away from manual data entry toward integrated hardware and software solutions that enable real-time physiological monitoring and automated behavioral analysis. In a typical contract research organization, deploying a unified digital analytics platform for a toxicology study allows for the seamless integration of telemetry data acquisition with metabolic monitoring systems. This ensures compliance with Good Laboratory Practice (GLP) requirements by providing a complete, auditable data trail from initial physiological data recording to final report generation. This digital transformation is not uniform, with North America leading adoption due to its mature biomedical research ecosystem. The focus remains on enhancing reproducibility and accelerating drug discovery processes through more sophisticated animal supervision software and analytical tools.
Drivers, Trends, and Challenges in the Preclinical Software For Physiology Da And As Market
The strategic imperative for preclinical software for physiology DA and AS is moving beyond simple data collection to encompass comprehensive, compliant research management. A key focus is on software for SEND submission compliance, as regulatory bodies like the FDA now mandate this format, fundamentally altering data handling protocols.
This has intensified the debate over cloud vs on-premise preclinical software, with contract research organizations, which constitute a significantly larger market segment than academic labs, often favoring scalable cloud solutions for their multi-client operations. For example, a CRO specializing in toxicology must implement systems capable of automating physiological data analysis workflows to manage high-throughput screening.
The integration of artificial intelligence in preclinical data interpretation is becoming a key differentiator, enabling researchers to identify subtle safety signals earlier in the drug discovery process. This requires software capable of integrating telemetry and behavioral data from disparate sources into a unified analytical view, a complex challenge that defines the current innovation frontier.
The overarching goal is to create a digital ecosystem that ensures data integrity from initial capture through to final regulatory submission.
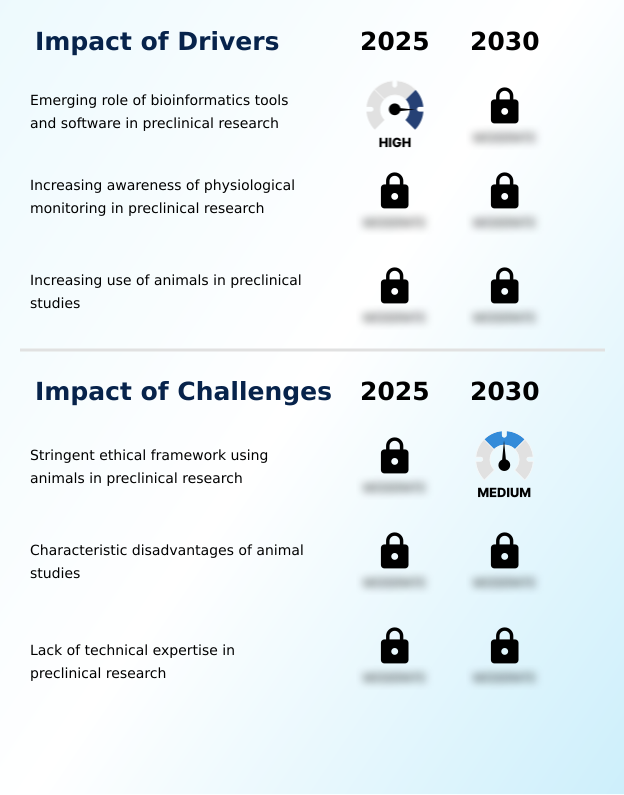
Primary Growth Driver: The emerging role of bioinformatics tools and software in preclinical research is a key driver for the market, enabling deeper insights from complex biological data.
The growing adoption of bioinformatics and data-intensive methodologies is a primary driver for the market, as modern drug discovery processes generate vast, complex datasets requiring sophisticated analysis.
The expansion of the biomedical research ecosystem, particularly in Asia where growth outpaces other regions, fuels demand for scalable software solutions.
These platforms must support advanced predictive analytics modeling and real-time monitoring of physiological signals to convert raw data into actionable insights. Consequently, research technology providers are investing in platforms that integrate electrophysiology data and support complex pharmacokinetic evaluation software.
This focus on deep analytical capability is essential for accelerating discovery timelines and improving the success rate of therapeutic candidates.
Emerging Market Trend: The rising digitalization of preclinical research is a significant market trend, characterized by the broad adoption of advanced informatics platforms to modernize laboratory operations.
The digitalization of preclinical research workflows is accelerating, marked by a decisive shift from fragmented, on-premises systems to integrated, cloud-based laboratory software. This trend is driven by the need for enhanced collaboration in multi-site collaborative projects and the management of increasingly large datasets from data-intensive methodologies.
Research organizations are adopting centralized digital repositories and laboratory information management systems to improve data integrity and traceability, which is critical for adherence to Good Laboratory Practice (GLP) requirements. The adoption of non-invasive physiological monitoring technologies, coupled with automated behavioral analysis tools, allows for more humane and efficient long-term studies, further pushing the need for robust digital infrastructure.
This move toward comprehensive digital ecosystems underpins the industry's effort to enhance reproducibility in scientific research.
Key Industry Challenge: The stringent ethical framework governing the use of animals in preclinical research presents a key challenge to industry growth, compelling a shift toward alternative testing methods.
A significant challenge confronting the market is the technical complexity and expertise required to implement and manage integrated preclinical systems, particularly for smaller research entities. Integrating disparate systems such as behavioral tracking systems, telemetry data acquisition hardware, and in vivo imaging analysis software into a cohesive workflow compliant with Good Laboratory Practice (GLP) requirements is a substantial hurdle.
This skills gap is compounded by the high costs of specialized regulatory compliance software and the ongoing need for maintenance. The inherent limitations of in silico modelling also mean that physical animal studies, guided by institutional animal care and use committee standards, remain necessary, sustaining pressure on laboratories to manage these complex, data-rich environments effectively.
Explore Full Market Dynamics Analysis Request Free Sample
Preclinical Software For Physiology Da And As Market Segmentation
The preclinical software for physiology da and as industry research report provides comprehensive data including region-wise segment analysis, with forecasts and analysis for the period 2026-2030, as well as historical data from 2020-2024 for the following segments.
End-user Segment Analysis
The industrial labs and cros segment is estimated to witness significant growth during the forecast period.
Industrial laboratories and contract research organizations (CROs) represent the primary end-user segment, driven by their central role in global pharmaceutical research and development.
This segment, accounting for a majority of market activity, heavily utilizes preclinical software for managing complex drug discovery processes. These organizations depend on specialized platforms for pharmacokinetic evaluation software and toxicology data management to support high-volume pipelines.
The operational need to streamline preclinical research workflows and adhere to stringent regulatory documentation standards fuels investment in these digital tools.
As outsourcing to contract research organizations continues, the demand for scalable and integrated systems, including SEND submission software for regulatory filings with bodies like the FDA, remains a critical procurement driver for this dominant segment.
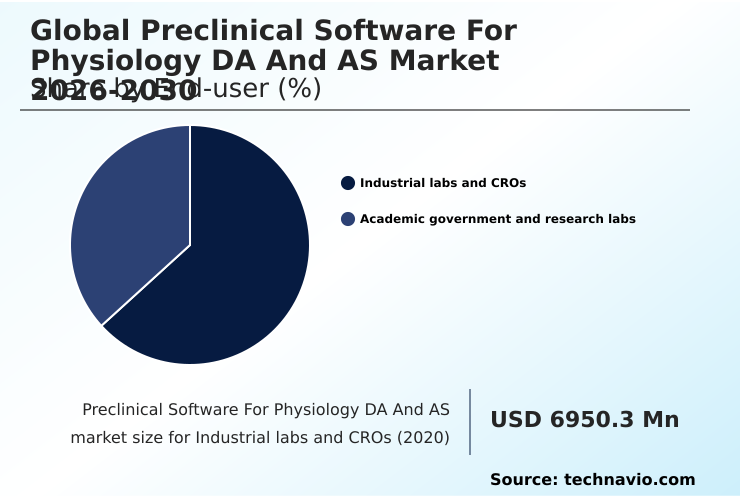
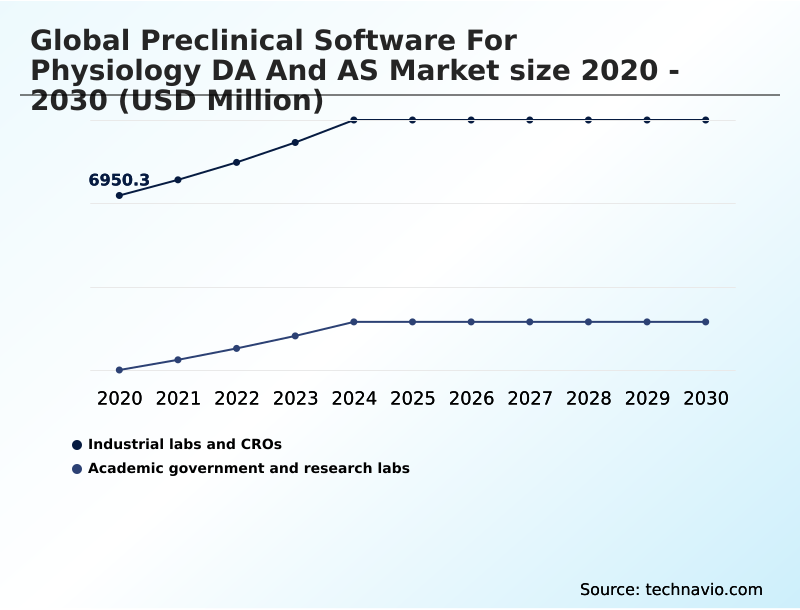
The Industrial labs and CROs segment was valued at USD 8.21 billion in 2024 and showed a gradual increase during the forecast period.
Preclinical Software For Physiology Da And As Market by Region: North America Leads with 41.3% Growth Share
North America is estimated to contribute 41.3% to the growth of the global market during the forecast period.
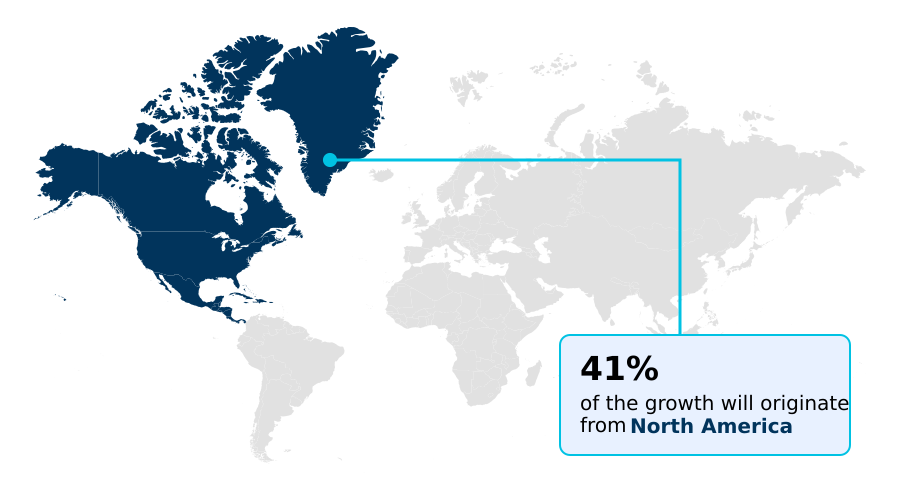
The geographic landscape is dominated by North America, which accounts for over 40% of market activity, driven by its advanced biomedical research ecosystem and high concentration of research technology providers.
This region sees robust adoption of cloud-based laboratory software, supported by stringent Institutional Animal Care and Use Committee (IACUC) protocols that necessitate advanced animal welfare supervision.
Europe follows, with significant contributions from Germany and the UK, where research adheres to strict EMA guidelines, fueling demand for regulatory compliance software.
Meanwhile, Asia is the fastest-growing region, with its expanding network of contract research organizations and investment in modern laboratory infrastructure, driving demand for platforms that support complex preclinical research workflows and data-intensive methodologies.
Customer Landscape Analysis for the Preclinical Software For Physiology Da And As Market
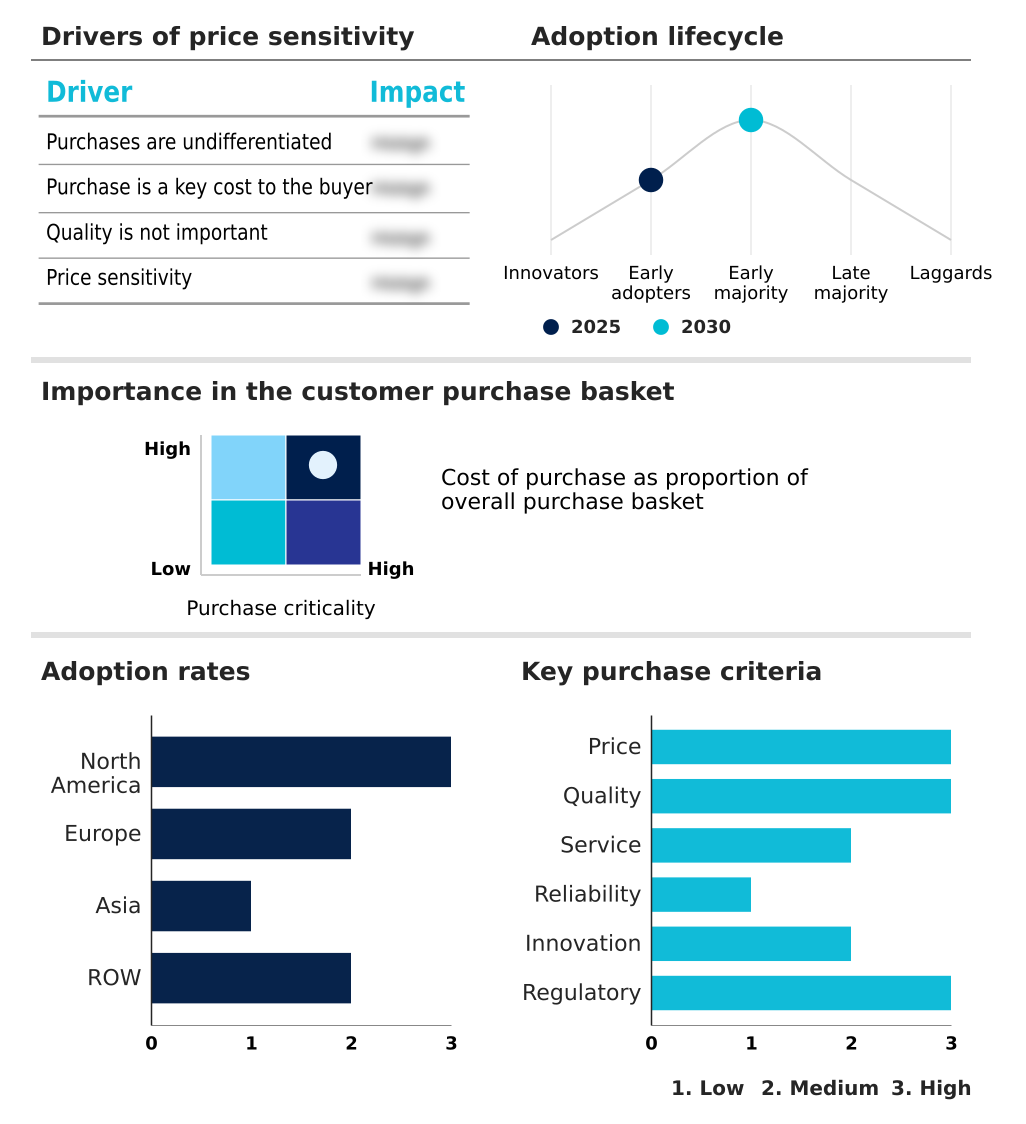
The preclinical software for physiology da and as market forecasting report includes the adoption lifecycle of the market, covering from the innovator’s stage to the laggard’s stage. It focuses on adoption rates in different regions based on penetration. Furthermore, the preclinical software for physiology da and as market report also includes key purchase criteria and drivers of price sensitivity to help companies evaluate and develop their market growth analysis strategies.
Competitive Landscape of the Preclinical Software For Physiology Da And As Market
Companies are implementing various strategies, such as strategic alliances, partnerships, mergers and acquisitions, geographical expansion, and product/service launches, to enhance their presence in the preclinical software for physiology da and as market industry.
ADInstruments Pty Ltd. - Offers integrated tools for physiological data recording and analysis, enhancing research workflows through platforms like LabChart and PowerLab.
The industry research and growth report includes detailed analyses of the competitive landscape of the market and information about key companies, including:
- ADInstruments Pty Ltd.
- BIOPAC Systems Inc.
- Bruker Corp.
- Columbus Instruments LLC
- emka TECHNOLOGIES
- ETISENSE SAS
- Harvard Bioscience Inc.
- Instem Plc
- Med Associates Inc.
- Noldus Information Technology
- PerkinElmer US LLC
- Starr Life Sciences Corp.
- Stoelting Co.
- Thermo Fisher Scientific Inc.
- TSE Systems GmbH
- UGO BASILE S.R.L.
- Xybion Digital Inc.
- Zaber Technologies Inc.
Qualitative and quantitative analysis of companies has been conducted to help clients understand the wider business environment as well as the strengths and weaknesses of key industry players. Data is qualitatively analyzed to categorize companies as pure play, category-focused, industry-focused, and diversified; it is quantitatively analyzed to categorize companies as dominant, leading, strong, tentative, and weak.
Recent Developments in the Preclinical Software For Physiology Da And As Market
- In April 2025, Simulations Plus announced its support for the United States Food and Drug Administration roadmap to reduce animal testing by advancing its modeling and simulation software for predicting drug safety and efficacy outcomes.
- In March 2025, Noldus Information Technology partnered with a leading telemetry hardware provider to launch an integrated solution that synchronizes behavioral and physiological data acquisition, enhancing data correlation for neuroscience research.
- In November 2024, Instem Plc completed the acquisition of a prominent cloud-based Laboratory Information Management System (LIMS) provider, expanding its end-to-end data management suite for preclinical studies and strengthening its regulatory compliance software portfolio.
- In January 2025, BIOPAC Systems Inc. released a new version of its AcqKnowledge software featuring AI-driven algorithms for the automated analysis of complex physiological signals, reducing manual data processing time for researchers.
Research Analyst Overview: Preclinical Software For Physiology Da And As Market
The preclinical software for physiology DA and AS market is evolving under pressure to improve the efficiency and reproducibility of drug discovery processes. The core of this evolution is the integration of AI-driven digital analytics platforms, which are transitioning from novel tools to essential components of modern preclinical research workflows.
For boardroom consideration, this shift directly impacts R&D capital expenditure, moving budget allocation from standalone hardware to integrated hardware and software ecosystems that promise higher throughput and richer data.
For instance, the adoption of automated data segmentation tools, essential for cardiovascular data analysis, is driven by the need to accelerate data processing in line with the market's average year-over-year growth of over 5%.
Decision-makers must evaluate vendors based on their ability to provide not just physiological data recording capabilities but also robust toxicology data management and SEND submission software compliant with Good Laboratory Practice (GLP) standards. This focus on end-to-end data integrity is critical for navigating the complex biomedical research ecosystem.
Dive into Technavio’s robust research methodology, blending expert interviews, extensive data synthesis, and validated models for unparalleled Preclinical Software For Physiology Da And As Market insights. See full methodology.
| Market Scope | |
|---|---|
| Page number | 291 |
| Base year | 2025 |
| Historic period | 2020-2024 |
| Forecast period | 2026-2030 |
| Growth momentum & CAGR | Accelerate at a CAGR of 5.4% |
| Market growth 2026-2030 | USD 4167.7 million |
| Market structure | Fragmented |
| YoY growth 2025-2026(%) | 5.3% |
| Key countries | US, Canada, Mexico, Germany, UK, France, Italy, The Netherlands, Spain, Russia, China, Japan, South Korea, India, Indonesia, Thailand, Singapore, Australia, Brazil, UAE, Saudi Arabia, South Africa and Turkey |
| Competitive landscape | Leading Companies, Market Positioning of Companies, Competitive Strategies, and Industry Risks |
Preclinical Software For Physiology Da And As Market: Key Questions Answered in This Report
-
What is the expected growth of the Preclinical Software For Physiology Da And As Market between 2026 and 2030?
-
The Preclinical Software For Physiology Da And As Market is expected to grow by USD 4.17 billion during 2026-2030, registering a CAGR of 5.4%. Year-over-year growth in 2026 is estimated at 5.3%%. This acceleration is shaped by emerging role of bioinformatics tools and software in preclinical research, which is intensifying demand across multiple end-use verticals covered in the report.
-
-
What segmentation does the market report cover?
-
The report is segmented by End-user (Industrial labs and CROs, and Academic government and research labs), Deployment (On-premises, and Cloud), Application (Physiology research, Drug development and safety testing, Behavioral studies, and Others) and Geography (North America, Europe, Asia, Rest of World (ROW)). Among these, the Industrial labs and CROs segment is estimated to witness significant growth during the forecast period, driven by rising adoption across key application areas. Each segment includes detailed qualitative and quantitative analysis, along with historical data from 2020-2024 and forecasts through 2030 with year-over-year growth rates.
-
-
Which regions are analyzed in the report?
-
The report covers North America, Europe, Asia and Rest of World (ROW). North America is estimated to contribute 41.3% to market growth during the forecast period. Country-level analysis includes US, Canada, Mexico, Germany, UK, France, Italy, The Netherlands, Spain, Russia, China, Japan, South Korea, India, Indonesia, Thailand, Singapore, Australia, Brazil, UAE, Saudi Arabia, South Africa and Turkey, with dedicated market size tables and year-over-year growth for each.
-
-
What are the key growth drivers and market challenges?
-
The primary driver is emerging role of bioinformatics tools and software in preclinical research, which is accelerating investment and industry demand. The main challenge is stringent ethical framework using animals in preclinical research, creating operational barriers for key market participants. The report quantifies the impact of each driver and challenge across 2026 and 2030 with comparative analysis.
-
-
Who are the major players in the Preclinical Software For Physiology Da And As Market?
-
Key vendors include ADInstruments Pty Ltd., BIOPAC Systems Inc., Bruker Corp., Columbus Instruments LLC, emka TECHNOLOGIES, ETISENSE SAS, Harvard Bioscience Inc., Instem Plc, Med Associates Inc., Noldus Information Technology, PerkinElmer US LLC, Starr Life Sciences Corp., Stoelting Co., Thermo Fisher Scientific Inc., TSE Systems GmbH, UGO BASILE S.R.L., Xybion Digital Inc. and Zaber Technologies Inc.. The report provides qualitative and quantitative analysis categorizing companies as dominant, leading, strong, tentative, and weak based on their market positioning. Company profiles include business segment analysis, SWOT assessment, key offerings, and recent strategic developments.
-
Preclinical Software For Physiology Da And As Market Research Insights
Market dynamics are increasingly shaped by the push for operational efficiency and regulatory adherence, influencing procurement decisions for preclinical research workflows. The shift toward cloud deployment models is notable, driven by the need for scalable data management and support for multi-site collaborative projects.
While on-premises deployment still holds a significant share for data control, cloud adoption facilitates the use of advanced predictive analytics modeling. For instance, platforms enabling Standard for Exchange of Nonclinical Data (SEND) submissions are becoming essential for organizations seeking FDA approval, directly impacting software selection criteria.
This transition is not merely about technology but about aligning digital infrastructure with the rigorous demands of modern drug discovery processes and ensuring data integrity and traceability throughout the research lifecycle.
We can help! Our analysts can customize this preclinical software for physiology da and as market research report to meet your requirements.
 RIA -
RIA - 
