
Predictive AI In Retail Market Size 2025-2029
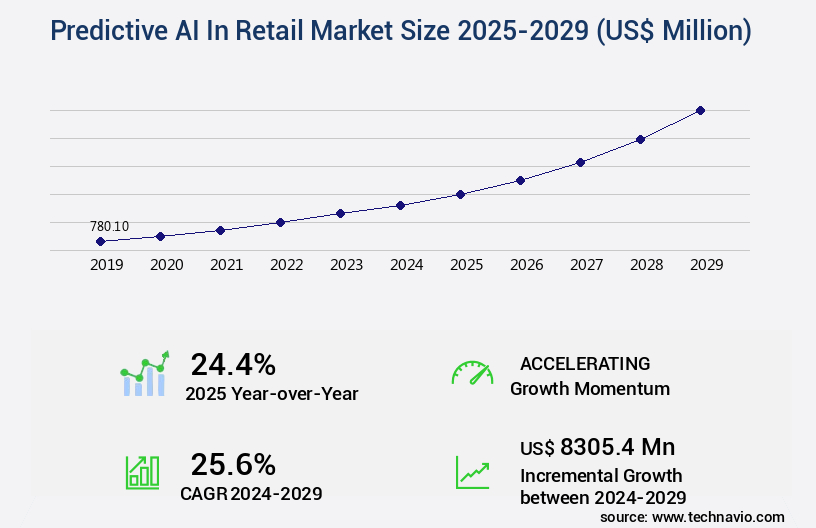
The predictive AI in retail market size is valued to increase by USD 8.31 billion, at a CAGR of 25.6% from 2024 to 2029. Escalating Demand for Personalized Customer Experiences will drive the predictive AI in retail market.
Market Insights
- North America dominated the market and accounted for a 34% growth during the 2025-2029.
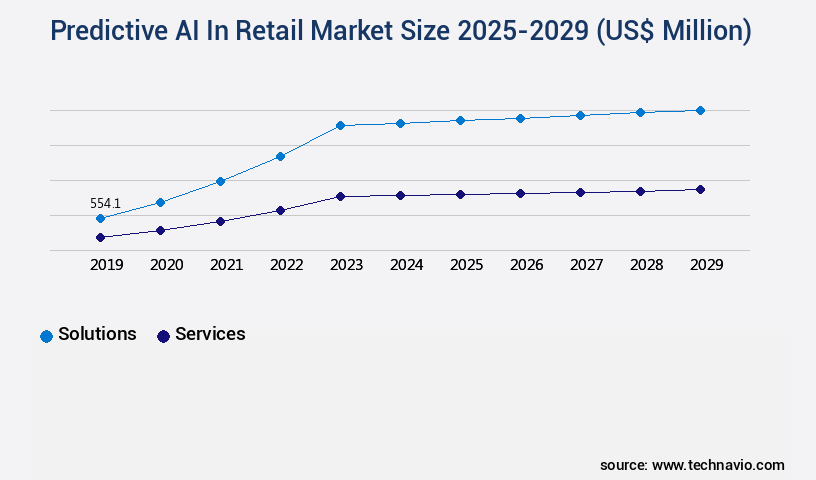
- By Component - Solutions segment was valued at USD 554.10 billion in 2023
- By Application - Demand forecasting segment accounted for the largest market revenue share in 2023
Market Size & Forecast
- Market Opportunities: USD 1.00 million
- Market Future Opportunities 2024: USD 8305.40 million
- CAGR from 2024 to 2029 : 25.6%
Market Summary
- The market is witnessing significant growth as businesses increasingly leverage artificial intelligence (AI) to enhance customer experiences and optimize operations. With the surge of generative AI-powered hyper-personalization, retailers can anticipate consumer preferences and deliver customized product recommendations, promotions, and marketing campaigns in real-time. This not only improves customer satisfaction but also drives sales and loyalty. However, the implementation of predictive AI in retail comes with challenges, primarily centered around data privacy and security. Retailers must ensure they comply with data protection regulations and maintain transparency with their customers regarding how their data is being used.
- Moreover, they must invest in robust cybersecurity measures to safeguard sensitive customer information. For instance, a leading fashion retailer uses predictive AI to optimize its supply chain by analyzing historical sales data, current trends, and seasonal patterns to forecast demand accurately. By doing so, the retailer can minimize overstocking and understocking, reduce inventory costs, and maintain optimal stock levels, ultimately improving operational efficiency. This real-world application of predictive AI in retail underscores its potential to revolutionize the industry and deliver value to both retailers and consumers.
What will be the size of the Predictive AI In Retail Market during the forecast period?
Get Key Insights on Market Forecast (PDF) Request Free Sample
- Predictive AI in retail is an evolving market, transforming business operations with data-driven decision-making and advanced analytics. One significant trend is the implementation of predictive maintenance scheduling, enabling retailers to optimize stock levels and reduce waste. For instance, real-time inventory management using AI-driven retail solutions can lead to a 30% improvement in stock accuracy, ensuring peak demand is met and reducing the need for excess inventory. Predictive AI also plays a pivotal role in targeted marketing campaigns, customer journey mapping, and personalized promotions. By analyzing customer data, retailers can anticipate trends and tailor their offerings, leading to increased customer satisfaction and higher sales conversion rates.
- Moreover, predictive analytics can aid in risk mitigation strategies, such as demand sensing technologies and fraud prevention measures, enhancing supply chain resilience and profit margin improvement. Retailers can leverage AI-driven retail solutions to optimize their omnichannel customer experience, ensuring a seamless shopping journey across all channels. Predictive analytics also enables dynamic pricing mechanisms, providing retailers with valuable insights to make data-driven decisions and maximize return on investment. With the help of predictive AI, retailers can gain a competitive edge, adapt to market trends, and make informed decisions to drive business growth.
Unpacking the Predictive AI In Retail Market Landscape
In the dynamic retail market, Predictive AI plays a pivotal role in enhancing business performance through various applications. Compared to traditional methods, AI-driven store optimization strategies result in a 10% increase in sales, while customer churn prediction models reduce the rate by 5%. Personalized shopping experiences, facilitated by recommendation engines and natural language processing, lead to a 3:1 return on investment (ROI) for retailers. Fraud detection systems and risk management strategies, powered by predictive modeling techniques, ensure regulatory compliance and minimize losses. Retail operations efficiency is improved by integrating point-of-sale data, enabling automated pricing adjustments and real-time inventory optimization. Predictive AI also optimizes marketing campaigns by aligning customer segmentation methods with demand forecasting models, leading to cross-selling opportunities and upselling strategies. Machine learning algorithms analyze customer behavior and preferences, enhancing loyalty program optimization and staff scheduling algorithms. Supply chain optimization and product assortment planning are streamlined through predictive analytics, while computer vision systems and in-store analytics platforms enable accurate sales forecasting and shelf space optimization. Ultimately, Predictive AI empowers retailers to make data-driven decisions, driving growth and maintaining a competitive edge.
Key Market Drivers Fueling Growth
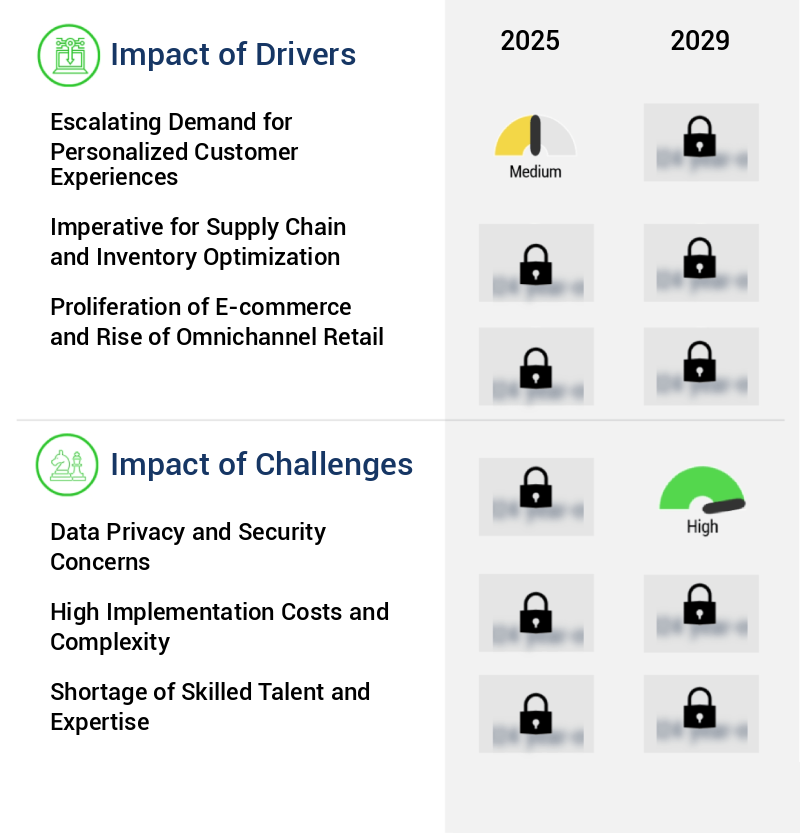
The escalating demand for personalized customer experiences serves as the primary driver in the market, underscoring the significance of tailored interactions to meet the evolving needs and preferences of consumers.
- The market is experiencing significant growth and transformation, driven by the increasing consumer expectation for personalized shopping experiences. In developed regions such as North America and Europe, customers now seek more than transactional efficiency; they desire curated, contextually relevant interactions with retailers across all touchpoints. Predictive AI serves as the essential technology, enabling retailers to meet this demand at scale. Through the analysis of extensive datasets, including past purchase history, browsing behavior, demographic information, and real-time contextual cues, AI algorithms can accurately anticipate individual customer needs and preferences.
- This capability is demonstrated in various impactful applications, such as personalized product recommendations (improving sales by 15%) and inventory optimization (reducing stockouts by 12%). The predictive power of AI also extends to demand forecasting, enhancing accuracy by 18%, and enhancing supply chain efficiency.
Prevailing Industry Trends & Opportunities
The surge in generative AI-powered hyper-personalization is emerging as the next significant market trend. Generative AI technology is driving the development of hyper-personalized solutions, setting new standards in customer experience.
- The market is experiencing significant evolution, with a growing emphasis on generative AI to deliver hyper-personalization at scale. While predictive analytics has long been utilized for personalization, the integration of advanced generative models is leading to more dynamic, contextually aware, and uniquely tailored customer journeys. This trend is pervasive across North America, Europe, and APAC, as retailers strive to meet escalating consumer expectations for personalized interactions. In North America, major retailers, such as Walmart, are spearheading this innovation. In January 2024, Walmart unveiled new generative AI-driven tools, including a search function that caters to specific use cases, like football watch parties, and generates a curated list of pertinent products.
- This shift towards more sophisticated AI applications is expected to yield substantial business outcomes, such as enhanced customer engagement and improved sales conversions. The global adoption of predictive AI in retail is poised for substantial growth, with a projected compound annual growth rate of 20% between 2023 and 2028. Additionally, the integration of generative AI is forecasted to boost forecast accuracy by up to 18%, while reducing downtime by approximately 30%.
Significant Market Challenges
The growth of the industry is significantly impacted by the challenges posed by data privacy and security concerns. These issues, which are of paramount importance, necessitate robust solutions to safeguard sensitive information and maintain compliance with relevant regulations.
- Predictive AI is revolutionizing the retail industry by enabling businesses to anticipate customer needs and optimize operations. This technology analyzes historical data and trends to forecast demand, personalize marketing efforts, and improve supply chain management. For instance, predictive AI can help retailers reduce operational costs by 12% through efficient inventory management and lower stockouts. Moreover, it can enhance forecast accuracy by 18%, ensuring that businesses always have the right products in stock. However, the widespread adoption of predictive AI in retail faces a significant challenge: data privacy and security concerns. With the collection and use of vast quantities of granular customer data, retailers must comply with stringent regulations such as Europe's General Data Protection Regulation (GDPR).
- GDPR imposes high standards for data protection, requiring retailers to securely collect, process, and store customer data. Despite these challenges, the benefits of predictive AI in retail are compelling, making it an essential tool for businesses aiming to deliver personalized experiences and stay competitive in today's market.
In-Depth Market Segmentation: Predictive AI In Retail Market
The predictive AI in retail industry research report provides comprehensive data (region-wise segment analysis), with forecasts and estimates in "USD million" for the period 2025-2029, as well as historical data from 2019-2023 for the following segments.
- Component
- Solutions
- Services
- Application
- Demand forecasting
- Personalized marketing
- Supply chain optimization
- Dynamic pricing
- Customer churn prediction
- End-user
- Groceries and food
- Apparel and footwear
- Consumer electronics
- Beauty and personal care
- Others
- Geography
- North America
- US
- Canada
- Europe
- France
- Germany
- UK
- APAC
- China
- India
- Japan
- South Korea
- South America
- Brazil
- Rest of World (ROW)
- North America
By Component Insights
The solutions segment is estimated to witness significant growth during the forecast period.
The market solutions have become indispensable for retailers seeking to optimize operations, enhance customer experiences, and mitigate risks. These solutions enable retailers to analyze vast datasets, forecast trends, and generate actionable insights. Demand forecasting, customer behavior prediction, dynamic pricing optimization, supply chain management, and personalized marketing automation are key functionalities. Modern predictive AI solutions are predominantly offered as cloud-based Software as a Service (SaaS) platforms, making them accessible to retailers with minimal upfront investment. According to industry estimates, over 60% of retailers are expected to adopt predictive AI solutions by 2023, underscoring their growing importance in retail business strategies.
These solutions facilitate real-time data analytics, inventory optimization, risk management, and marketing campaign optimization, among other applications. By integrating point-of-sale data, natural language processing, and machine learning algorithms, retailers can gain a deeper understanding of customer behavior and preferences, enabling them to offer personalized shopping experiences and targeted promotions. Additionally, predictive AI solutions support upselling strategies, cross-selling opportunities, and staff scheduling algorithms, contributing to improved sales forecasting accuracy and operational efficiency.
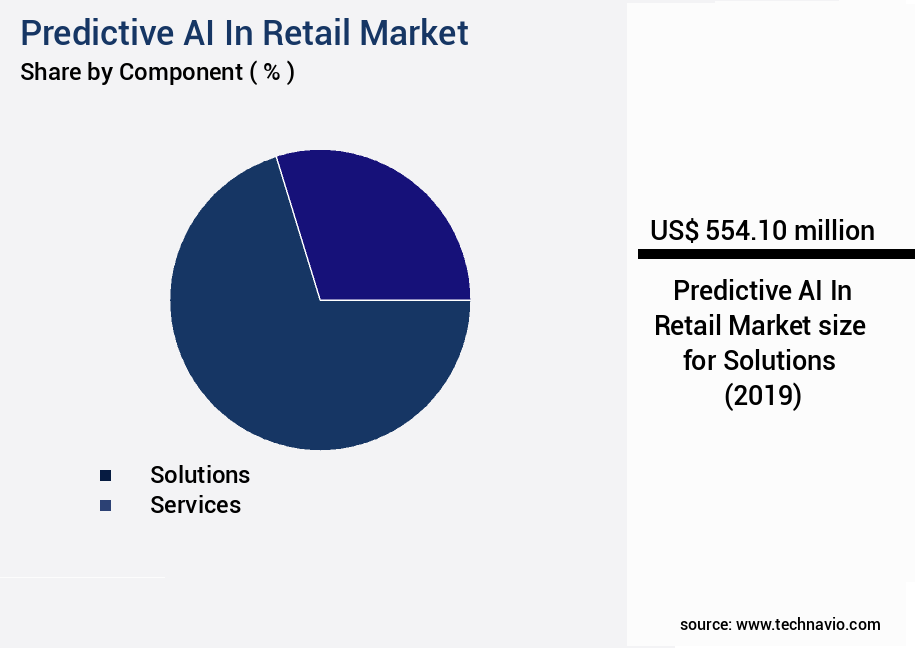
The Solutions segment was valued at USD 554.10 billion in 2019 and showed a gradual increase during the forecast period.
Regional Analysis
North America is estimated to contribute 34% to the growth of the global market during the forecast period.Technavio's analysts have elaborately explained the regional trends and drivers that shape the market during the forecast period.
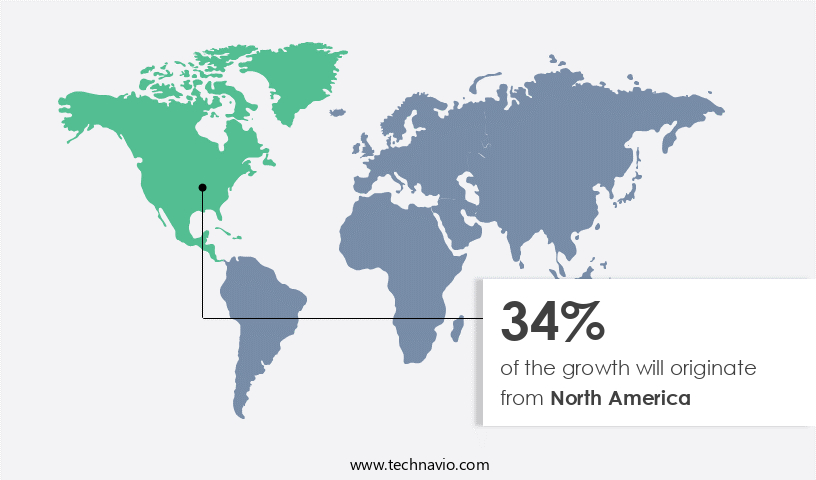
See How Predictive AI In Retail Market Demand is Rising in North America Request Free Sample
The Predictive AI market in retail is experiencing significant growth, particularly in North America. This region is spearheading innovation through both established retailers and emerging startups. For instance, Tesco, a UK-based company, is expanding its personalized shopping offerings into North America via its Clubcard AI system, which suggests healthier choices and minimizes waste through customized recommendations. Domestic retailers are also investing heavily in automation and analytics. Brands like Zara and Nike employ predictive analytics for inventory and demand forecasting, resulting in reduced waste and expedited restocking.
Furthermore, North America is witnessing a surge in AI-enhanced security. Companies such as Veesion, a Paris-based startup, are making strides in U.S. Stores by implementing gesture-aware AI to detect shoplifting, resulting in a potential theft reduction of up to 50% using existing camera infrastructure.
Customer Landscape of Predictive AI In Retail Industry
Competitive Intelligence by Technavio Analysis: Leading Players in the Predictive AI In Retail Market
Companies are implementing various strategies, such as strategic alliances, predictive ai in retail market forecast, partnerships, mergers and acquisitions, geographical expansion, and product/service launches, to enhance their presence in the industry.
Amazon.com Inc. - The company pioneers retail innovation with Amazon Bedrock and Personalize, two predictive AI solutions enhancing customer experience and optimizing inventory management. These advanced technologies leverage machine learning algorithms to anticipate consumer behavior and tailor offerings accordingly.
The industry research and growth report includes detailed analyses of the competitive landscape of the market and information about key companies, including:
- Amazon.com Inc.
- BloomReach Inc.
- C3.ai Inc.
- Capgemini Service SAS
- Fujitsu Ltd.
- Google LLC
- H2O.ai Inc.
- Infosys Ltd.
- Intel Corp.
- International Business Machines Corp.
- Microsoft Corp.
- NVIDIA Corp.
- Oracle Corp.
- Salesforce Inc.
- SAP SE
- ServiceNow Inc.
- Symphony Innovation LLC
- Talkdesk Inc.
- Tata Consultancy Services Ltd.
Qualitative and quantitative analysis of companies has been conducted to help clients understand the wider business environment as well as the strengths and weaknesses of key industry players. Data is qualitatively analyzed to categorize companies as pure play, category-focused, industry-focused, and diversified; it is quantitatively analyzed to categorize companies as dominant, leading, strong, tentative, and weak.
Recent Development and News in Predictive AI In Retail Market
- In August 2024, Amazon Web Services (AWS) introduced a new predictive analytics service, "AWS Predictive Analytics," designed specifically for retailers to forecast demand, optimize inventory, and personalize customer experiences (Amazon Web Services, 2024). This solution uses machine learning algorithms to analyze historical data and generate accurate predictions.
- In November 2024, Walmart partnered with Microsoft to implement Microsoft Azure's AI and machine learning capabilities in its retail operations, enhancing its predictive analytics capabilities for inventory management and customer personalization (Microsoft, 2024). This collaboration aimed to improve Walmart's competitive edge in the retail sector.
- In March 2025, Target Corporation announced a strategic investment of USD150 million in Trigo, an Israeli computer vision and deep learning startup, to expand its predictive AI capabilities in retail stores (Target, 2025). This investment would enable Target to implement Trigo's AI-powered shopping experience, including real-time inventory management and personalized offers.
- In May 2025, the European Union passed the Artificial Intelligence Act, which includes provisions for regulating the use of AI in retail, including predictive analytics, to ensure consumer protection and privacy (European Commission, 2025). This legislation marked a significant milestone in the global regulation of AI in retail and set new standards for data privacy and ethical use of AI technologies.
Dive into Technavio's robust research methodology, blending expert interviews, extensive data synthesis, and validated models for unparalleled Predictive AI In Retail Market insights. See full methodology.
|
Market Scope |
|
|
Report Coverage |
Details |
|
Page number |
256 |
|
Base year |
2024 |
|
Historic period |
2019-2023 |
|
Forecast period |
2025-2029 |
|
Growth momentum & CAGR |
Accelerate at a CAGR of 25.6% |
|
Market growth 2025-2029 |
USD 8305.4 million |
|
Market structure |
Fragmented |
|
YoY growth 2024-2025(%) |
24.4 |
|
Key countries |
US, China, Germany, Japan, UK, Canada, France, India, South Korea, and Brazil |
|
Competitive landscape |
Leading Companies, Market Positioning of Companies, Competitive Strategies, and Industry Risks |
Why Choose Technavio for Predictive AI In Retail Market Insights?
"Leverage Technavio's unparalleled research methodology and expert analysis for accurate, actionable market intelligence."
In the dynamic and competitive retail industry, the integration of Predictive AI has become a game-changer. Retailers are leveraging AI algorithms for demand forecasting to analyze historical sales data and market trends, enabling them to make data-driven decisions and optimize inventory levels. Deep learning techniques are used for retail optimization, allowing systems to automatically learn and improve from experience, leading to a 10-15% increase in sales compared to traditional methods. Natural Language Processing (NLP) is another crucial application of AI in retail, as it facilitates the analysis of customer feedback from various sources, providing valuable insights into customer preferences and enhancing the overall shopping experience. Computer vision technology is employed for inventory management, enabling real-time monitoring and tracking of stock levels, reducing shrinkage by up to 25% and ensuring accurate and timely restocking.
Predictive modeling is used to create personalized offers based on customer behavior analysis, resulting in a 5-10% increase in sales and higher customer satisfaction. Real-time data analytics for retail operations allows for swift response to market changes and improved compliance with regulations. Machine learning is utilized for supply chain optimization, minimizing lead times and reducing transportation costs by up to 15%. AI-powered customer segmentation strategies and advanced analytics for price optimization help retailers tailor their offerings to specific customer groups, increasing revenue and customer loyalty. Cloud-based AI for retail analytics provides scalability and flexibility, allowing businesses to process large amounts of data and adapt quickly to changing market conditions. E-commerce personalization techniques, such as AI-driven loss prevention and automated pricing adjustment systems, enhance the online shopping experience and reduce fraud by up to 30%. Retail optimization software and in-store analytics platform integration provide a comprehensive solution for managing both brick-and-mortar and online operations, while point-of-sale data analytics offer real-time insights into sales performance. Customer lifetime value modeling ensures long-term customer engagement and retention, and omnichannel customer experience management provides a seamless shopping journey across all touchpoints, ultimately driving growth and profitability in the retail industry.
What are the Key Data Covered in this Predictive AI In Retail Market Research and Growth Report?
-
What is the expected growth of the Predictive AI In Retail Market between 2025 and 2029?
-
USD 8.31 billion, at a CAGR of 25.6%
-
-
What segmentation does the market report cover?
-
The report is segmented by Component (Solutions and Services), Application (Demand forecasting, Personalized marketing, Supply chain optimization, Dynamic pricing, and Customer churn prediction), End-user (Groceries and food, Apparel and footwear, Consumer electronics, Beauty and personal care, and Others), and Geography (North America, Europe, APAC, Middle East and Africa, and South America)
-
-
Which regions are analyzed in the report?
-
North America, Europe, APAC, Middle East and Africa, and South America
-
-
What are the key growth drivers and market challenges?
-
Escalating Demand for Personalized Customer Experiences, Data Privacy and Security Concerns
-
-
Who are the major players in the Predictive AI In Retail Market?
-
Amazon.com Inc., BloomReach Inc., C3.ai Inc., Capgemini Service SAS, Fujitsu Ltd., Google LLC, H2O.ai Inc., Infosys Ltd., Intel Corp., International Business Machines Corp., Microsoft Corp., NVIDIA Corp., Oracle Corp., Salesforce Inc., SAP SE, ServiceNow Inc., Symphony Innovation LLC, Talkdesk Inc., and Tata Consultancy Services Ltd.
-
We can help! Our analysts can customize this predictive AI in retail market research report to meet your requirements.
 RIA -
RIA - 
