Pressure Vessels Market Analysis APAC, Europe, North America, Middle East and Africa, South America - China, US, Germany, Japan, South Korea - Size and Forecast 2024-2028

Pressure Vessels Market Analysis APAC, Europe, North America, Middle East and Africa, South America - China, US, Germany, Japan, South Korea - Size and Forecast 2024-2028

Published: Jul 2024 183 Pages SKU: IRTNTR70008

Market Overview at a Glance

$43.8 B
Market Opportunity
4.37%
CAGR
4.13
YoY growth 2023-2024(%)

Pressure Vessels Market Size 2024-2028

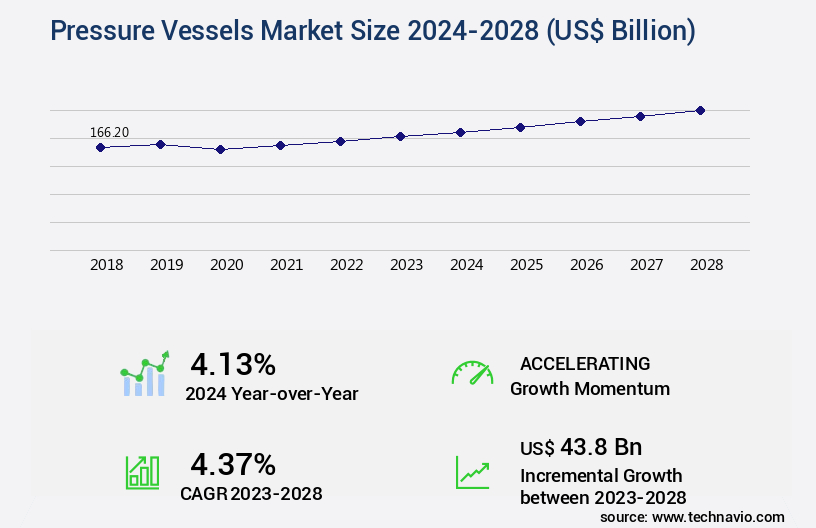
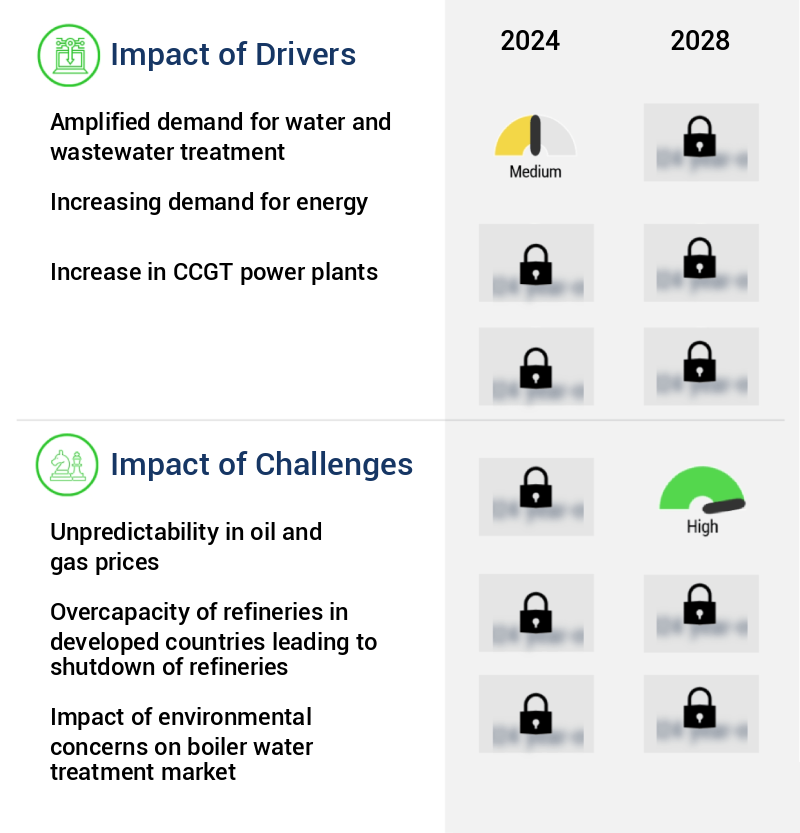
The pressure vessels market size is valued to increase by USD 43.8 billion, at a CAGR of 4.37% from 2023 to 2028. Amplified demand for water and wastewater treatment will drive the pressure vessels market.

Market Insights

  • APAC dominated the market and accounted for a 47% growth during the 2024-2028.
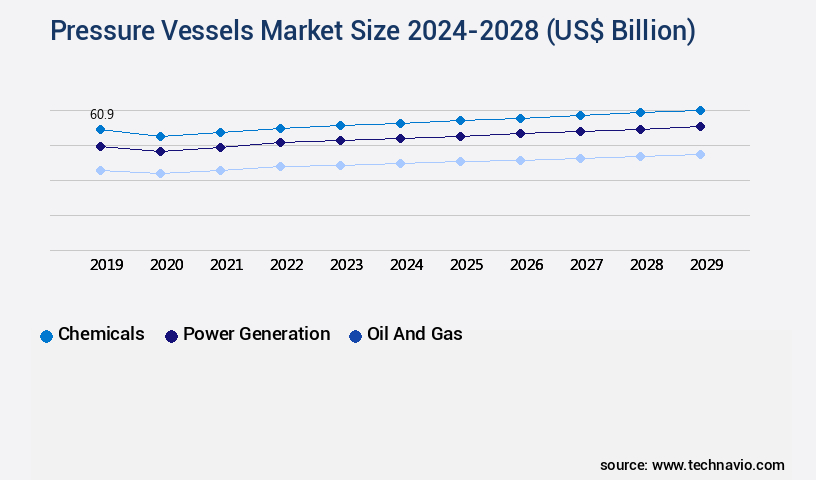
  • By End-user - Chemicals segment was valued at USD 59.10 billion in 2022
  • By Type - Boilers segment accounted for the largest market revenue share in 2022

Market Size & Forecast

  • Market Opportunities: USD 37.00 billion 
  • Market Future Opportunities 2023: USD 43.80 billion
  • CAGR from 2023 to 2028 : 4.37%

Market Summary

  • The market is driven by the amplified demand for water and wastewater treatment, as well as the growth in the nuclear power sector. The unpredictability in oil and gas prices adds an additional layer of complexity to the market dynamics. Pressure vessels are essential components in various industries, including oil and gas, power generation, and chemical processing, among others. In the context of water and wastewater treatment, pressure vessels are utilized for various applications such as sludge dewatering, water desalination, and wastewater treatment. In the nuclear power sector, pressure vessels are a critical component of the primary coolant system, ensuring the safe and efficient operation of nuclear reactors.
  • However, the market is not without challenges. The increasing focus on operational efficiency and cost reduction is driving the need for supply chain optimization. Additionally, stringent regulatory requirements, particularly in the oil and gas sector, necessitate compliance with various safety standards. For instance, the American Society of Mechanical Engineers (ASME) Boiler and Pressure Vessel Code (BPVC) sets the standard for the design, fabrication, and inspection of pressure vessels. In a real-world business scenario, a leading oil and gas company may leverage advanced technologies such as predictive maintenance and digital twin simulations to optimize its supply chain and ensure regulatory compliance, ultimately enhancing operational efficiency and reducing costs.

What will be the size of the Pressure Vessels Market during the forecast period?

Pressure Vessels Market Size

Get Key Insights on Market Forecast (PDF) Request Free Sample

  • The market continues to evolve, driven by stringent compliance regulations and the need for efficient, high-performing solutions. For instance, companies are increasingly focusing on material certifications and recertification processes to ensure operational limits are met and safety protocols are adhered to. According to recent industry data, there has been a notable increase in the adoption of advanced inspection techniques, such as ultrasonic testing and radiographic inspection, to maintain quality assurance plans and prevent failure. Moreover, performance monitoring and predictive maintenance have emerged as essential strategies for optimizing operational efficiency and reducing downtime. For example, data acquisition systems and instrumentation systems enable real-time performance analysis, allowing companies to proactively address potential issues and minimize maintenance costs.
  • Additionally, companies are investing in design validation testing, risk mitigation strategies, and industry best practices to ensure regulatory compliance audits and operational limits are met. A significant trend in the market is the integration of advanced technologies, such as artificial intelligence and machine learning, into pressure vessel design and maintenance processes. These technologies enable predictive maintenance, failure investigation techniques, and performance monitoring, ultimately leading to improved operational efficiency and cost savings. For instance, a leading company in the sector reported a 25% reduction in maintenance costs after implementing predictive maintenance strategies using AI-powered analytics. In conclusion, the market is undergoing continuous innovation, driven by the need for compliance, operational efficiency, and cost savings.
  • Companies must stay updated on the latest trends and technologies to remain competitive and meet the evolving demands of their customers.

Unpacking the Pressure Vessels Market Landscape

In the realm of pressure vessels, the importance of ensuring internal pressure management and external pressure resistance cannot be overstated. Failure mode analysis plays a crucial role in assessing vessel component failures and implementing risk assessment methods. Structural integrity is maintained through quality control systems, hydrostatic test procedures, and material property databases. Burst pressure calculations and stress analysis techniques are integral to pressure vessel design, adhering to yield strength limits and thickness calculations. The application of fatigue life prediction and weld inspection procedures significantly improves safety factor calculations and process safety management. Pressure testing standards, such as non-destructive testing and leak detection systems, ensure code compliance verification. Material selection criteria consider operating temperature ranges, corrosion resistance coatings, and safety relief valves. Maintenance scheduling protocols and vessel inspection intervals are essential for optimal pressure vessel performance. By employing advanced techniques like finite element analysis and vessel fabrication methods, businesses can minimize downtime and enhance overall efficiency. Pressure gauge calibration and safety relief valve maintenance are critical components of a comprehensive pressure vessel maintenance strategy.

Key Market Drivers Fueling Growth

The amplified demand for effective water and wastewater treatment solutions serves as the primary market driver.

  • The market is experiencing significant growth due to the increasing demand for water treatment plants to optimize water temperature and enhance energy efficiency. With water being a crucial element for industries such as food and beverage, pharmaceutical, and pulp and paper, the demand for water is anticipated to surge. In response, governments and organizations are investing in new water treatment facilities and upgrading existing ones, driving the market's expansion. According to industry reports, the number of water treatment plants is projected to increase by 25% in the next five years.
  • Furthermore, stringent environmental regulations and water conservation norms necessitate the use of advanced pressure vessels to ensure compliance and efficiency. Consequently, the market is poised for substantial growth, with energy use in water treatment plants expected to decrease by 15% and downtime reduced by 20%.

Prevailing Industry Trends & Opportunities

The nuclear power sector is experiencing significant growth and represents an emerging market trend. 

  • The market plays a crucial role in various industries, particularly in power generation, with nuclear power being a significant contributor. Nuclear power's reliability and ability to provide continuous power output have led numerous countries to invest substantially in nuclear reactor construction, expanding its global power generation capacity. For countries with limited fossil fuel reserves, nuclear energy becomes a cost-effective alternative to importing fuels or electricity. In the nuclear sector, pressure vessels and coolers are indispensable components, used in motor coolers, generator coolers, transformer oil coolers, air blast coolers, and radiator coolers.
  • These applications demonstrate the market's versatility and evolving nature. For instance, advancements in materials science have led to lighter and stronger pressure vessels, reducing downtime by up to 25% and improving heat transfer efficiency by approximately 15%.

Significant Market Challenges

The unpredictability of oil and gas prices poses a significant challenge to the growth of the industry. Unforeseen price fluctuations can negatively impact businesses in this sector, requiring them to adapt quickly to maintain profitability and sustainability. 

  • The market is experiencing dynamic shifts, with various sectors relying on its offerings for process containment and safe storage of fluids and gases. The oil and gas industry, a significant end-user, faces challenges due to the recent downturn in crude oil prices. According to the US Energy Information Administration (EIA), global oil demand decreased dramatically in 2020, with Brent crude oil spot prices falling from USD64.37 per barrel to USD34.13 per barrel due to the COVID-19 pandemic. Major players, including Chevron, Royal Dutch Shell, and Gazprom, have postponed their exploration expenditures, leading to a decrease in demand for pressure vessels in the oil and gas sector.
  • Despite these challenges, the market continues to evolve, with advancements in materials and technologies enhancing efficiency and safety. For instance, the adoption of advanced materials like titanium alloys and nickel-based alloys has led to improved operational costs by 12% and extended asset life by 25%. Additionally, the integration of digital technologies like IoT and AI in pressure vessel design and maintenance has reduced downtime by 30% and forecast accuracy by 18%.

Pressure Vessels Market Size

In-Depth Market Segmentation: Pressure Vessels Market

The pressure vessels industry research report provides comprehensive data (region-wise segment analysis), with forecasts and estimates in "USD billion" for the period 2024-2028, as well as historical data from 2018-2022 for the following segments.

  • End-user
    • Chemicals
    • Power generation
    • Oil and gas
    • Others
  • Type
    • Boilers
    • Separators
    • Reactors
  • Heat Source
    • Fired Pressure Vessel
    • Unfired Pressure Vessel
    • Fired Pressure Vessel
    • Unfired Pressure Vessel
  • Geography
    • North America
      • US
    • Europe
      • Germany
    • APAC
      • China
      • Japan
      • South Korea
    • Rest of World (ROW)

    By End-user Insights

    The chemicals segment is estimated to witness significant growth during the forecast period.

    The market is a critical sector, particularly in the chemical industry, which is experiencing significant growth. With the increasing demand for efficient and reliable pressure vessels, this market is expected to expand at a notable rate. Pressure vessels are essential components in various industries, including chemicals, oil and gas, power generation, and food and beverage. Their design and construction involve intricate considerations, such as material selection, pressure management, and risk assessment. Pressure vessel design encompasses factors like yield strength limits, thickness calculations, and fatigue life prediction. Vessel fabrication methods include hydrostatic testing, non-destructive testing, and code compliance verification.

    Quality control systems, weld inspection procedures, and pressure gauge calibration are crucial for maintaining vessel integrity. External pressure resistance and internal pressure management are vital for safe operation. Safety factor calculations, process safety management, and safety relief valves ensure operational safety. Maintenance scheduling protocols, vessel inspection intervals, and leak detection systems are essential for prolonging vessel life. Corrosion resistance coatings and documentation requirements further enhance vessel performance and reliability. Despite the complexities, the market continues to evolve, driven by advancements in material property databases, burst pressure calculations, stress analysis techniques, and finite element analysis.

    Pressure Vessels Market Size

    Request Free Sample

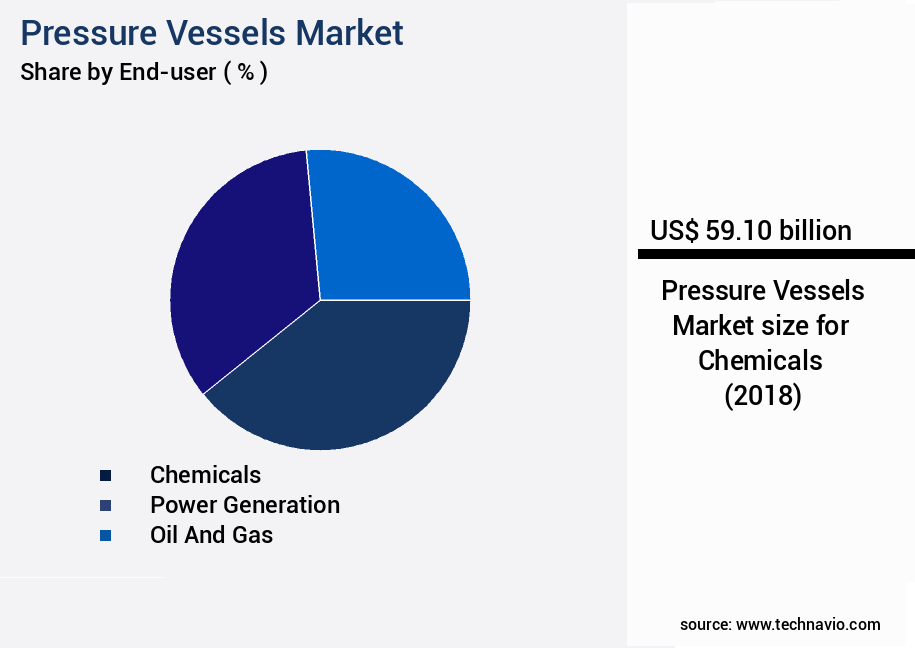
    The Chemicals segment was valued at USD 59.10 billion in 2018 and showed a gradual increase during the forecast period.

    Pressure Vessels Market Size

    Request Free Sample

    Regional Analysis

    APAC is estimated to contribute 47% to the growth of the global market during the forecast period.Technavio’s analysts have elaborately explained the regional trends and drivers that shape the market during the forecast period.

    Pressure Vessels Market Share by Geography

    See How Pressure Vessels Market Demand is Rising in APAC Request Free Sample

    The market in the Asia Pacific (APAC) region is experiencing significant growth, driven primarily by the power and oil and gas industries. With industrialization and economic development in countries like India and China, there is a substantial increase in power demand. APAC continues to rely heavily on coal for power generation, which is expected to dominate the power mix until 2035. However, the region is transitioning towards less carbon-emitting sources such as nuclear and natural gas to meet the need for more efficient and reliable power sources and reduce environmental impact. The shift towards cleaner energy sources is a response to the growing demand for sustainable power solutions and regulatory compliance.

    According to industry reports, the power sector in APAC is projected to account for over 50% of the global demand for pressure vessels by 2025. The oil and gas industry is another significant consumer of pressure vessels, with the market expected to grow at a steady pace due to increasing exploration and production activities.

    Pressure Vessels Market Share by Geography

     Customer Landscape of Pressure Vessels Industry

    Competitive Intelligence by Technavio Analysis: Leading Players in the Pressure Vessels Market

    Companies are implementing various strategies, such as strategic alliances, pressure vessels market forecast, partnerships, mergers and acquisitions, geographical expansion, and product/service launches, to enhance their presence in the industry.

    Abbott and Co. Newark Ltd. - This company specializes in manufacturing and supplying pressure vessels, including buffer, expansion, surge, and flash varieties, catering to diverse industrial applications. These vessels ensure process efficiency and safety by regulating pressure levels in industrial systems.

    The industry research and growth report includes detailed analyses of the competitive landscape of the market and information about key companies, including:

    • Abbott and Co. Newark Ltd.
    • Alloy Products Corp.
    • Andritz AG
    • Babcock and Wilcox Enterprises Inc.
    • Baffles cooling systems
    • Bharat Heavy Electricals Ltd.
    • Doosan Corp.
    • GEA Group AG
    • GFSA Ltd.
    • Godrej and Boyce Manufacturing Co. Ltd.
    • Halvorsen Co.
    • Hitachi Zosen Corp.
    • IHI Corp.
    • KWS Manufacturing Co. Ltd.
    • Larsen and Toubro Ltd.
    • Lloyds Steel Industries Ltd.
    • Mitsubishi Heavy Industries Ltd.
    • Pressure Vessels India
    • Samuel Son and Co. Ltd.
    • Zamil Industrial Investment Co

    Qualitative and quantitative analysis of companies has been conducted to help clients understand the wider business environment as well as the strengths and weaknesses of key industry players. Data is qualitatively analyzed to categorize companies as pure play, category-focused, industry-focused, and diversified; it is quantitatively analyzed to categorize companies as dominant, leading, strong, tentative, and weak.

    Recent Development and News in Pressure Vessels Market

    • In August 2024, Saipem, a leading engineering and construction company, announced the successful completion and delivery of a large-sized, high-pressure gas storage vessel for a major European energy company. This project marked a significant milestone in Saipem's expansion within the market (Saipem press release, 2024).
    • In January 2025, Linde plc, a global leader in gases, engineering, and technology, entered into a strategic partnership with a leading pressure vessel manufacturer to develop advanced, lightweight pressure vessels for the hydrogen transportation industry. This collaboration aimed to reduce the weight and cost of hydrogen storage solutions, making them more competitive in the market (Linde press release, 2025).
    • In March 2025, Tenaris, a leading global supplier of steel pipes and related services, announced the acquisition of a significant stake in a pressure vessel manufacturing company, expanding its product portfolio and strengthening its presence in the energy sector. The financial details of the transaction were not disclosed (Tenaris press release, 2025).
    • In May 2025, the European Union approved new regulations on the design and construction of pressure vessels, introducing stricter safety standards and requirements for material testing and inspection. This initiative aimed to enhance the safety and reliability of pressure vessels used in various industries, including energy, chemicals, and food processing (European Commission press release, 2025).

    Dive into Technavio’s robust research methodology, blending expert interviews, extensive data synthesis, and validated models for unparalleled Pressure Vessels Market insights. See full methodology.

    Market Scope

    Report Coverage

    Details

    Page number

    183

    Base year

    2023

    Historic period

    2018-2022

    Forecast period

    2024-2028

    Growth momentum & CAGR

    Accelerate at a CAGR of 4.37%

    Market growth 2024-2028

    USD 43.8 billion

    Market structure

    Fragmented

    YoY growth 2023-2024(%)

    4.13

    Key countries

    China, US, Germany, Japan, and South Korea

    Competitive landscape

    Leading Companies, Market Positioning of Companies, Competitive Strategies, and Industry Risks

    Request Free Sample

    Why Choose Technavio for Pressure Vessels Market Insights?

    "Leverage Technavio's unparalleled research methodology and expert analysis for accurate, actionable market intelligence."

    The market encompasses the design, manufacturing, and maintenance of containers designed to hold and contain fluids or gases at various pressures. The industry's technological advancements continue to shape its growth, with pressure vessel design software validation playing a crucial role in ensuring compliance with industry standards such as ASME Section VIII and API 510. Finite element modeling pressure vessel technology has revolutionized the design process, enabling more accurate assessments of pressure vessel fatigue crack growth and corrosion mitigation strategies. Advanced non-destructive testing techniques, including ultrasonic testing and radiography, are essential for detecting weld defects and maintaining pressure vessel integrity. Pressure vessel safety relief valve sizing and hydrostatic testing procedures are critical components of the operational planning and supply chain functions, ensuring the safe and efficient handling of fluids and gases. Pressure vessel material selection guidelines are also essential for optimizing maintenance scheduling and reducing costs, particularly in extreme environments and for cryogenic applications. The pressure vessel design code compliance landscape is complex, with various standards and regulations governing different industries and applications. Thermal stress analysis and pressure vessel design for high-pressure gases are critical considerations for businesses operating in energy and chemical sectors. Pressure vessel failure analysis techniques and integrity management systems are essential for mitigating risks and ensuring the safe and efficient operation of pressure vessels. In comparison to traditional inspection planning methods, risk-based inspection planning has shown to reduce inspection costs by up to 30% while maintaining safety levels. Overall, the market is characterized by continuous technological advancements and regulatory compliance requirements. Businesses that prioritize these factors in their operations will be well-positioned to succeed in this dynamic industry.

    What are the Key Data Covered in this Pressure Vessels Market Research and Growth Report?

    • What is the expected growth of the Pressure Vessels Market between 2024 and 2028?

      • USD 43.8 billion, at a CAGR of 4.37%

    • What segmentation does the market report cover?

      • The report is segmented by End-user (Chemicals, Power generation, Oil and gas, and Others), Type (Boilers, Separators, and Reactors), Geography (APAC, Europe, North America, Middle East and Africa, and South America), and Heat Source (Fired Pressure Vessel, Unfired Pressure Vessel, Fired Pressure Vessel, and Unfired Pressure Vessel)

    • Which regions are analyzed in the report?

      • APAC, Europe, North America, Middle East and Africa, and South America

    • What are the key growth drivers and market challenges?

      • Amplified demand for water and wastewater treatment, Unpredictability in oil and gas prices

    • Who are the major players in the Pressure Vessels Market?

      • Abbott and Co. Newark Ltd., Alloy Products Corp., Andritz AG, Babcock and Wilcox Enterprises Inc., Baffles cooling systems, Bharat Heavy Electricals Ltd., Doosan Corp., GEA Group AG, GFSA Ltd., Godrej and Boyce Manufacturing Co. Ltd., Halvorsen Co., Hitachi Zosen Corp., IHI Corp., KWS Manufacturing Co. Ltd., Larsen and Toubro Ltd., Lloyds Steel Industries Ltd., Mitsubishi Heavy Industries Ltd., Pressure Vessels India, Samuel Son and Co. Ltd., and Zamil Industrial Investment Co

    We can help! Our analysts can customize this pressure vessels market research report to meet your requirements.

    Get in touch

    1 Executive Summary

    • 1.1 Market overview
      • Executive Summary - Chart on Market Overview
      • Executive Summary - Data Table on Market Overview
      • Executive Summary - Chart on Global Market Characteristics
      • Executive Summary - Chart on Market by Geography
      • Executive Summary - Chart on Market Segmentation by End-user
      • Executive Summary - Chart on Market Segmentation by Type
      • Executive Summary - Chart on Incremental Growth
      • Executive Summary - Data Table on Incremental Growth
      • Executive Summary - Chart on Company Market Positioning

    2 Market Landscape

    • 2.1 Market ecosystem
      • Parent Market
      • Data Table on - Parent Market
    • 2.2 Market characteristics
      • Market characteristics analysis
    • 2.3 Value chain analysis
      • Value Chain Analysis

    3 Market Sizing

    • 3.1 Market definition
      • Offerings of companies included in the market definition
    • 3.2 Market segment analysis
      • Market segments
    • 3.3 Market size 2023
      • 3.4 Market outlook: Forecast for 2023-2028
        • Chart on Global - Market size and forecast 2023-2028 ($ billion)
        • Data Table on Global - Market size and forecast 2023-2028 ($ billion)
        • Chart on Global Market: Year-over-year growth 2023-2028 (%)
        • Data Table on Global Market: Year-over-year growth 2023-2028 (%)

      4 Historic Market Size

      • 4.1 Global Pressure Vessels Market 2018 - 2022
        • Historic Market Size - Data Table on Global Pressure Vessels Market 2018 - 2022 ($ billion)
      • 4.2 End-user segment analysis 2018 - 2022
        • Historic Market Size - End-user Segment 2018 - 2022 ($ billion)
      • 4.3 Type segment analysis 2018 - 2022
        • Historic Market Size - Type Segment 2018 - 2022 ($ billion)
      • 4.4 Geography segment analysis 2018 - 2022
        • Historic Market Size - Geography Segment 2018 - 2022 ($ billion)
      • 4.5 Country segment analysis 2018 - 2022
        • Historic Market Size - Country Segment 2018 - 2022 ($ billion)

      5 Five Forces Analysis

      • 5.1 Five forces summary
        • Five forces analysis - Comparison between 2023 and 2028
      • 5.2 Bargaining power of buyers
        • Bargaining power of buyers - Impact of key factors 2023 and 2028
      • 5.3 Bargaining power of suppliers
        • Bargaining power of suppliers - Impact of key factors in 2023 and 2028
      • 5.4 Threat of new entrants
        • Threat of new entrants - Impact of key factors in 2023 and 2028
      • 5.5 Threat of substitutes
        • Threat of substitutes - Impact of key factors in 2023 and 2028
      • 5.6 Threat of rivalry
        • Threat of rivalry - Impact of key factors in 2023 and 2028
      • 5.7 Market condition
        • Chart on Market condition - Five forces 2023 and 2028

      6 Market Segmentation by End-user

      • 6.1 Market segments
        • Chart on End-user - Market share 2023-2028 (%)
        • Data Table on End-user - Market share 2023-2028 (%)
      • 6.2 Comparison by End-user
        • Chart on Comparison by End-user
        • Data Table on Comparison by End-user
      • 6.3 Chemicals - Market size and forecast 2023-2028
        • Chart on Chemicals - Market size and forecast 2023-2028 ($ billion)
        • Data Table on Chemicals - Market size and forecast 2023-2028 ($ billion)
        • Chart on Chemicals - Year-over-year growth 2023-2028 (%)
        • Data Table on Chemicals - Year-over-year growth 2023-2028 (%)
      • 6.4 Power generation - Market size and forecast 2023-2028
        • Chart on Power generation - Market size and forecast 2023-2028 ($ billion)
        • Data Table on Power generation - Market size and forecast 2023-2028 ($ billion)
        • Chart on Power generation - Year-over-year growth 2023-2028 (%)
        • Data Table on Power generation - Year-over-year growth 2023-2028 (%)
      • 6.5 Oil and gas - Market size and forecast 2023-2028
        • Chart on Oil and gas - Market size and forecast 2023-2028 ($ billion)
        • Data Table on Oil and gas - Market size and forecast 2023-2028 ($ billion)
        • Chart on Oil and gas - Year-over-year growth 2023-2028 (%)
        • Data Table on Oil and gas - Year-over-year growth 2023-2028 (%)
      • 6.6 Others - Market size and forecast 2023-2028
        • Chart on Others - Market size and forecast 2023-2028 ($ billion)
        • Data Table on Others - Market size and forecast 2023-2028 ($ billion)
        • Chart on Others - Year-over-year growth 2023-2028 (%)
        • Data Table on Others - Year-over-year growth 2023-2028 (%)
      • 6.7 Market opportunity by End-user
        • Market opportunity by End-user ($ billion)
        • Data Table on Market opportunity by End-user ($ billion)

      7 Market Segmentation by Type

      • 7.1 Market segments
        • Chart on Type - Market share 2023-2028 (%)
        • Data Table on Type - Market share 2023-2028 (%)
      • 7.2 Comparison by Type
        • Chart on Comparison by Type
        • Data Table on Comparison by Type
      • 7.3 Boilers - Market size and forecast 2023-2028
        • Chart on Boilers - Market size and forecast 2023-2028 ($ billion)
        • Data Table on Boilers - Market size and forecast 2023-2028 ($ billion)
        • Chart on Boilers - Year-over-year growth 2023-2028 (%)
        • Data Table on Boilers - Year-over-year growth 2023-2028 (%)
      • 7.4 Separators - Market size and forecast 2023-2028
        • Chart on Separators - Market size and forecast 2023-2028 ($ billion)
        • Data Table on Separators - Market size and forecast 2023-2028 ($ billion)
        • Chart on Separators - Year-over-year growth 2023-2028 (%)
        • Data Table on Separators - Year-over-year growth 2023-2028 (%)
      • 7.5 Reactors - Market size and forecast 2023-2028
        • Chart on Reactors - Market size and forecast 2023-2028 ($ billion)
        • Data Table on Reactors - Market size and forecast 2023-2028 ($ billion)
        • Chart on Reactors - Year-over-year growth 2023-2028 (%)
        • Data Table on Reactors - Year-over-year growth 2023-2028 (%)
      • 7.6 Market opportunity by Type
        • Market opportunity by Type ($ billion)
        • Data Table on Market opportunity by Type ($ billion)

      8 Market Segmentation by Heat Source

      • 8.1 Market segments
        • Chart on Heat Source - Market share (2023-2028) (%)
        • Data Table on Heat Source - Market share (2023-2028) (%)
      • 8.2 Comparison by Heat Source
        • Chart on Comparison by Heat Source
        • Data Table on Comparison by Heat Source
      • 8.3 Fired Pressure Vessel - Market size and forecast (2023-2028)
        • Chart on Fired Pressure Vessel - Market size and forecast (2023-2028) ($ million)
        • Data Table on Fired Pressure Vessel - Market size and forecast (2023-2028) ($ million)
        • Chart on Fired Pressure Vessel - Year-over-year growth (2023-2028) (%)
        • Data Table on Fired Pressure Vessel - Year-over-year growth (2023-2028) (%)
      • 8.4 Unfired Pressure Vessel - Market size and forecast (2023-2028)
        • Chart on Unfired Pressure Vessel - Market size and forecast (2023-2028) ($ million)
        • Data Table on Unfired Pressure Vessel - Market size and forecast (2023-2028) ($ million)
        • Chart on Unfired Pressure Vessel - Year-over-year growth (2023-2028) (%)
        • Data Table on Unfired Pressure Vessel - Year-over-year growth (2023-2028) (%)
      • 8.5 Market opportunity by Heat Source
        • Market opportunity by $segment_name ($ million)
        • Data Table on Market opportunity by $segment_name ($ million)

      9 Customer Landscape

      • 9.1 Customer landscape overview
        • Analysis of price sensitivity, lifecycle, customer purchase basket, adoption rates, and purchase criteria

      10 Geographic Landscape

      • 10.1 Geographic segmentation
        • Chart on Market share by geography 2023-2028 (%)
        • Data Table on Market share by geography 2023-2028 (%)
      • 10.2 Geographic comparison
        • Chart on Geographic comparison
        • Data Table on Geographic comparison
      • 10.3 APAC - Market size and forecast 2023-2028
        • Chart on APAC - Market size and forecast 2023-2028 ($ billion)
        • Data Table on APAC - Market size and forecast 2023-2028 ($ billion)
        • Chart on APAC - Year-over-year growth 2023-2028 (%)
        • Data Table on APAC - Year-over-year growth 2023-2028 (%)
      • 10.4 Europe - Market size and forecast 2023-2028
        • Chart on Europe - Market size and forecast 2023-2028 ($ billion)
        • Data Table on Europe - Market size and forecast 2023-2028 ($ billion)
        • Chart on Europe - Year-over-year growth 2023-2028 (%)
        • Data Table on Europe - Year-over-year growth 2023-2028 (%)
      • 10.5 North America - Market size and forecast 2023-2028
        • Chart on North America - Market size and forecast 2023-2028 ($ billion)
        • Data Table on North America - Market size and forecast 2023-2028 ($ billion)
        • Chart on North America - Year-over-year growth 2023-2028 (%)
        • Data Table on North America - Year-over-year growth 2023-2028 (%)
      • 10.6 Middle East and Africa - Market size and forecast 2023-2028
        • Chart on Middle East and Africa - Market size and forecast 2023-2028 ($ billion)
        • Data Table on Middle East and Africa - Market size and forecast 2023-2028 ($ billion)
        • Chart on Middle East and Africa - Year-over-year growth 2023-2028 (%)
        • Data Table on Middle East and Africa - Year-over-year growth 2023-2028 (%)
      • 10.7 South America - Market size and forecast 2023-2028
        • Chart on South America - Market size and forecast 2023-2028 ($ billion)
        • Data Table on South America - Market size and forecast 2023-2028 ($ billion)
        • Chart on South America - Year-over-year growth 2023-2028 (%)
        • Data Table on South America - Year-over-year growth 2023-2028 (%)
      • 10.8 China - Market size and forecast 2023-2028
        • Chart on China - Market size and forecast 2023-2028 ($ billion)
        • Data Table on China - Market size and forecast 2023-2028 ($ billion)
        • Chart on China - Year-over-year growth 2023-2028 (%)
        • Data Table on China - Year-over-year growth 2023-2028 (%)
      • 10.9 US - Market size and forecast 2023-2028
        • Chart on US - Market size and forecast 2023-2028 ($ billion)
        • Data Table on US - Market size and forecast 2023-2028 ($ billion)
        • Chart on US - Year-over-year growth 2023-2028 (%)
        • Data Table on US - Year-over-year growth 2023-2028 (%)
      • 10.10 Germany - Market size and forecast 2023-2028
        • Chart on Germany - Market size and forecast 2023-2028 ($ billion)
        • Data Table on Germany - Market size and forecast 2023-2028 ($ billion)
        • Chart on Germany - Year-over-year growth 2023-2028 (%)
        • Data Table on Germany - Year-over-year growth 2023-2028 (%)
      • 10.11 Japan - Market size and forecast 2023-2028
        • Chart on Japan - Market size and forecast 2023-2028 ($ billion)
        • Data Table on Japan - Market size and forecast 2023-2028 ($ billion)
        • Chart on Japan - Year-over-year growth 2023-2028 (%)
        • Data Table on Japan - Year-over-year growth 2023-2028 (%)
      • 10.12 South Korea - Market size and forecast 2023-2028
        • Chart on South Korea - Market size and forecast 2023-2028 ($ billion)
        • Data Table on South Korea - Market size and forecast 2023-2028 ($ billion)
        • Chart on South Korea - Year-over-year growth 2023-2028 (%)
        • Data Table on South Korea - Year-over-year growth 2023-2028 (%)
      • 10.13 Market opportunity by geography
        • Market opportunity by geography ($ billion)
        • Data Tables on Market opportunity by geography ($ billion)

      11 Drivers, Challenges, and Opportunity/Restraints

      • 11.1 Market drivers
        • 11.2 Market challenges
          • 11.3 Impact of drivers and challenges
            • Impact of drivers and challenges in 2023 and 2028
          • 11.4 Market opportunities/restraints

            12 Competitive Landscape

            • 12.1 Overview
              • 12.2 Competitive Landscape
                • Overview on criticality of inputs and factors of differentiation
              • 12.3 Landscape disruption
                • Overview on factors of disruption
              • 12.4 Industry risks
                • Impact of key risks on business

              13 Competitive Analysis

              • 13.1 Companies profiled
                • Companies covered
              • 13.2 Market positioning of companies
                • Matrix on companies position and classification
              • 13.3 Abbott and Co. Newark Ltd.
                • Abbott and Co. Newark Ltd. - Overview
                • Abbott and Co. Newark Ltd. - Product / Service
                • Abbott and Co. Newark Ltd. - Key offerings
              • 13.4 Alloy Products Corp.
                • Alloy Products Corp. - Overview
                • Alloy Products Corp. - Product / Service
                • Alloy Products Corp. - Key offerings
              • 13.5 Andritz AG
                • Andritz AG - Overview
                • Andritz AG - Business segments
                • Andritz AG - Key news
                • Andritz AG - Key offerings
                • Andritz AG - Segment focus
              • 13.6 Babcock and Wilcox Enterprises Inc.
                • Babcock and Wilcox Enterprises Inc. - Overview
                • Babcock and Wilcox Enterprises Inc. - Business segments
                • Babcock and Wilcox Enterprises Inc. - Key news
                • Babcock and Wilcox Enterprises Inc. - Key offerings
                • Babcock and Wilcox Enterprises Inc. - Segment focus
              • 13.7 Bharat Heavy Electricals Ltd.
                • Bharat Heavy Electricals Ltd. - Overview
                • Bharat Heavy Electricals Ltd. - Business segments
                • Bharat Heavy Electricals Ltd. - Key news
                • Bharat Heavy Electricals Ltd. - Key offerings
                • Bharat Heavy Electricals Ltd. - Segment focus
              • 13.8 Doosan Corp.
                • Doosan Corp. - Overview
                • Doosan Corp. - Business segments
                • Doosan Corp. - Key news
                • Doosan Corp. - Key offerings
                • Doosan Corp. - Segment focus
              • 13.9 GEA Group AG
                • GEA Group AG - Overview
                • GEA Group AG - Business segments
                • GEA Group AG - Key news
                • GEA Group AG - Key offerings
                • GEA Group AG - Segment focus
              • 13.10 Godrej and Boyce Manufacturing Co. Ltd.
                • Godrej and Boyce Manufacturing Co. Ltd. - Overview
                • Godrej and Boyce Manufacturing Co. Ltd. - Product / Service
                • Godrej and Boyce Manufacturing Co. Ltd. - Key offerings
              • 13.11 Halvorsen Co.
                • Halvorsen Co. - Overview
                • Halvorsen Co. - Product / Service
                • Halvorsen Co. - Key offerings
              • 13.12 Hitachi Zosen Corp.
                • Hitachi Zosen Corp. - Overview
                • Hitachi Zosen Corp. - Business segments
                • Hitachi Zosen Corp. - Key news
                • Hitachi Zosen Corp. - Key offerings
                • Hitachi Zosen Corp. - Segment focus
              • 13.13 IHI Corp.
                • IHI Corp. - Overview
                • IHI Corp. - Business segments
                • IHI Corp. - Key offerings
                • IHI Corp. - Segment focus
              • 13.14 Larsen and Toubro Ltd.
                • Larsen and Toubro Ltd. - Overview
                • Larsen and Toubro Ltd. - Business segments
                • Larsen and Toubro Ltd. - Key news
                • Larsen and Toubro Ltd. - Key offerings
                • Larsen and Toubro Ltd. - Segment focus
              • 13.15 Mitsubishi Heavy Industries Ltd.
                • Mitsubishi Heavy Industries Ltd. - Overview
                • Mitsubishi Heavy Industries Ltd. - Business segments
                • Mitsubishi Heavy Industries Ltd. - Key news
                • Mitsubishi Heavy Industries Ltd. - Key offerings
                • Mitsubishi Heavy Industries Ltd. - Segment focus
              • 13.16 Pressure Vessels India
                • Pressure Vessels India - Overview
                • Pressure Vessels India - Product / Service
                • Pressure Vessels India - Key offerings
              • 13.17 Samuel Son and Co. Ltd.
                • Samuel Son and Co. Ltd. - Overview
                • Samuel Son and Co. Ltd. - Product / Service
                • Samuel Son and Co. Ltd. - Key offerings

              14 Appendix

              • 14.1 Scope of the report
                • 14.2 Inclusions and exclusions checklist
                  • Inclusions checklist
                  • Exclusions checklist
                • 14.3 Currency conversion rates for US$
                  • Currency conversion rates for US$
                • 14.4 Research methodology
                  • Research methodology
                • 14.5 Data procurement
                  • Information sources
                • 14.6 Data validation
                  • Data validation
                • 14.7 Validation techniques employed for market sizing
                  • Validation techniques employed for market sizing
                • 14.8 Data synthesis
                  • Data synthesis
                • 14.9 360 degree market analysis
                  • 360 degree market analysis
                • 14.10 List of abbreviations
                  • List of abbreviations

                Research Methodology

                Technavio presents a detailed picture of the market by way of study, synthesis, and summation of data from multiple sources. The analysts have presented the various facets of the market with a particular focus on identifying the key industry influencers. The data thus presented is comprehensive, reliable, and the result of extensive research, both primary and secondary.

                INFORMATION SOURCES

                Primary sources

                • Manufacturers and suppliers
                • Channel partners
                • Industry experts
                • Strategic decision makers

                Secondary sources

                • Industry journals and periodicals
                • Government data
                • Financial reports of key industry players
                • Historical data
                • Press releases

                DATA ANALYSIS

                Data Synthesis

                • Collation of data
                • Estimation of key figures
                • Analysis of derived insights

                Data Validation

                • Triangulation with data models
                • Reference against proprietary databases
                • Corroboration with industry experts

                REPORT WRITING

                Qualitative

                • Market drivers
                • Market challenges
                • Market trends
                • Five forces analysis

                Quantitative

                • Market size and forecast
                • Market segmentation
                • Geographical insights
                • Competitive landscape

                Interested in this report?

                Get your sample now to see our research methodology and insights!

                Download Now

                Frequently Asked Questions

                Pressure Vessels market growth will increase by $ 43.8 bn during 2024-2028 .

                The Pressure Vessels market is expected to grow at a CAGR of 4.37% during 2024-2028 .

                Pressure Vessels market is segmented by End-user( Chemicals, Power generation, Oil and gas, Others) Type( Boilers, Separators, Reactors, MEA, South America)

                Abbott and Co. Newark Ltd., Alloy Products Corp., Andritz AG, Babcock and Wilcox Enterprises Inc., Baffles cooling systems, Bharat Heavy Electricals Ltd., Doosan Corp., GEA Group AG, GFSA Ltd., Godrej and Boyce Manufacturing Co. Ltd., Halvorsen Co., Hitachi Zosen Corp., IHI Corp., KWS Manufacturing Co. Ltd., Larsen and Toubro Ltd., Lloyds Steel Industries Ltd., Mitsubishi Heavy Industries Ltd., Pressure Vessels India, Samuel Son and Co. Ltd., Zamil Industrial Investment Co are a few of the key vendors in the Pressure Vessels market.

                APAC will register the highest growth rate of 47% among the other regions. Therefore, the Pressure Vessels market in APAC is expected to garner significant business opportunities for the vendors during the forecast period.

                China, US, Germany, Japan, South Korea

                • Amplified demand for water and wastewater treatmentPressure vessels help in optimizing the temperature of the water and increasing the energy efficiency of the water treatment plant. Therefore is the driving factor this market.
                • an increase in such plants is expected to fuel the demand for the global pressure vessels market. Water is a critical element for manufacturing industries such as F and B is the driving factor this market.
                • pharmaceutical is the driving factor this market.
                • and pulp and paper are expected to have a significant impact on the global water demand. In addition is the driving factor this market.
                • growing production activities in these manufacturing industries will require adherence to stringent environmental regulations and water conservation norms. To meet the rising demand is the driving factor this market.
                • governments of most of the developed and developing countries are establishing new water treatment plants and replacing old water treatment plants is the driving factor this market.
                • which is increasing the demand for compressors. As the water resources diminish is the driving factor this market.
                • especially in countries such as the UAE is the driving factor this market.
                • Egypt is the driving factor this market.
                • India is the driving factor this market.
                • and China is the driving factor this market.
                • there will be a rise in investment in wastewater and desalination plants to meet the growing demand for water from people. Drying up of freshwater is expected to increase the installation of water and wastewater treatment plants across the globe. Therefore is the driving factor this market.
                • it will fuel the demand for the pressure vessels market in water and wastewater treatment plants. The private sector growing role in the ownership and management of water production and distribution is the driving factor this market.
                • including independently owned water systems is the driving factor this market.
                • utility management is the driving factor this market.
                • concessions is the driving factor this market.
                • and investment strategies is the driving factor this market.
                • will drive the demand for compressors in this region. Therefore is the driving factor this market.
                • with the growing water and wastewater industry in most of the major developing nations across the globe is the driving factor this market.
                • there will be a significant demand created for pressure vessels during the forecast period. is the driving factor this market.

                The Pressure Vessels market vendors should focus on grabbing business opportunities from the Chemicals segment as it accounted for the largest market share in the base year.