Primary Biliary Cholangitis (PBC) Therapeutics Market Analysis North America, Europe, Asia, Rest of World (ROW) - US, Canada, Germany, UK, China - Size and Forecast 2024-2028

Primary Biliary Cholangitis (PBC) Therapeutics Market Analysis North America, Europe, Asia, Rest of World (ROW) - US, Canada, Germany, UK, China - Size and Forecast 2024-2028

Published: Nov 2023 151 Pages SKU: IRTNTR76783

Market Overview at a Glance

$346.85 Mn
Market Opportunity
8.75%
CAGR
8.0
YoY growth 2023-2024(%)

Primary Biliary Cholangitis Therapeutics Market Size 2024-2028

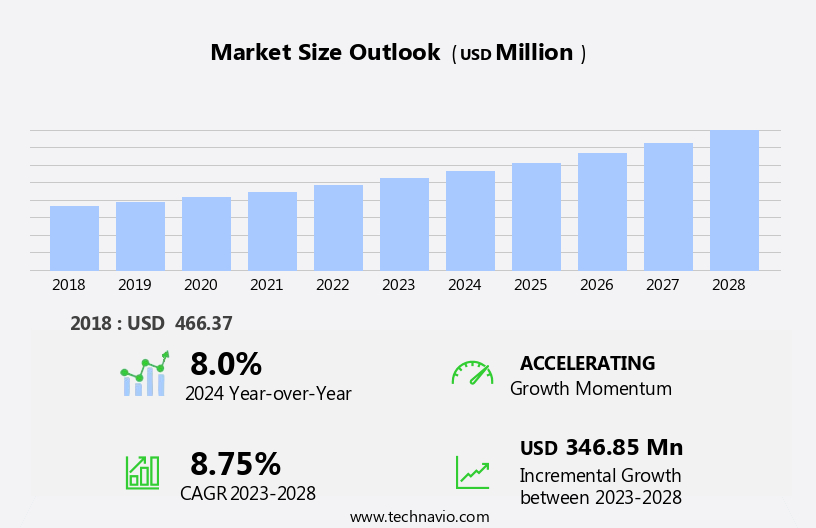
The primary biliary cholangitis therapeutics market size is forecast to increase by USD 346.85 million at a CAGR of 8.75% between 2023 and 2028.

  • The Primary Biliary Cholangitis (PBC) Therapeutics Market is experiencing significant growth, driven by several key factors. The emergence of telehealth and remote monitoring technologies is revolutionizing the delivery of healthcare services, enabling better patient management and improved access to care for PBC patients. This trend is particularly relevant in light of the chronic nature of the disease, which requires long-term monitoring and management. Another significant driver is the increasing demand for research and development (R&D) in the field of PBC therapeutics, fueled by growing government healthcare expenditure. Governments worldwide are investing heavily in healthcare research to address unmet medical needs and improve patient outcomes.
  • This investment is expected to yield new treatments and therapies for PBC, providing significant opportunities for market growth. However, the PBC Therapeutics Market is not without challenges. Stringent government regulations on the development and approval of new therapeutics pose significant hurdles for market entrants. These regulations are necessary to ensure the safety and efficacy of new treatments but can add considerable time and cost to the development process. Companies seeking to capitalize on market opportunities and navigate these challenges effectively must stay abreast of regulatory requirements and develop robust R&D pipelines to bring innovative treatments to market.
  • In summary, the PBC Therapeutics Market is poised for growth, driven by the adoption of telehealth and remote monitoring technologies and increasing government investment in healthcare R&D. However, market entrants must navigate the complex regulatory landscape to bring innovative treatments to market and meet the evolving needs of PBC patients. Companies that can successfully navigate these challenges will be well-positioned to capitalize on the significant opportunities in this market.

What will be the Size of the Primary Biliary Cholangitis Therapeutics Market during the forecast period?

Primary Biliary Cholangitis Therapeutics Market Size

 Request Free Sample

  • Primary Biliary Cholangitis (PBC), an autoimmune liver disease, causes damage to small bile ducts in the liver, leading to bile flow disruption and eventual cirrhosis. Despite a growing understanding of its causes, including genetic predispositions and environmental triggers, the diagnosis of PBC remains challenging due to a lack of awareness and clinical trials. The immune system plays a significant role in the disease progression, making it an area of intensive research. The pharmaceutical supply chain is crucial in addressing this condition, with treatments such as ursodeoxycholic acid and obeticholic acid being key therapeutic options. Advancements in treatment have led to the exploration of combination therapies, aiming to improve efficacy and mitigate potential side effects.
  • Bile flow disruptions and liver damage can lead to complications like infections and cirrhosis. The complex interplay between the immune system and liver function necessitates a robust healthcare infrastructure to ensure proper diagnosis and treatment. Genetic predispositions and environmental triggers contribute to the development of PBC, an autoimmune liver disease. The immune system's role in disease progression necessitates ongoing research to better understand the underlying mechanisms and develop effective treatments. The pharmaceutical industry continues to invest in research and development, striving to address the challenges posed by PBC and improve patient outcomes. This commitment to innovation is essential in addressing the unmet needs in the treatment of this autoimmune disease.

How is this Primary Biliary Cholangitis Therapeutics Industry segmented?

The primary biliary cholangitis therapeutics industry research report provides comprehensive data (region-wise segment analysis), with forecasts and estimates in "USD million" for the period 2024-2028, as well as historical data from 2018-2022 for the following segments.

  • Type
    • Primary drug
    • Secondary drug
  • Distribution Channel
    • Drug stores and retail pharmacies
    • Hospital pharmacies
    • Online pharmacies
  • Geography
    • North America
      • US
      • Canada
    • Europe
      • Germany
      • UK
    • Middle East and Africa
      • APAC
        • China
      • South America
        • Rest of World (ROW)

        By Type Insights

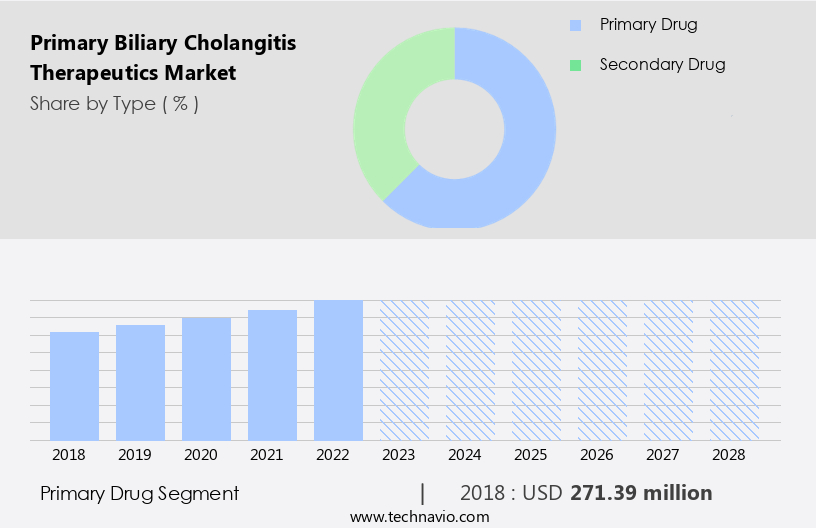
        The primary drug segment is estimated to witness significant growth during the forecast period.

        Primary biliary cholangitis (PBC) is a chronic and progressive autoimmune liver disease that damages the small bile ducts in the liver. The primary drug segment dominates the therapeutics market for PBC due to its high adoption for treatment and the effectiveness of drugs like Ursodeoxycholic acid (UDCA). Factors contributing to the growth of this segment include the increasing prevalence of PBC, the availability of various primary drugs in the pipeline, and the rise in patients diagnosed with the condition. The immune system plays a significant role in the development of PBC, with environmental triggers and genetic predispositions being potential causes.

        The diagnosis of PBC relies on clinical symptoms, laboratory tests, and imaging techniques. The limited treatment options for PBC have led to the exploration of combination therapies, which involve the use of multiple drugs to target various underlying mechanisms of the disease. These mechanisms include inflammation, bile flow disruption, and liver damage. Symptomatic therapies, such as ursodeoxycholic acid, aim to improve bile flow and reduce inflammation, while drugs like Obeticholic acid target the farnesoid X receptor (FXR) to modulate bile acid metabolism. The pharmaceutical manufacturing industry plays a crucial role in the development and supply of these therapies, with clinical trials and regulatory approvals being essential steps in the process.

        Online pharmacies and hospital pharmacies are key distribution channels for these drugs, ensuring that patients have access to effective therapies. The healthcare infrastructure, including advanced healthcare facilities, is essential for the proper diagnosis and treatment of PBC patients. The prevalence of PBC is relatively low, with an estimated 1 in 500 women and 1 in 1,000 men affected. Autoimmune biliary diseases, including PBC, are often underdiagnosed due to a lack of awareness among both patients and healthcare professionals. The high cost of treatments and limited treatment options further exacerbate the challenges faced by patients. Investments in healthcare and the pharmaceutical supply chain are crucial for the development of new therapies and the improvement of existing ones.

        The ongoing research into the underlying mechanisms of PBC and the development of combination therapies offer promising avenues for the advancement of treatment options. The patient pool for PBC is expected to grow as awareness and diagnosis rates improve, further driving the demand for effective therapies.

        Primary Biliary Cholangitis Therapeutics Market Size

        Get a glance at the market report of share of various segments Request Free Sample

        The Primary drug segment was valued at USD 271.39 million in 2018 and showed a gradual increase during the forecast period.

        Regional Analysis

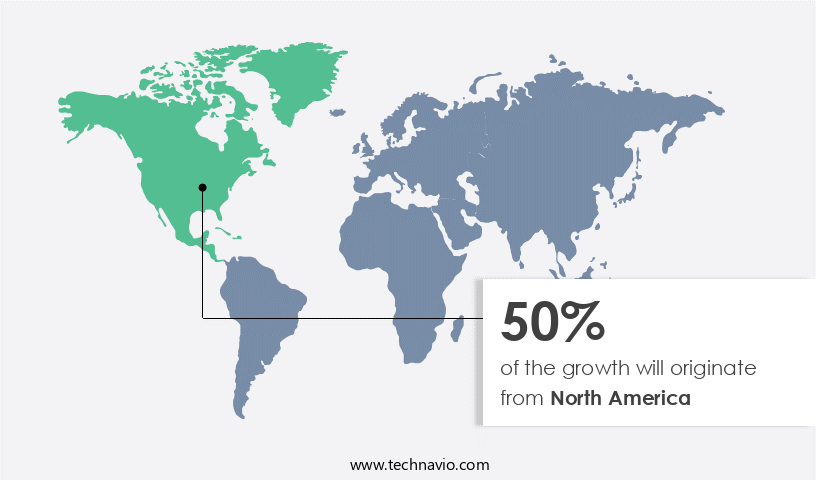
        North America is estimated to contribute 50% to the growth of the global market during the forecast period.Technavio’s analysts have elaborately explained the regional trends and drivers that shape the market during the forecast period.

        Primary Biliary Cholangitis Therapeutics Market Share by Geography

        For more insights on the market size of various regions, Request Free Sample

        Primary biliary cholangitis (PBC), an autoimmune liver disease affecting small bile ducts, has a significant impact on the global therapeutics market. The disease, characterized by inflammation and damage to the liver, is often linked to genetic predispositions, environmental triggers, and infections. The prevalence of PBC is relatively low, but it can lead to cirrhosis and liver failure if left untreated. The pharmaceutical manufacturing sector has seen a growing focus on developing effective therapies for PBC. Ursodeoxycholic acid (UDCA) has been a leading treatment for decades, addressing the underlying mechanisms of bile flow disruption. However, the limited treatment options and lack of awareness about the disease necessitate advancements in treatment.

        Recent research has shown potential in combining therapies, such as UDCA with obeticholic acid, to improve patient outcomes. Clinical trials are underway to evaluate the efficacy of these combination therapies. Hospitals and hospital pharmacies play a crucial role in diagnosing and treating PBC, as early intervention is essential for managing the disease. The healthcare investments in research and development, driven by the patient pool and the need for better symptomatic therapies, are expected to propel the growth of the PBC therapeutics market. The pharmaceutical supply chain is also adapting to cater to the increasing demand for these treatments. Despite the advancements, challenges remain, including the genetic predisposition to PBC and the potential for harmful substances to trigger the disease.

        The immune system's role in PBC and its relationship with other autoimmune liver diseases are areas of ongoing research. In conclusion, the market is evolving, driven by the need for effective treatments and a growing awareness of the disease. The market is expected to continue growing, with a focus on developing combination therapies and improving patient outcomes.

        Market Dynamics

        Our researchers analyzed the data with 2023 as the base year, along with the key drivers, trends, and challenges. A holistic analysis of drivers will help companies refine their marketing strategies to gain a competitive advantage.

        What are the key market drivers leading to the rise in the adoption of Primary Biliary Cholangitis Therapeutics Industry?

        • Emergence of telehealth and remote monitoring is the key driver of the market. 

        • The adoption of telehealth services has gained momentum in the healthcare industry due to the COVID-19 pandemic, revolutionizing the way primary biliary cholangitis patients receive care. Telehealth enables remote consultations, diagnosis, treatment, and monitoring, making it an essential tool for individuals with this condition. For those who face challenges traveling, telehealth platforms offer the opportunity to consult specialists virtually. Healthcare providers can diagnose primary biliary cholangitis remotely using video consultations, patient histories, and shared medical data. Telehealth and remote monitoring alleviate the burden on healthcare facilities by preventing unnecessary in-person visits and focusing resources on critical cases.
        • Additionally, remote monitoring technologies facilitate care delivery at patients' homes, ensuring continuous care and improving overall patient outcomes. The integration of telehealth in primary biliary chilangitis care enhances access to specialized treatment and supports the efficient allocation of healthcare resources.

        What are the market trends shaping the Primary Biliary Cholangitis Therapeutics Industry?

        • Increasing demand for R and D due to government healthcare expenditure is the upcoming market trend. 

        • In the realm of specialty pharmaceuticals, the ability to procure enriched samples of small molecules, cells, proteins, nucleic acids, or clean solutions is crucial for various applications, ranging from small-scale laboratory studies to large-scale production of primary biliary cholangitis therapeutics. Adherence to government regulations concerning the purity and consistency of these therapeutics necessitates a well-planned enrichment strategy. Pharmaceutical companies are significantly increasing their research and development (R&D) expenditures, with an average investment of 15%-20% of their revenue.
        • This enhanced R&D spending is anticipated to boost the number of primary biliary cholangitis therapeutics in the market, thereby fueling the demand for these treatments.

        What challenges does the Primary Biliary Cholangitis Therapeutics Industry face during its growth?

        • Stringent government regulations on primary biliary cholangitis therapeutics is a key challenge affecting the industry growth. 

        • Primary biliary cholangitis (PBC) therapeutics companies face regulatory hurdles in bringing their products to market. In the US, the Food and Drug Administration (FDA) sets the standards, while Europe follows the CE Marking. Other regions and countries have their regulations. Obtaining premarket approval from recognized notified bodies is essential but involves clinical trials, which are costly, time-consuming, and uncertain. The approval process varies across countries, posing a significant challenge for multinational companies.
        • companies must navigate these complexities to commercialize their PBC therapeutics, ensuring they meet the stringent requirements of various regulatory bodies.

        Exclusive Customer Landscape

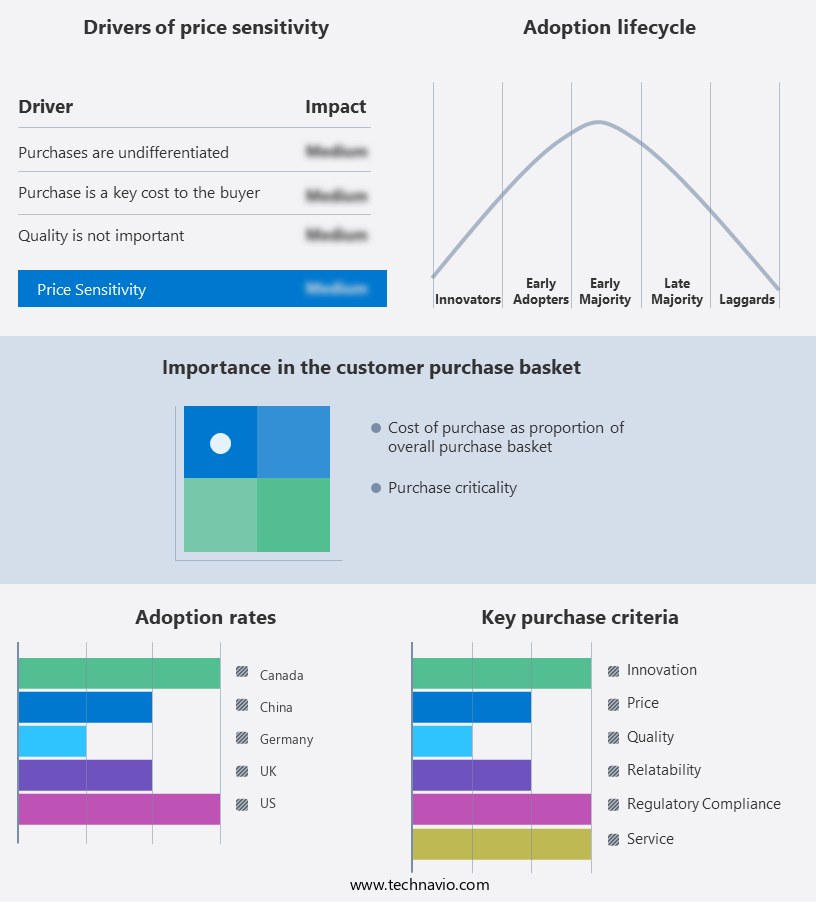
        The primary biliary cholangitis therapeutics market forecasting report includes the adoption lifecycle of the market, covering from the innovator’s stage to the laggard’s stage. It focuses on adoption rates in different regions based on penetration. Furthermore, the primary biliary cholangitis therapeutics market report also includes key purchase criteria and drivers of price sensitivity to help companies evaluate and develop their market growth analysis strategies.

        Primary Biliary Cholangitis Therapeutics Market Share by Geography

         Customer Landscape

        Key Companies & Market Insights

        Companies are implementing various strategies, such as strategic alliances, primary biliary cholangitis therapeutics market forecast, partnerships, mergers and acquisitions, geographical expansion, and product/service launches, to enhance their presence in the industry.

        Abbott Laboratories - The company specializes in diagnostic solutions for various health conditions, encompassing infectious diseases, cardiometabolic disorders, toxicology, and consumer health. In the realm of primary biliary cholangitis treatment, our offerings prioritize rapid diagnostics to ensure accurate and timely results. By combining advanced technologies and expertise in multiple diagnostic areas, we deliver comprehensive solutions that cater to diverse healthcare needs.

        The industry research and growth report includes detailed analyses of the competitive landscape of the market and information about key companies, including:

        • Abbott Laboratories
        • AbbVie Inc.
        • Alkem Laboratories Ltd.
        • Eli Lilly and Co.
        • GENFIT SA
        • Glenmark Pharmaceuticals Ltd.
        • ICE S.p.a.
        • Intercept Pharmaceuticals Inc.
        • Ipsen Pharma
        • Leeford Healthcare Ltd.
        • NGM Biopharmaceuticals Inc.
        • Novartis AG
        • Teva Pharmaceutical Industries Ltd.
        • Viatris Inc.
        • Zydus Lifesciences Ltd.

        Qualitative and quantitative analysis of companies has been conducted to help clients understand the wider business environment as well as the strengths and weaknesses of key industry players. Data is qualitatively analyzed to categorize companies as pure play, category-focused, industry-focused, and diversified; it is quantitatively analyzed to categorize companies as dominant, leading, strong, tentative, and weak.

        Research Analyst Overview

        Primary Biliary Cholangitis (PBC), a rare liver condition, is characterized by the progressive destruction of small bile ducts in the liver. The underlying mechanisms of PBC involve complex interactions between environmental triggers, the immune system, and genetic predispositions. This condition can lead to liver damage, inflammation, and, in severe cases, cirrhosis and liver failure. The diagnosis of PBC relies on various clinical and laboratory tests, which may include liver function tests, imaging studies, and biopsy. Once diagnosed, patients often face limited treatment options, relying primarily on symptomatic therapies. Ursodeoxycholic acid (UDCA) is a bile-acid modulator commonly used to treat PBC.

        It helps improve bile flow and reduce liver damage. However, its effectiveness varies among patients, and some may require combinations of therapies to manage their symptoms. Pharmaceutical manufacturing plays a crucial role in ensuring a consistent supply of UDCA and other essential drugs for PBC treatment. Online pharmacies have emerged as a convenient option for patients to access their medications, especially in areas with a lack of robust healthcare infrastructure. Clinical trials continue to explore new treatments for PBC, including obeticholic acid, which shows promise in modulating the immune system and reducing inflammation. The prevalence of PBC is relatively low, with estimates suggesting that it affects approximately 1 in 1,000 people.

        Autoimmune biliary diseases, including PBC, are increasingly recognized as significant health concerns. Environmental triggers, such as exposure to harmful substances, may contribute to the development of these conditions. Genetic predispositions also play a role, highlighting the need for further research into the underlying mechanisms. The healthcare industry is investing in advanced healthcare facilities and research initiatives to address the unique challenges posed by rare liver conditions like PBC. The pharmaceutical supply chain must remain resilient to ensure a steady supply of effective therapies for patients. As the understanding of PBC and other autoimmune liver diseases grows, so too will the potential for new treatments and improved patient outcomes.

        In the realm of PBC therapeutics, the market dynamics are shaped by various factors, including the prevalence of the condition, the effectiveness of existing treatments, and the ongoing research and development efforts. The market for PBC therapies is expected to grow as new treatments emerge and the awareness of this condition increases. The market for PBC therapeutics is driven by the unmet medical need for effective treatments and the potential for combinations of therapies to improve patient outcomes. The ongoing research into the underlying mechanisms of PBC and other autoimmune liver diseases is expected to yield new insights and treatment options.

        The pharmaceutical industry is responding to this growing demand by investing in research and development, collaborating with academic institutions, and partnering with regulatory agencies to bring new treatments to market. The role of healthcare investments in advancing the field of PBC therapeutics is crucial, as it provides the financial resources necessary to drive innovation and improve patient care. In conclusion, the market for PBC therapeutics is an evolving landscape shaped by the complex interplay of various factors, including the prevalence of the condition, the effectiveness of existing treatments, and ongoing research and development efforts. The potential for combinations of therapies and advancements in our understanding of the underlying mechanisms of PBC and other autoimmune liver diseases offers significant opportunities for innovation and improved patient outcomes.

        Market Scope

        Report Coverage

        Details

        Page number

        151

        Base year

        2023

        Historic period

        2018-2022

        Forecast period

        2024-2028

        Growth momentum & CAGR

        Accelerate at a CAGR of 8.75%

        Market growth 2024-2028

        USD 346.85 million

        Market structure

        Fragmented

        YoY growth 2023-2024(%)

        8.0

        Key countries

        US, Canada, Germany, UK, and China

        Competitive landscape

        Leading Companies, Market Positioning of Companies, Competitive Strategies, and Industry Risks

        Request Free Sample

        What are the Key Data Covered in this Primary Biliary Cholangitis Therapeutics Market Research and Growth Report?

        • CAGR of the Primary Biliary Cholangitis Therapeutics industry during the forecast period
        • Detailed information on factors that will drive the growth and forecasting between 2024 and 2028
        • Precise estimation of the size of the market and its contribution of the industry in focus to the parent market
        • Accurate predictions about upcoming growth and trends and changes in consumer behaviour
        • Growth of the market across North America, Europe, Asia, and Rest of World (ROW)
        • Thorough analysis of the market’s competitive landscape and detailed information about companies
        • Comprehensive analysis of factors that will challenge the primary biliary cholangitis therapeutics market growth of industry companies

        We can help! Our analysts can customize this primary biliary cholangitis therapeutics market research report to meet your requirements.

        Get in touch


        1 Executive Summary

        • 1.1 Market overview
          • Exhibit 01: Executive Summary – Chart on Market Overview
          • Exhibit 02: Executive Summary – Data Table on Market Overview
          • Exhibit 03: Executive Summary – Chart on Global Market Characteristics
          • Exhibit 04: Executive Summary – Chart on Market by Geography
          • Exhibit 05: Executive Summary – Chart on Market Segmentation by Type
          • Exhibit 06: Executive Summary – Chart on Market Segmentation by Distribution Channel
          • Exhibit 07: Executive Summary – Chart on Incremental Growth
          • Exhibit 08: Executive Summary – Data Table on Incremental Growth
          • Exhibit 09: Executive Summary – Chart on Vendor Market Positioning

        2 Market Landscape

        • 2.1 Market ecosystem
          • Exhibit 10: Parent market
          • Exhibit 11: Market Characteristics

        3 Market Sizing

        • 3.1 Market definition
          • Exhibit 12: Offerings of vendors included in the market definition
        • 3.2 Market segment analysis
          • Exhibit 13: Market segments
        • 3.3 Market size 2023
          • 3.4 Market outlook: Forecast for 2023-2028
            • Exhibit 14: Chart on Global - Market size and forecast 2023-2028 ($ million)
            • Exhibit 15: Data Table on Global - Market size and forecast 2023-2028 ($ million)
            • Exhibit 16: Chart on Global Market: Year-over-year growth 2023-2028 (%)
            • Exhibit 17: Data Table on Global Market: Year-over-year growth 2023-2028 (%)

          4 Historic Market Size

          • 4.1 Global primary biliary cholangitis therapeutics market 2018 - 2022
            • Exhibit 18: Historic Market Size – Data Table on global primary biliary cholangitis therapeutics market 2018 - 2022 ($ million)
          • 4.2 Type Segment Analysis 2018 - 2022
            • Exhibit 19: Historic Market Size – Type Segment 2018 - 2022 ($ million)
          • 4.3 Distribution Channel Segment Analysis 2018 - 2022
            • Exhibit 20: Historic Market Size – Distribution Channel Segment 2018 - 2022 ($ million)
          • 4.4 Geography Segment Analysis 2018 - 2022
            • Exhibit 21: Historic Market Size – Geography Segment 2018 - 2022 ($ million)
          • 4.5 Country Segment Analysis 2018 - 2022
            • Exhibit 22: Historic Market Size – Country Segment 2018 - 2022 ($ million)

          5 Five Forces Analysis

          • 5.1 Five forces summary
            • Exhibit 23: Five forces analysis - Comparison between 2023 and 2028
          • 5.2 Bargaining power of buyers
            • Exhibit 24: Chart on Bargaining power of buyers – Impact of key factors 2023 and 2028
          • 5.3 Bargaining power of suppliers
            • Exhibit 25: Bargaining power of suppliers – Impact of key factors in 2023 and 2028
          • 5.4 Threat of new entrants
            • Exhibit 26: Threat of new entrants – Impact of key factors in 2023 and 2028
          • 5.5 Threat of substitutes
            • Exhibit 27: Threat of substitutes – Impact of key factors in 2023 and 2028
          • 5.6 Threat of rivalry
            • Exhibit 28: Threat of rivalry – Impact of key factors in 2023 and 2028
          • 5.7 Market condition
            • Exhibit 29: Chart on Market condition - Five forces 2023 and 2028

          6 Market Segmentation by Type

          • 6.1 Market segments
            • Exhibit 30: Chart on Type - Market share 2023-2028 (%)
            • Exhibit 31: Data Table on Type - Market share 2023-2028 (%)
          • 6.2 Comparison by Type
            • Exhibit 32: Chart on Comparison by Type
            • Exhibit 33: Data Table on Comparison by Type
          • 6.3 Primary drug - Market size and forecast 2023-2028
            • Exhibit 34: Chart on Primary drug - Market size and forecast 2023-2028 ($ million)
            • Exhibit 35: Data Table on Primary drug - Market size and forecast 2023-2028 ($ million)
            • Exhibit 36: Chart on Primary drug - Year-over-year growth 2023-2028 (%)
            • Exhibit 37: Data Table on Primary drug - Year-over-year growth 2023-2028 (%)
          • 6.4 Secondary drug - Market size and forecast 2023-2028
            • Exhibit 38: Chart on Secondary drug - Market size and forecast 2023-2028 ($ million)
            • Exhibit 39: Data Table on Secondary drug - Market size and forecast 2023-2028 ($ million)
            • Exhibit 40: Chart on Secondary drug - Year-over-year growth 2023-2028 (%)
            • Exhibit 41: Data Table on Secondary drug - Year-over-year growth 2023-2028 (%)
          • 6.5 Market opportunity by Type
            • Exhibit 42: Market opportunity by Type ($ million)
            • Exhibit 43: Data Table on Market opportunity by Type ($ million)

          7 Market Segmentation by Distribution Channel

          • 7.1 Market segments
            • Exhibit 44: Chart on Distribution Channel - Market share 2023-2028 (%)
            • Exhibit 45: Data Table on Distribution Channel - Market share 2023-2028 (%)
          • 7.2 Comparison by Distribution Channel
            • Exhibit 46: Chart on Comparison by Distribution Channel
            • Exhibit 47: Data Table on Comparison by Distribution Channel
          • 7.3 Drug stores and retail pharmacies - Market size and forecast 2023-2028
            • Exhibit 48: Chart on Drug stores and retail pharmacies - Market size and forecast 2023-2028 ($ million)
            • Exhibit 49: Data Table on Drug stores and retail pharmacies - Market size and forecast 2023-2028 ($ million)
            • Exhibit 50: Chart on Drug stores and retail pharmacies - Year-over-year growth 2023-2028 (%)
            • Exhibit 51: Data Table on Drug stores and retail pharmacies - Year-over-year growth 2023-2028 (%)
          • 7.4 Hospital pharmacies - Market size and forecast 2023-2028
            • Exhibit 52: Chart on Hospital pharmacies - Market size and forecast 2023-2028 ($ million)
            • Exhibit 53: Data Table on Hospital pharmacies - Market size and forecast 2023-2028 ($ million)
            • Exhibit 54: Chart on Hospital pharmacies - Year-over-year growth 2023-2028 (%)
            • Exhibit 55: Data Table on Hospital pharmacies - Year-over-year growth 2023-2028 (%)
          • 7.5 Online pharmacies - Market size and forecast 2023-2028
            • Exhibit 56: Chart on Online pharmacies - Market size and forecast 2023-2028 ($ million)
            • Exhibit 57: Data Table on Online pharmacies - Market size and forecast 2023-2028 ($ million)
            • Exhibit 58: Chart on Online pharmacies - Year-over-year growth 2023-2028 (%)
            • Exhibit 59: Data Table on Online pharmacies - Year-over-year growth 2023-2028 (%)
          • 7.6 Market opportunity by Distribution Channel
            • Exhibit 60: Market opportunity by Distribution Channel ($ million)
            • Exhibit 61: Data Table on Market opportunity by Distribution Channel ($ million)

          8 Customer Landscape

          • 8.1 Customer landscape overview
            • Exhibit 62: Analysis of price sensitivity, lifecycle, customer purchase basket, adoption rates, and purchase criteria

          9 Geographic Landscape

          • 9.1 Geographic segmentation
            • Exhibit 63: Chart on Market share by geography 2023-2028 (%)
            • Exhibit 64: Data Table on Market share by geography 2023-2028 (%)
          • 9.2 Geographic comparison
            • Exhibit 65: Chart on Geographic comparison
            • Exhibit 66: Data Table on Geographic comparison
          • 9.3 North America - Market size and forecast 2023-2028
            • Exhibit 67: Chart on North America - Market size and forecast 2023-2028 ($ million)
            • Exhibit 68: Data Table on North America - Market size and forecast 2023-2028 ($ million)
            • Exhibit 69: Chart on North America - Year-over-year growth 2023-2028 (%)
            • Exhibit 70: Data Table on North America - Year-over-year growth 2023-2028 (%)
          • 9.4 Europe - Market size and forecast 2023-2028
            • Exhibit 71: Chart on Europe - Market size and forecast 2023-2028 ($ million)
            • Exhibit 72: Data Table on Europe - Market size and forecast 2023-2028 ($ million)
            • Exhibit 73: Chart on Europe - Year-over-year growth 2023-2028 (%)
            • Exhibit 74: Data Table on Europe - Year-over-year growth 2023-2028 (%)
          • 9.5 Asia - Market size and forecast 2023-2028
            • Exhibit 75: Chart on Asia - Market size and forecast 2023-2028 ($ million)
            • Exhibit 76: Data Table on Asia - Market size and forecast 2023-2028 ($ million)
            • Exhibit 77: Chart on Asia - Year-over-year growth 2023-2028 (%)
            • Exhibit 78: Data Table on Asia - Year-over-year growth 2023-2028 (%)
          • 9.6 Rest of World (ROW) - Market size and forecast 2023-2028
            • Exhibit 79: Chart on Rest of World (ROW) - Market size and forecast 2023-2028 ($ million)
            • Exhibit 80: Data Table on Rest of World (ROW) - Market size and forecast 2023-2028 ($ million)
            • Exhibit 81: Chart on Rest of World (ROW) - Year-over-year growth 2023-2028 (%)
            • Exhibit 82: Data Table on Rest of World (ROW) - Year-over-year growth 2023-2028 (%)
          • 9.7 US - Market size and forecast 2023-2028
            • Exhibit 83: Chart on US - Market size and forecast 2023-2028 ($ million)
            • Exhibit 84: Data Table on US - Market size and forecast 2023-2028 ($ million)
            • Exhibit 85: Chart on US - Year-over-year growth 2023-2028 (%)
            • Exhibit 86: Data Table on US - Year-over-year growth 2023-2028 (%)
          • 9.8 Canada - Market size and forecast 2023-2028
            • Exhibit 87: Chart on Canada - Market size and forecast 2023-2028 ($ million)
            • Exhibit 88: Data Table on Canada - Market size and forecast 2023-2028 ($ million)
            • Exhibit 89: Chart on Canada - Year-over-year growth 2023-2028 (%)
            • Exhibit 90: Data Table on Canada - Year-over-year growth 2023-2028 (%)
          • 9.9 Germany - Market size and forecast 2023-2028
            • Exhibit 91: Chart on Germany - Market size and forecast 2023-2028 ($ million)
            • Exhibit 92: Data Table on Germany - Market size and forecast 2023-2028 ($ million)
            • Exhibit 93: Chart on Germany - Year-over-year growth 2023-2028 (%)
            • Exhibit 94: Data Table on Germany - Year-over-year growth 2023-2028 (%)
          • 9.10 China - Market size and forecast 2023-2028
            • Exhibit 95: Chart on China - Market size and forecast 2023-2028 ($ million)
            • Exhibit 96: Data Table on China - Market size and forecast 2023-2028 ($ million)
            • Exhibit 97: Chart on China - Year-over-year growth 2023-2028 (%)
            • Exhibit 98: Data Table on China - Year-over-year growth 2023-2028 (%)
          • 9.11 UK - Market size and forecast 2023-2028
            • Exhibit 99: Chart on UK - Market size and forecast 2023-2028 ($ million)
            • Exhibit 100: Data Table on UK - Market size and forecast 2023-2028 ($ million)
            • Exhibit 101: Chart on UK - Year-over-year growth 2023-2028 (%)
            • Exhibit 102: Data Table on UK - Year-over-year growth 2023-2028 (%)
          • 9.12 Market opportunity by geography
            • Exhibit 103: Market opportunity by geography ($ million)
            • Exhibit 104: Data Tables on Market opportunity by geography ($ million)

          10 Drivers, Challenges, and Trends

          • 10.1 Market drivers
            • 10.2 Market challenges
              • 10.3 Impact of drivers and challenges
                • Exhibit 105: Impact of drivers and challenges in 2023 and 2028
              • 10.4 Market trends

                11 Vendor Landscape

                • 11.1 Overview
                  • 11.2 Vendor landscape
                    • Exhibit 106: Overview on Criticality of inputs and Factors of differentiation
                  • 11.3 Landscape disruption
                    • Exhibit 107: Overview on factors of disruption
                  • 11.4 Industry risks
                    • Exhibit 108: Impact of key risks on business

                  12 Vendor Analysis

                  • 12.1 Vendors covered
                    • Exhibit 109: Vendors covered
                  • 12.2 Market positioning of vendors
                    • Exhibit 110: Matrix on vendor position and classification
                  • 12.3 Abbott Laboratories
                    • Exhibit 111: Abbott Laboratories - Overview
                    • Exhibit 112: Abbott Laboratories - Business segments
                    • Exhibit 113: Abbott Laboratories - Key news
                    • Exhibit 114: Abbott Laboratories - Key offerings
                    • Exhibit 115: Abbott Laboratories - Segment focus
                  • 12.4 AbbVie Inc.
                    • Exhibit 116: AbbVie Inc. - Overview
                    • Exhibit 117: AbbVie Inc. - Product / Service
                    • Exhibit 118: AbbVie Inc. - Key news
                    • Exhibit 119: AbbVie Inc. - Key offerings
                  • 12.5 Alkem Laboratories Ltd.
                    • Exhibit 120: Alkem Laboratories Ltd. - Overview
                    • Exhibit 121: Alkem Laboratories Ltd. - Business segments
                    • Exhibit 122: Alkem Laboratories Ltd. - Key news
                    • Exhibit 123: Alkem Laboratories Ltd. - Key offerings
                    • Exhibit 124: Alkem Laboratories Ltd. - Segment focus
                  • 12.6 Eli Lilly and Co.
                    • Exhibit 125: Eli Lilly and Co. - Overview
                    • Exhibit 126: Eli Lilly and Co. - Product / Service
                    • Exhibit 127: Eli Lilly and Co. - Key news
                    • Exhibit 128: Eli Lilly and Co. - Key offerings
                  • 12.7 GENFIT SA
                    • Exhibit 129: GENFIT SA - Overview
                    • Exhibit 130: GENFIT SA - Product / Service
                    • Exhibit 131: GENFIT SA - Key offerings
                  • 12.8 Glenmark Pharmaceuticals Ltd.
                    • Exhibit 132: Glenmark Pharmaceuticals Ltd. - Overview
                    • Exhibit 133: Glenmark Pharmaceuticals Ltd. - Product / Service
                    • Exhibit 134: Glenmark Pharmaceuticals Ltd. - Key offerings
                  • 12.9 ICE S.p.a.
                    • Exhibit 135: ICE S.p.a. - Overview
                    • Exhibit 136: ICE S.p.a. - Product / Service
                    • Exhibit 137: ICE S.p.a. - Key offerings
                  • 12.10 Intercept Pharmaceuticals Inc.
                    • Exhibit 138: Intercept Pharmaceuticals Inc. - Overview
                    • Exhibit 139: Intercept Pharmaceuticals Inc. - Product / Service
                    • Exhibit 140: Intercept Pharmaceuticals Inc. - Key offerings
                  • 12.11 Ipsen Pharma
                    • Exhibit 141: Ipsen Pharma - Overview
                    • Exhibit 142: Ipsen Pharma - Business segments
                    • Exhibit 143: Ipsen Pharma - Key offerings
                    • Exhibit 144: Ipsen Pharma - Segment focus
                  • 12.12 Leeford Healthcare Ltd.
                    • Exhibit 145: Leeford Healthcare Ltd. - Overview
                    • Exhibit 146: Leeford Healthcare Ltd. - Key offerings
                  • 12.13 NGM Biopharmaceuticals Inc.
                    • Exhibit 147: NGM Biopharmaceuticals Inc. - Overview
                    • Exhibit 148: NGM Biopharmaceuticals Inc. - Key offerings
                  • 12.14 Novartis AG
                    • Exhibit 149: Novartis AG - Overview
                    • Exhibit 150: Novartis AG - Business segments
                    • Exhibit 151: Novartis AG - Key offerings
                    • Exhibit 152: Novartis AG - Segment focus
                  • 12.15 Teva Pharmaceutical Industries Ltd.
                    • Exhibit 153: Teva Pharmaceutical Industries Ltd. - Overview
                    • Exhibit 154: Teva Pharmaceutical Industries Ltd. - Business segments
                    • Exhibit 155: Teva Pharmaceutical Industries Ltd. - Key news
                    • Exhibit 156: Teva Pharmaceutical Industries Ltd. - Key offerings
                    • Exhibit 157: Teva Pharmaceutical Industries Ltd. - Segment focus
                  • 12.16 Viatris Inc.
                    • Exhibit 158: Viatris Inc. - Overview
                    • Exhibit 159: Viatris Inc. - Business segments
                    • Exhibit 160: Viatris Inc. - Key news
                    • Exhibit 161: Viatris Inc. - Key offerings
                    • Exhibit 162: Viatris Inc. - Segment focus
                  • 12.17 Zydus Lifesciences Ltd.
                    • Exhibit 163: Zydus Lifesciences Ltd. - Overview
                    • Exhibit 164: Zydus Lifesciences Ltd. - Business segments
                    • Exhibit 165: Zydus Lifesciences Ltd. - Key offerings
                    • Exhibit 166: Zydus Lifesciences Ltd. - Segment focus

                  13 Appendix

                  • 13.1 Scope of the report
                    • 13.2 Inclusions and exclusions checklist
                      • Exhibit 167: Inclusions checklist
                      • Exhibit 168: Exclusions checklist
                    • 13.3 Currency conversion rates for US$
                      • Exhibit 169: Currency conversion rates for US$
                    • 13.4 Research methodology
                      • Exhibit 170: Research methodology
                      • Exhibit 171: Validation techniques employed for market sizing
                      • Exhibit 172: Information sources
                    • 13.5 List of abbreviations
                      • Exhibit 173: List of abbreviations

                    Research Methodology

                    Technavio presents a detailed picture of the market by way of study, synthesis, and summation of data from multiple sources. The analysts have presented the various facets of the market with a particular focus on identifying the key industry influencers. The data thus presented is comprehensive, reliable, and the result of extensive research, both primary and secondary.

                    INFORMATION SOURCES

                    Primary sources

                    • Manufacturers and suppliers
                    • Channel partners
                    • Industry experts
                    • Strategic decision makers

                    Secondary sources

                    • Industry journals and periodicals
                    • Government data
                    • Financial reports of key industry players
                    • Historical data
                    • Press releases

                    DATA ANALYSIS

                    Data Synthesis

                    • Collation of data
                    • Estimation of key figures
                    • Analysis of derived insights

                    Data Validation

                    • Triangulation with data models
                    • Reference against proprietary databases
                    • Corroboration with industry experts

                    REPORT WRITING

                    Qualitative

                    • Market drivers
                    • Market challenges
                    • Market trends
                    • Five forces analysis

                    Quantitative

                    • Market size and forecast
                    • Market segmentation
                    • Geographical insights
                    • Competitive landscape

                    Interested in this report?

                    Get your sample now to see our research methodology and insights!

                    Download Now

                    Frequently Asked Questions

                    Primary Biliary Cholangitis Therapeutics market growth will increase by $ 346.85 mn during 2024-2028 .

                    The Primary Biliary Cholangitis Therapeutics market is expected to grow at a CAGR of 8.75% during 2024-2028 .

                    Primary Biliary Cholangitis Therapeutics market is segmented by Type( Primary drug, Secondary drug) Distribution Channel( Drug stores and retail pharmacies, Hospital pharmacies, Online pharmacies)

                    Abbott Laboratories, AbbVie Inc., Alkem Laboratories Ltd., Eli Lilly and Co., GENFIT SA, Glenmark Pharmaceuticals Ltd., ICE S.p.a., Intercept Pharmaceuticals Inc., Ipsen Pharma, Leeford Healthcare Ltd., NGM Biopharmaceuticals Inc., Novartis AG, Teva Pharmaceutical Industries Ltd., Viatris Inc., Zydus Lifesciences Ltd. are a few of the key vendors in the Primary Biliary Cholangitis Therapeutics market.

                    North America will register the highest growth rate of 50% among the other regions. Therefore, the Primary Biliary Cholangitis Therapeutics market in North America is expected to garner significant business opportunities for the vendors during the forecast period.

                    US, Canada, Germany, UK, China

                    • Emergence of telehealth and remote monitoringThe COVID-19 pandemic in 2020 accelerated the adoption of telehealth services is the driving factor this market.
                    • transforming healthcare delivery. Telehealth enables remote consultations is the driving factor this market.
                    • diagnosis is the driving factor this market.
                    • treatment is the driving factor this market.
                    • and monitoring for primary biliary cholangitis patients and others is the driving factor this market.
                    • improving access to care. Telehealth platforms allow primary biliary cholangitis patients to consult specialists virtually. This is especially beneficial for those who have difficulty traveling. Telehealth enables healthcare providers to diagnose and primary biliary cholangitis remotely is the driving factor this market.
                    • leveraging video consultations is the driving factor this market.
                    • patient histories is the driving factor this market.
                    • and shared medical data. Telehealth and remote monitoring help alleviate the burden on healthcare facilities by preventing unnecessary in-person visits and focusing resources on critical cases. Moreover is the driving factor this market.
                    • remote monitoring technologies facilitate care delivery at patients homes. This is essential for individuals with severe primary biliary cholangitis conditions who may need frequent monitoring but are at risk in healthcare settings. Thus is the driving factor this market.
                    • the emergence of telehealth and remote monitoring will promote the growth of the global primary biliary cholangitis therapeutics market during the forecast period.  is the driving factor this market.

                    The Primary Biliary Cholangitis Therapeutics market vendors should focus on grabbing business opportunities from the Primary drug segment as it accounted for the largest market share in the base year.