Pro AV Market Size 2025-2029
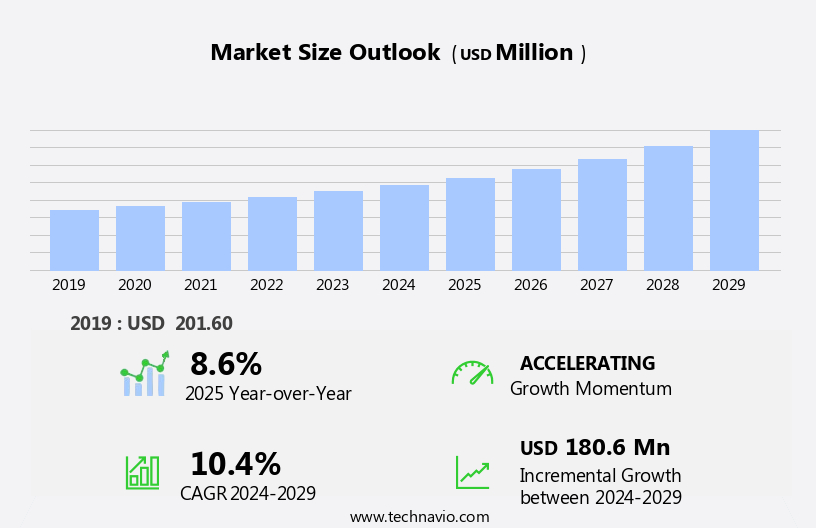
The pro av market size is forecast to increase by USD 180.6 million, at a CAGR of 10.4% between 2024 and 2029.
- The market is experiencing significant shifts, driven by the increasing adoption of digital signage and a growing focus on personalized learning. Digital signage is transforming the Pro AV landscape, offering new opportunities for businesses to engage customers and enhance their brand presence. This trend is fueled by advancements in technology, enabling more interactive and dynamic displays. Meanwhile, the demand for one-on-one learning experiences is gaining momentum. As the workforce becomes more diverse and distributed, there is a growing need for flexible and personalized training solutions. Pro AV technology plays a crucial role in facilitating these learning environments, offering immersive and interactive experiences.
- However, this shift presents challenges as well. Integrating these technologies into existing infrastructure and ensuring seamless user experiences require significant investment and expertise. Additionally, ensuring security and privacy in these digital learning environments is a major concern. Companies seeking to capitalize on these opportunities must navigate these challenges effectively, investing in the right technologies and partnerships to stay competitive.
What will be the Size of the Pro AV Market during the forecast period?

Explore in-depth regional segment analysis with market size data - historical 2019-2023 and forecasts 2025-2029 - in the full report.
Request Free Sample
The market continues to evolve, with dynamic market activities unfolding across various sectors. Networking equipment plays a crucial role in ensuring seamless communication and signal distribution. Refresh rates and video conferencing solutions enhance user experience, while system integration brings cohesion to complex installations. Video walls and installation services provide visually engaging experiences, and power consumption remains a key consideration for energy-efficient solutions. Audio systems, from audio quality to remote monitoring and technical support, are integral to the Pro AV landscape. Firmware updates and signal processing ensure optimal performance, while AV over IP and streaming media expand accessibility.
LED lighting and cable management solutions contribute to efficient and visually appealing installations. Data analytics and control systems enable advanced functionality, with user experience at the forefront. Matrix switchers and interactive whiteboards offer interactive and customizable solutions. Maintenance contracts and cloud-based management streamline operations, while control protocols ensure compatibility and ease of use. Applications span industries, from houses of worship to digital signage and beyond. Continuous innovation drives the market forward, with ongoing advancements in networking, video conferencing, and system integration shaping the future of Pro AV.
How is this Pro AV Industry segmented?
The pro av industry research report provides comprehensive data (region-wise segment analysis), with forecasts and estimates in "USD million" for the period 2025-2029, as well as historical data from 2019-2023 for the following segments.
- Type
- Industry Application
- Entertainment
- Hospitality
- Retail
- Corporate
- Transportation
- Distribution Channel
- Technology
- Wired Systems
- Wireless Systems
- Cloud-Based Solutions
- AI-Integrated Systems
- Geography
- North America
- Europe
- Middle East and Africa
- APAC
- China
- India
- Japan
- South Korea
- South America
- Rest of World (ROW)
By Type Insights
The products segment is estimated to witness significant growth during the forecast period.
The market is experiencing significant growth, driven in part by the increasing adoption of digital signage in various industries. Digital signage, which delivers videos, web content, images, and texts on wide, bright displays, is used in retail, corporate settings, medical facilities, schools, libraries, transportation hubs, and hospitality venues, among others. These displays, which can be LCD or plasma, are controlled by PCs and servers using proprietary and public-domain software. Advancements in technology have led to the integration of audio systems, remote monitoring, data analytics, and AV over IP in digital signage solutions. Audio systems enhance the user experience, while remote monitoring and data analytics enable real-time performance tracking and optimization.
AV over IP allows for the distribution of audio and video content over a network, increasing flexibility and reducing the need for expensive cabling. Signal processing and refresh rate are crucial factors in ensuring high-quality display output. Video conferencing systems have become essential for remote communication and collaboration, driving demand for high-quality audio and video equipment. System integration and video walls are also becoming increasingly popular, requiring advanced signal distribution and matrix switching capabilities. Installation services and maintenance contracts ensure the smooth operation of Pro AV systems. Power consumption and audio quality are important considerations for businesses looking to reduce costs and improve the user experience.
LED lighting and technical support are also essential components of Pro AV solutions. Cloud-based management and cable management software solutions streamline the management and maintenance of Pro AV systems. Control systems and interactive whiteboards enable user-friendly control and collaboration. Control protocols and rack mounting ensure seamless integration and organization of Pro AV components. Houses of worship and other community spaces are also adopting Pro AV technology for improved communication and engagement. Overall, the market is dynamic and evolving, driven by advancements in technology and the growing demand for immersive and harmonious user experiences.

Request Free Sample
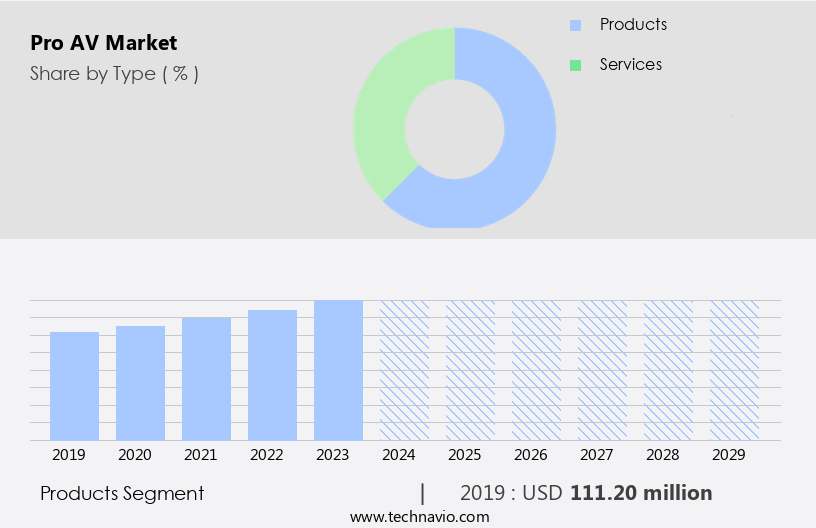
The Products segment was valued at USD 111.20 million in 2019 and showed a gradual increase during the forecast period.
Regional Analysis
APAC is estimated to contribute 52% to the growth of the global market during the forecast period.Technavio’s analysts have elaborately explained the regional trends and drivers that shape the market during the forecast period.

Request Free Sample
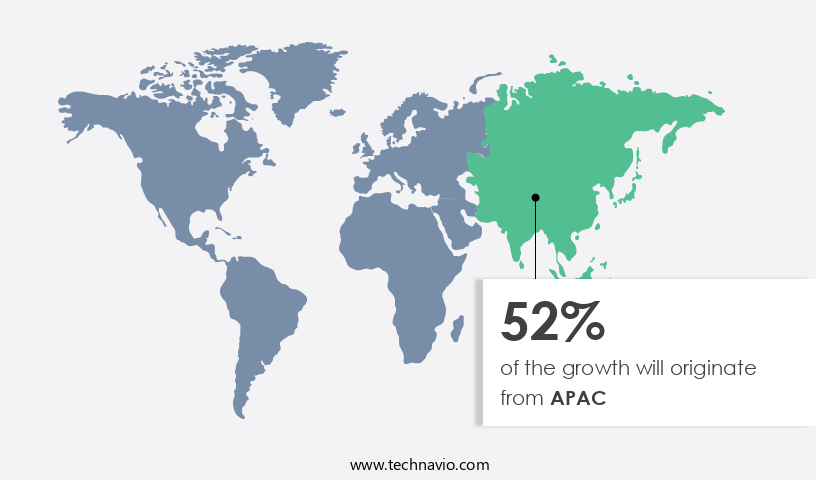
The market in APAC is experiencing significant growth, driven by the expanding education sector and the increasing adoption of advanced tools in corporate environments. In classrooms, diagnostic tools and firmware updates ensure the optimal performance of audio systems and video conferencing equipment. Remote monitoring and data analytics enable educators to assess student engagement and progress in real-time, while AV over IP and signal processing enhance the user experience. Networking equipment and signal distribution solutions facilitate seamless communication and collaboration. The refresh rate and audio quality of video conferencing systems are crucial for immersive and harmonious virtual learning experiences.
Houses of worship and other institutions also utilize pro AV technology for streaming media, control systems, and interactive whiteboards. Maintenance contracts and cloud-based management systems ensure the longevity and efficiency of these installations. In the corporate sector, power consumption and cable management are essential considerations for large video walls and matrix switchers. The integration of LED lighting and technical support further enhances the functionality and aesthetics of pro AV systems. Control protocols and rack mounting ensure the seamless operation and organization of these complex setups. Government initiatives, such as those in China, prioritize the implementation of advanced pro AV technology to bridge the gap between rural and urban education.
This focus on improving access to quality education contributes to the market's growth. The corporate sector's increasing reliance on pro AV solutions for communication, collaboration, and productivity further fuels the market's expansion.
Market Dynamics
Our researchers analyzed the data with 2024 as the base year, along with the key drivers, trends, and challenges. A holistic analysis of drivers will help companies refine their marketing strategies to gain a competitive advantage.
The market, a significant segment of the audio-visual industry, caters to professional applications, from broadcast and live events to corporate training and education. This market encompasses high-end equipment, including video walls, projectors, sound systems, and control systems. Integration of cutting-edge technologies like 4K resolution, virtual reality, and augmented reality is transforming the pro av landscape. Advanced features like real-time processing, networked systems, and customizable interfaces are in high demand. Collaboration tools, wireless connectivity, and easy-to-use software solutions are essential for seamless integration and operation. The market continues to evolve, driven by innovation and the ever-growing need for immersive and interactive experiences.
What are the key market drivers leading to the rise in the adoption of Pro AV Industry?
- The significant growth in the adoption of digital signage is the primary factor fueling market expansion.
- In the market, diagnostic tools and firmware updates play a crucial role in ensuring optimal performance of audio systems and signal processing for digital signage applications. Remote monitoring and data analytics enable businesses to efficiently manage their AV systems from a distance, enhancing the user experience. AV over IP technology is a significant trend, allowing for seamless integration and centralized control of AV systems. Interactive features, such as touchscreens and motion sensors, are increasingly popular, creating immersive and harmonious environments for audiences. The retail industry is a major adopter of digital signage, utilizing it to influence consumer behavior through dynamic content and promotions.
- These advancements in Pro AV technology underscore the industry's commitment to delivering engaging and effective communication solutions.
What are the market trends shaping the Pro AV Industry?
- Pro AV equipment training is an essential trend in the industry. As a professional, staying informed and skilled in this area is crucial for providing optimal solutions to clients.
- The market is witnessing significant growth due to the increasing demand for advanced networking equipment and signal distribution solutions. With the rise of video conferencing and video walls, there is a growing need for system integration and installation services. These technologies are essential for creating immersive and harmonious experiences in various sectors, including events and retail, education, and business. To meet this demand, established companies are offering comprehensive training programs to AV professionals. For instance, Seiko Epson's Pro AV Academy provides detailed knowledge of their latest AV technology to engineers, operators, sales personnel, and service engineers.
- This expertise enables AV professionals to effectively arrange, maintain, operate, and market these technologies across the pro AV rental sector. Power consumption is also a critical factor in the market, with companies focusing on developing energy-efficient solutions to reduce environmental impact and operating costs.
What challenges does the Pro AV Industry face during its growth?
- One-on-one learning holds significant importance and poses a notable challenge to the industry's growth due to its resource-intensive nature.
- The market is experiencing significant growth due to the increasing demand for immersive and harmonious audio-visual experiences in various sectors. One such sector is houses of worship, where high-quality audio and LED lighting are essential for creating an engaging and spiritual environment. Streaming media and control systems are also becoming increasingly popular, enabling remote access and management of AV systems. Technical support and maintenance contracts are crucial for ensuring the smooth operation of these complex systems. Cloud-based management solutions are gaining traction, offering easy access to real-time data and remote troubleshooting capabilities. The rise of one-on-one learning and homeschooling may negatively impact the demand for certain AV equipment, such as document cameras.
- However, the need for high-quality audio and visual experiences in remote learning environments remains strong. Overall, the market is expected to continue growing, driven by advancements in technology and the increasing demand for engaging and effective AV solutions.
Exclusive Customer Landscape
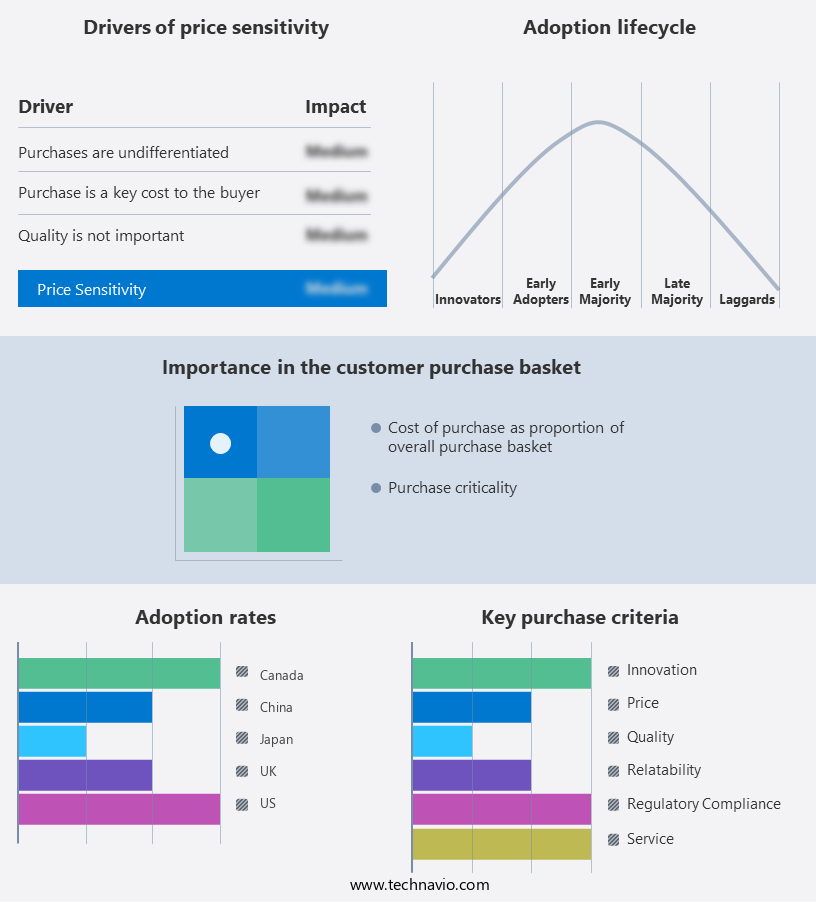
The pro av market forecasting report includes the adoption lifecycle of the market, covering from the innovator’s stage to the laggard’s stage. It focuses on adoption rates in different regions based on penetration. Furthermore, the pro av market report also includes key purchase criteria and drivers of price sensitivity to help companies evaluate and develop their market growth analysis strategies.

Customer Landscape
Key Companies & Market Insights
Companies are implementing various strategies, such as strategic alliances, pro av market forecast, partnerships, mergers and acquisitions, geographical expansion, and product/service launches, to enhance their presence in the industry.
Samsung Electronics - Professionally, we deliver advanced pro AV solutions: Microphone & Sound Systems, Request to Speak, Pro Audio Systems, Assistive Listening, Acoustics Management. Enhancing communication effectiveness through technology.
The industry research and growth report includes detailed analyses of the competitive landscape of the market and information about key companies, including:
- Samsung Electronics
- Sony Corporation
- LG Electronics
- Panasonic Corporation
- Hitachi Ltd.
- Yamaha Corporation
- AVI-SPL Inc.
- AVI Systems Inc.
- Anixter International Inc. (Wesco International Inc.)
- Biamp Systems LLC
- Harman International
Diversified
- Ford Audio-Video Systems LLC
- New Era Technology Inc.
- Solutionz Inc.
- Sennheiser Electronic GmbH & Co. KG
- Vistacom Inc.
- Professional Audio Visual Ltd.
- Almoe Digital Solutions
- Audinate Group Ltd.
Qualitative and quantitative analysis of companies has been conducted to help clients understand the wider business environment as well as the strengths and weaknesses of key industry players. Data is qualitatively analyzed to categorize companies as pure play, category-focused, industry-focused, and diversified; it is quantitatively analyzed to categorize companies as dominant, leading, strong, tentative, and weak.
Recent Development and News in Pro AV Market
- In January 2024, Christie Digital Systems, a leading player in the market, announced the launch of its new line of 4K laser projectors, the Christie Mirage Quad X4K, at the Consumer Electronics Show (CES) (Christie Digital Systems press release, 2024). This innovative product development marks a significant leap in image quality and brightness for large-format installations.
- In March 2024, Panasonic and Sony formed a strategic partnership to collaborate on the development and production of Pro AV displays using OLED technology. This collaboration aims to combine Panasonic's expertise in Pro AV solutions and Sony's OLED technology to create high-performance, energy-efficient displays for various applications (Panasonic press release, 2024).
- In May 2024, Barco, a global technology company, acquired Videotec, a leading provider of pan-tilt-zoom cameras and PTZ control systems. This strategic acquisition strengthened Barco's position in the market by expanding its product portfolio and enhancing its capabilities in the video surveillance and control systems segment (Barco press release, 2024).
- In April 2025, the European Union passed the Audiovisual Media Services Directive, which set new standards for audio-visual media services, including those used in Pro AV applications. The directive focused on issues like media literacy, the protection of minors, and the promotion of European content (European Parliament press release, 2025). This regulatory development will impact the market by necessitating compliance with new content and technical requirements.
Research Analyst Overview
- In the professional audio-visual (Pro AV) market, wireless microphones have gained significant traction, enabling mobility and flexibility during presentations. Sensor integration is another trend, allowing systems to respond to environmental conditions and optimize performance. KVM switching and data encryption ensure secure remote access to AV equipment. Fiber optic cables facilitate long-distance transmission of 4k and 8k resolution signals for superior image quality. Sound design and voice control enhance user experience, while unified communications and collaboration tools foster seamless communication and productivity.
- Digital media players and video processing technologies enable high-quality content delivery. Room acoustics remain a crucial factor, with solutions like artificial intelligence and machine learning optimizing sound performance. Automation systems streamline operations, while wireless transmission technologies enable gesture recognition and lighting control. Audio mixing and media servers provide advanced functionality for large-scale installations. Interactive displays offer immersive experiences, further elevating the market's potential.
Dive into Technavio’s robust research methodology, blending expert interviews, extensive data synthesis, and validated models for unparalleled Pro AV Market insights. See full methodology.
|
Market Scope
|
|
Report Coverage
|
Details
|
|
Page number
|
203
|
|
Base year
|
2024
|
|
Historic period
|
2019-2023 |
|
Forecast period
|
2025-2029
|
|
Growth momentum & CAGR
|
Accelerate at a CAGR of 10.4%
|
|
Market growth 2025-2029
|
USD 180.6 million
|
|
Market structure
|
Fragmented
|
|
YoY growth 2024-2025(%)
|
8.6
|
|
Key countries
|
US, China, UK, Canada, Japan, India, South Korea, Germany, France, Italy, Brazil, and UAE
|
|
Competitive landscape
|
Leading Companies, Market Positioning of Companies, Competitive Strategies, and Industry Risks
|
Request Free Sample
What are the Key Data Covered in this Pro AV Market Research and Growth Report?
- CAGR of the Pro AV industry during the forecast period
- Detailed information on factors that will drive the growth and forecasting between 2025 and 2029
- Precise estimation of the size of the market and its contribution of the industry in focus to the parent market
- Accurate predictions about upcoming growth and trends and changes in consumer behaviour
- Growth of the market across APAC, North America, Europe, South America, and Middle East and Africa
- Thorough analysis of the market’s competitive landscape and detailed information about companies
- Comprehensive analysis of factors that will challenge the pro av market growth of industry companies
We can help! Our analysts can customize this pro av market research report to meet your requirements.
Get in touch
1 Executive Summary
- 1.1 Market overview
- Executive Summary - Chart on Market Overview
- Executive Summary - Data Table on Market Overview
- Executive Summary - Chart on Global Market Characteristics
- Executive Summary - Chart on Market by Geography
- Executive Summary - Chart on Market Segmentation by Type
- Executive Summary - Chart on Market Segmentation by Industry Application
- Executive Summary - Chart on Incremental Growth
- Executive Summary - Data Table on Incremental Growth
- Executive Summary - Chart on Company Market Positioning
2 Technavio Analysis
- 2.1 Analysis of price sensitivity, lifecycle, customer purchase basket, adoption rates, and purchase criteria
- Analysis of price sensitivity, lifecycle, customer purchase basket, adoption rates, and purchase criteria
- 2.2 Criticality of inputs and Factors of differentiation
- Overview on criticality of inputs and factors of differentiation
- 2.3 Factors of disruption
- Overview on factors of disruption
- 2.4 Impact of drivers and challenges
- Impact of drivers and challenges in 2024 and 2029
3 Market Landscape
- 3.1 Market ecosystem
- Parent Market
- Data Table on - Parent Market
- 3.2 Market characteristics
- Market characteristics analysis
4 Market Sizing
- 4.1 Market definition
- Offerings of companies included in the market definition
- 4.2 Market segment analysis
- 4.4 Market outlook: Forecast for 2024-2029
- Chart on Global - Market size and forecast 2024-2029 ($ million)
- Data Table on Global - Market size and forecast 2024-2029 ($ million)
- Chart on Global Market: Year-over-year growth 2024-2029 (%)
- Data Table on Global Market: Year-over-year growth 2024-2029 (%)
5 Historic Market Size
- 5.1 Global Pro AV Market 2019 - 2023
- Historic Market Size - Data Table on Global Pro AV Market 2019 - 2023 ($ million)
- 5.2 Type segment analysis 2019 - 2023
- Historic Market Size - Type Segment 2019 - 2023 ($ million)
- 5.3 Industry Application segment analysis 2019 - 2023
- Historic Market Size - Industry Application Segment 2019 - 2023 ($ million)
- 5.4 Geography segment analysis 2019 - 2023
- Historic Market Size - Geography Segment 2019 - 2023 ($ million)
- 5.5 Country segment analysis 2019 - 2023
- Historic Market Size - Country Segment 2019 - 2023 ($ million)
6 Qualitative Analysis
- 6.1 Impact of AI on Global Pro AV Market
7 Five Forces Analysis
- 7.1 Five forces summary
- Five forces analysis - Comparison between 2024 and 2029
- 7.2 Bargaining power of buyers
- Bargaining power of buyers - Impact of key factors 2024 and 2029
- 7.3 Bargaining power of suppliers
- Bargaining power of suppliers - Impact of key factors in 2024 and 2029
- 7.4 Threat of new entrants
- Threat of new entrants - Impact of key factors in 2024 and 2029
- 7.5 Threat of substitutes
- Threat of substitutes - Impact of key factors in 2024 and 2029
- 7.6 Threat of rivalry
- Threat of rivalry - Impact of key factors in 2024 and 2029
- 7.7 Market condition
- Chart on Market condition - Five forces 2024 and 2029
8 Market Segmentation by Type
- 8.1 Market segments
- Chart on Type - Market share (2024-2029) (%)
- Data Table on Type - Market share (2024-2029) (%)
- 8.2 Comparison by Type
- Chart on Comparison by Type
- Data Table on Comparison by Type
- 8.3 Products - Market size and forecast (2024-2029)
- Chart on Products - Market size and forecast (2024-2029) ($ million)
- Data Table on Products - Market size and forecast (2024-2029) ($ million)
- Chart on Products - Year-over-year growth (2024-2029) (%)
- Data Table on Products - Year-over-year growth (2024-2029) (%)
- 8.4 Services - Market size and forecast (2024-2029)
- Chart on Services - Market size and forecast (2024-2029) ($ million)
- Data Table on Services - Market size and forecast (2024-2029) ($ million)
- Chart on Services - Year-over-year growth (2024-2029) (%)
- Data Table on Services - Year-over-year growth (2024-2029) (%)
- 8.5 Market opportunity by Type
- Market opportunity by Type ($ million)
- Data Table on Market opportunity by Type ($ million)
9 Market Segmentation by Industry Application
- 9.1 Market segments
- Chart on Industry Application - Market share (2024-2029) (%)
- Data Table on Industry Application - Market share (2024-2029) (%)
- 9.2 Comparison by Industry Application
- Chart on Comparison by Industry Application
- Data Table on Comparison by Industry Application
- 9.3 Entertainment - Market size and forecast (2024-2029)
- Chart on Entertainment - Market size and forecast (2024-2029) ($ million)
- Data Table on Entertainment - Market size and forecast (2024-2029) ($ million)
- Chart on Entertainment - Year-over-year growth (2024-2029) (%)
- Data Table on Entertainment - Year-over-year growth (2024-2029) (%)
- 9.4 Hospitality - Market size and forecast (2024-2029)
- Chart on Hospitality - Market size and forecast (2024-2029) ($ million)
- Data Table on Hospitality - Market size and forecast (2024-2029) ($ million)
- Chart on Hospitality - Year-over-year growth (2024-2029) (%)
- Data Table on Hospitality - Year-over-year growth (2024-2029) (%)
- 9.5 Retail - Market size and forecast (2024-2029)
- Chart on Retail - Market size and forecast (2024-2029) ($ million)
- Data Table on Retail - Market size and forecast (2024-2029) ($ million)
- Chart on Retail - Year-over-year growth (2024-2029) (%)
- Data Table on Retail - Year-over-year growth (2024-2029) (%)
- 9.6 Corporate - Market size and forecast (2024-2029)
- Chart on Corporate - Market size and forecast (2024-2029) ($ million)
- Data Table on Corporate - Market size and forecast (2024-2029) ($ million)
- Chart on Corporate - Year-over-year growth (2024-2029) (%)
- Data Table on Corporate - Year-over-year growth (2024-2029) (%)
- 9.7 Transportation - Market size and forecast (2024-2029)
- Chart on Transportation - Market size and forecast (2024-2029) ($ million)
- Data Table on Transportation - Market size and forecast (2024-2029) ($ million)
- Chart on Transportation - Year-over-year growth (2024-2029) (%)
- Data Table on Transportation - Year-over-year growth (2024-2029) (%)
- 9.8 Market opportunity by Industry Application
- Market opportunity by Industry Application ($ million)
- Data Table on Market opportunity by Industry Application ($ million)
10 Market Segmentation by Distribution Channel
- 10.1 Market segments
- Chart on Distribution Channel - Market share (2024-2029) (%)
- Data Table on Distribution Channel - Market share (2024-2029) (%)
- 10.2 Comparison by Distribution Channel
- Chart on Comparison by Distribution Channel
- Data Table on Comparison by Distribution Channel
- 10.3 Online - Market size and forecast (2024-2029)
- Chart on Online - Market size and forecast (2024-2029) ($ million)
- Data Table on Online - Market size and forecast (2024-2029) ($ million)
- Chart on Online - Year-over-year growth (2024-2029) (%)
- Data Table on Online - Year-over-year growth (2024-2029) (%)
- 10.4 Offline - Market size and forecast (2024-2029)
- Chart on Offline - Market size and forecast (2024-2029) ($ million)
- Data Table on Offline - Market size and forecast (2024-2029) ($ million)
- Chart on Offline - Year-over-year growth (2024-2029) (%)
- Data Table on Offline - Year-over-year growth (2024-2029) (%)
- 10.5 Market opportunity by Distribution Channel
- Market opportunity by Distribution Channel ($ million)
- Data Table on Market opportunity by Distribution Channel ($ million)
11 Market Segmentation by Technology
- 11.1 Market segments
- Chart on Technology - Market share (2024-2029) (%)
- Data Table on Technology - Market share (2024-2029) (%)
- 11.2 Comparison by Technology
- Chart on Comparison by Technology
- Data Table on Comparison by Technology
- 11.3 Wired Systems - Market size and forecast (2024-2029)
- Chart on Wired Systems - Market size and forecast (2024-2029) ($ million)
- Data Table on Wired Systems - Market size and forecast (2024-2029) ($ million)
- Chart on Wired Systems - Year-over-year growth (2024-2029) (%)
- Data Table on Wired Systems - Year-over-year growth (2024-2029) (%)
- 11.4 Wireless Systems - Market size and forecast (2024-2029)
- Chart on Wireless Systems - Market size and forecast (2024-2029) ($ million)
- Data Table on Wireless Systems - Market size and forecast (2024-2029) ($ million)
- Chart on Wireless Systems - Year-over-year growth (2024-2029) (%)
- Data Table on Wireless Systems - Year-over-year growth (2024-2029) (%)
- 11.5 Cloud-Based Solutions - Market size and forecast (2024-2029)
- Chart on Cloud-Based Solutions - Market size and forecast (2024-2029) ($ million)
- Data Table on Cloud-Based Solutions - Market size and forecast (2024-2029) ($ million)
- Chart on Cloud-Based Solutions - Year-over-year growth (2024-2029) (%)
- Data Table on Cloud-Based Solutions - Year-over-year growth (2024-2029) (%)
- 11.6 AI-Integrated Systems - Market size and forecast (2024-2029)
- Chart on AI-Integrated Systems - Market size and forecast (2024-2029) ($ million)
- Data Table on AI-Integrated Systems - Market size and forecast (2024-2029) ($ million)
- Chart on AI-Integrated Systems - Year-over-year growth (2024-2029) (%)
- Data Table on AI-Integrated Systems - Year-over-year growth (2024-2029) (%)
- 11.7 Market opportunity by Technology
- Market opportunity by Technology ($ million)
- Data Table on Market opportunity by Technology ($ million)
12 Customer Landscape
- 12.1 Customer landscape overview
- Analysis of price sensitivity, lifecycle, customer purchase basket, adoption rates, and purchase criteria
13 Geographic Landscape
- 13.1 Geographic segmentation
- Chart on Market share by geography 2024-2029 (%)
- Data Table on Market share by geography 2024-2029 (%)
- 13.2 Geographic comparison
- Chart on Geographic comparison
- Data Table on Geographic comparison
- 13.3 APAC - Market size and forecast 2024-2029
- Chart on APAC - Market size and forecast 2024-2029 ($ million)
- Data Table on APAC - Market size and forecast 2024-2029 ($ million)
- Chart on APAC - Year-over-year growth 2024-2029 (%)
- Data Table on APAC - Year-over-year growth 2024-2029 (%)
- 13.4 North America - Market size and forecast 2024-2029
- Chart on North America - Market size and forecast 2024-2029 ($ million)
- Data Table on North America - Market size and forecast 2024-2029 ($ million)
- Chart on North America - Year-over-year growth 2024-2029 (%)
- Data Table on North America - Year-over-year growth 2024-2029 (%)
- 13.5 Europe - Market size and forecast 2024-2029
- Chart on Europe - Market size and forecast 2024-2029 ($ million)
- Data Table on Europe - Market size and forecast 2024-2029 ($ million)
- Chart on Europe - Year-over-year growth 2024-2029 (%)
- Data Table on Europe - Year-over-year growth 2024-2029 (%)
- 13.6 South America - Market size and forecast 2024-2029
- Chart on South America - Market size and forecast 2024-2029 ($ million)
- Data Table on South America - Market size and forecast 2024-2029 ($ million)
- Chart on South America - Year-over-year growth 2024-2029 (%)
- Data Table on South America - Year-over-year growth 2024-2029 (%)
- 13.7 Middle East and Africa - Market size and forecast 2024-2029
- Chart on Middle East and Africa - Market size and forecast 2024-2029 ($ million)
- Data Table on Middle East and Africa - Market size and forecast 2024-2029 ($ million)
- Chart on Middle East and Africa - Year-over-year growth 2024-2029 (%)
- Data Table on Middle East and Africa - Year-over-year growth 2024-2029 (%)
- 13.8 US - Market size and forecast 2024-2029
- Chart on US - Market size and forecast 2024-2029 ($ million)
- Data Table on US - Market size and forecast 2024-2029 ($ million)
- Chart on US - Year-over-year growth 2024-2029 (%)
- Data Table on US - Year-over-year growth 2024-2029 (%)
- 13.9 China - Market size and forecast 2024-2029
- Chart on China - Market size and forecast 2024-2029 ($ million)
- Data Table on China - Market size and forecast 2024-2029 ($ million)
- Chart on China - Year-over-year growth 2024-2029 (%)
- Data Table on China - Year-over-year growth 2024-2029 (%)
- 13.10 UK - Market size and forecast 2024-2029
- Chart on UK - Market size and forecast 2024-2029 ($ million)
- Data Table on UK - Market size and forecast 2024-2029 ($ million)
- Chart on UK - Year-over-year growth 2024-2029 (%)
- Data Table on UK - Year-over-year growth 2024-2029 (%)
- 13.11 Canada - Market size and forecast 2024-2029
- Chart on Canada - Market size and forecast 2024-2029 ($ million)
- Data Table on Canada - Market size and forecast 2024-2029 ($ million)
- Chart on Canada - Year-over-year growth 2024-2029 (%)
- Data Table on Canada - Year-over-year growth 2024-2029 (%)
- 13.12 Japan - Market size and forecast 2024-2029
- Chart on Japan - Market size and forecast 2024-2029 ($ million)
- Data Table on Japan - Market size and forecast 2024-2029 ($ million)
- Chart on Japan - Year-over-year growth 2024-2029 (%)
- Data Table on Japan - Year-over-year growth 2024-2029 (%)
- 13.13 India - Market size and forecast 2024-2029
- Chart on India - Market size and forecast 2024-2029 ($ million)
- Data Table on India - Market size and forecast 2024-2029 ($ million)
- Chart on India - Year-over-year growth 2024-2029 (%)
- Data Table on India - Year-over-year growth 2024-2029 (%)
- 13.14 South Korea - Market size and forecast 2024-2029
- Chart on South Korea - Market size and forecast 2024-2029 ($ million)
- Data Table on South Korea - Market size and forecast 2024-2029 ($ million)
- Chart on South Korea - Year-over-year growth 2024-2029 (%)
- Data Table on South Korea - Year-over-year growth 2024-2029 (%)
- 13.15 Germany - Market size and forecast 2024-2029
- Chart on Germany - Market size and forecast 2024-2029 ($ million)
- Data Table on Germany - Market size and forecast 2024-2029 ($ million)
- Chart on Germany - Year-over-year growth 2024-2029 (%)
- Data Table on Germany - Year-over-year growth 2024-2029 (%)
- 13.16 France - Market size and forecast 2024-2029
- Chart on France - Market size and forecast 2024-2029 ($ million)
- Data Table on France - Market size and forecast 2024-2029 ($ million)
- Chart on France - Year-over-year growth 2024-2029 (%)
- Data Table on France - Year-over-year growth 2024-2029 (%)
- 13.17 Italy - Market size and forecast 2024-2029
- Chart on Italy - Market size and forecast 2024-2029 ($ million)
- Data Table on Italy - Market size and forecast 2024-2029 ($ million)
- Chart on Italy - Year-over-year growth 2024-2029 (%)
- Data Table on Italy - Year-over-year growth 2024-2029 (%)
- 13.18 Market opportunity by geography
- Market opportunity by geography ($ million)
- Data Tables on Market opportunity by geography ($ million)
- 13.19 Brazil - Market size and forecast (2024-2029)
- Chart on Brazil - Market size and forecast (2024-2029) ($ million)
- Data Table on Brazil - Market size and forecast (2024-2029) ($ million)
- Chart on Brazil - Year-over-year growth (2024-2029) (%)
- Data Table on Brazil - Year-over-year growth (2024-2029) (%)
- 13.20 UAE - Market size and forecast (2024-2029)
- Chart on UAE - Market size and forecast (2024-2029) ($ million)
- Data Table on UAE - Market size and forecast (2024-2029) ($ million)
- Chart on UAE - Year-over-year growth (2024-2029) (%)
- Data Table on UAE - Year-over-year growth (2024-2029) (%)
- 13.21 Rest of World (ROW) - Market size and forecast (2024-2029)
- Chart on Rest of World (ROW) - Market size and forecast (2024-2029) ($ million)
- Data Table on Rest of World (ROW) - Market size and forecast (2024-2029) ($ million)
- Chart on Rest of World (ROW) - Year-over-year growth (2024-2029) (%)
- Data Table on Rest of World (ROW) - Year-over-year growth (2024-2029) (%)
14 Drivers, Challenges, and Opportunity/Restraints
- 14.3 Impact of drivers and challenges
- Impact of drivers and challenges in 2024 and 2029
- 14.4 Market opportunities/restraints
15 Competitive Landscape
- 15.2 Competitive Landscape
- Overview on criticality of inputs and factors of differentiation
- 15.3 Landscape disruption
- Overview on factors of disruption
- 15.4 Industry risks
- Impact of key risks on business
16 Competitive Analysis
- 16.2 Market positioning of companies
- Matrix on companies position and classification
- 16.3 Samsung Electronics
- Samsung Electronics - Overview
- Samsung Electronics - Product / Service
- Samsung Electronics - Key offerings
- 16.4 Sony Corporation
- Sony Corporation - Overview
- Sony Corporation - Product / Service
- Sony Corporation - Key offerings
- 16.5 LG Electronics
- LG Electronics - Overview
- LG Electronics - Product / Service
- LG Electronics - Key offerings
- 16.6 Panasonic Corporation
- Panasonic Corporation - Overview
- Panasonic Corporation - Product / Service
- Panasonic Corporation - Key offerings
- 16.7 Hitachi Ltd.
- Hitachi Ltd. - Overview
- Hitachi Ltd. - Product / Service
- Hitachi Ltd. - Key offerings
- 16.8 Yamaha Corporation
- Yamaha Corporation - Overview
- Yamaha Corporation - Product / Service
- Yamaha Corporation - Key offerings
- 16.9 AVI-SPL Inc.
- AVI-SPL Inc. - Overview
- AVI-SPL Inc. - Product / Service
- AVI-SPL Inc. - Key offerings
- 16.10 AVI Systems Inc.
- AVI Systems Inc. - Overview
- AVI Systems Inc. - Product / Service
- AVI Systems Inc. - Key offerings
- 16.11 Anixter International Inc. (Wesco International Inc.)
- Anixter International Inc. (Wesco International Inc.) - Overview
- Anixter International Inc. (Wesco International Inc.) - Product / Service
- Anixter International Inc. (Wesco International Inc.) - Key offerings
- 16.12 Biamp Systems LLC
- Biamp Systems LLC - Overview
- Biamp Systems LLC - Product / Service
- Biamp Systems LLC - Key offerings
- 16.13 Harman International
Diversified- Harman International
Diversified - Overview - Harman International
Diversified - Product / Service - Harman International
Diversified - Key offerings
- 16.14 Ford Audio-Video Systems LLC
- Ford Audio-Video Systems LLC - Overview
- Ford Audio-Video Systems LLC - Product / Service
- Ford Audio-Video Systems LLC - Key offerings
- 16.15 New Era Technology Inc.
- New Era Technology Inc. - Overview
- New Era Technology Inc. - Product / Service
- New Era Technology Inc. - Key offerings
- 16.16 Solutionz Inc.
- Solutionz Inc. - Overview
- Solutionz Inc. - Product / Service
- Solutionz Inc. - Key offerings
- 16.17 Sennheiser Electronic GmbH & Co. KG
- Sennheiser Electronic GmbH & Co. KG - Overview
- Sennheiser Electronic GmbH & Co. KG - Product / Service
- Sennheiser Electronic GmbH & Co. KG - Key offerings
- 16.18 Vistacom Inc.
- Vistacom Inc. - Overview
- Vistacom Inc. - Product / Service
- Vistacom Inc. - Key offerings
- 16.19 Professional Audio Visual Ltd.
- Professional Audio Visual Ltd. - Overview
- Professional Audio Visual Ltd. - Product / Service
- Professional Audio Visual Ltd. - Key offerings
- 16.20 Almoe Digital Solutions
- Almoe Digital Solutions - Overview
- Almoe Digital Solutions - Product / Service
- Almoe Digital Solutions - Key offerings
- 16.21 Audinate Group Ltd.
- Audinate Group Ltd. - Overview
- Audinate Group Ltd. - Product / Service
- Audinate Group Ltd. - Key offerings
- 16.22 Applied Electronics Ltd.
- Applied Electronics Ltd. - Overview
- Applied Electronics Ltd. - Product / Service
- Applied Electronics Ltd. - Key offerings
- 16.23 Arista Networks Inc.
- Arista Networks Inc. - Overview
- Arista Networks Inc. - Product / Service
- Arista Networks Inc. - Key offerings
- 16.24 Audinate Group Ltd.
- Audinate Group Ltd. - Overview
- Audinate Group Ltd. - Product / Service
- Audinate Group Ltd. - Key offerings
- 16.25 AVI SPL LLC
- AVI SPL LLC - Overview
- AVI SPL LLC - Product / Service
- AVI SPL LLC - Key offerings
- 16.26 AVI Systems
- AVI Systems - Overview
- AVI Systems - Product / Service
- AVI Systems - Key offerings
- 16.27 CCS Presentation Systems
- CCS Presentation Systems - Overview
- CCS Presentation Systems - Product / Service
- CCS Presentation Systems - Key offerings
- 16.28 Diversified
- Diversified - Overview
- Diversified - Product / Service
- Diversified - Key offerings
- 16.29 Ford Audio Video LLC
- Ford Audio Video LLC - Overview
- Ford Audio Video LLC - Product / Service
- Ford Audio Video LLC - Key offerings
- 16.30 Godrej and Boyce Manufacturing Co. Ltd.
- Godrej and Boyce Manufacturing Co. Ltd. - Overview
- Godrej and Boyce Manufacturing Co. Ltd. - Product / Service
- Godrej and Boyce Manufacturing Co. Ltd. - Key offerings
- 16.31 ITOCHU Corp.
- ITOCHU Corp. - Overview
- ITOCHU Corp. - Product / Service
- ITOCHU Corp. - Key offerings
- 16.32 LG Corp.
- LG Corp. - Overview
- LG Corp. - Product / Service
- LG Corp. - Key offerings
- 16.33 New Era Technology
- New Era Technology - Overview
- New Era Technology - Product / Service
- New Era Technology - Key offerings
- 16.34 Pro AV Solutions Pty Ltd.
- Pro AV Solutions Pty Ltd. - Overview
- Pro AV Solutions Pty Ltd. - Product / Service
- Pro AV Solutions Pty Ltd. - Key offerings
- 16.35 Samsung Electronics Co. Ltd.
- Samsung Electronics Co. Ltd. - Overview
- Samsung Electronics Co. Ltd. - Product / Service
- Samsung Electronics Co. Ltd. - Key offerings
- 16.36 Semtech Corp.
- Semtech Corp. - Overview
- Semtech Corp. - Product / Service
- Semtech Corp. - Key offerings
- 16.37 Solutionz Inc.
- Solutionz Inc. - Overview
- Solutionz Inc. - Product / Service
- Solutionz Inc. - Key offerings
- 16.38 Synergy Measurement Technologies Pvt. Ltd.
- Synergy Measurement Technologies Pvt. Ltd. - Overview
- Synergy Measurement Technologies Pvt. Ltd. - Product / Service
- Synergy Measurement Technologies Pvt. Ltd. - Key offerings
- 16.39 Vistacom Inc.
- Vistacom Inc. - Overview
- Vistacom Inc. - Product / Service
- Vistacom Inc. - Key offerings
- 16.40 WESCO International Inc.
- WESCO International Inc. - Overview
- WESCO International Inc. - Product / Service
- WESCO International Inc. - Key offerings
17 Appendix
- 17.2 Inclusions and exclusions checklist
- Inclusions checklist
- Exclusions checklist
- 17.3 Currency conversion rates for US$
- Currency conversion rates for US$
- 17.4 Research methodology
- 17.7 Validation techniques employed for market sizing
- Validation techniques employed for market sizing
- 17.9 360 degree market analysis
- 360 degree market analysis
- 17.10 List of abbreviations