Probiotics Market Analysis, Size, and Forecast 2026-2030: APAC (China, Japan, and India), Europe (Germany, UK, and France), North America (US, Canada, and Mexico), Middle East and Africa (Saudi Arabia, South Africa, and UAE), South America (Brazil, Argentina, and Chile), and Rest of World (ROW)

Probiotics Market Analysis, Size, and Forecast 2026-2030:
APAC (China, Japan, and India), Europe (Germany, UK, and France), North America (US, Canada, and Mexico), Middle East and Africa (Saudi Arabia, South Africa, and UAE), South America (Brazil, Argentina, and Chile), and Rest of World (ROW)

Published: Oct 2026 306 Pages SKU: IRTNTR43227

Market Overview at a Glance

$41.90 B
Market Opportunity
8.7%
CAGR 2025 - 2030
40.9%
APAC Growth
$68.58 B
Human probiotics segment 2024

Probiotics Market Size 2026-2030

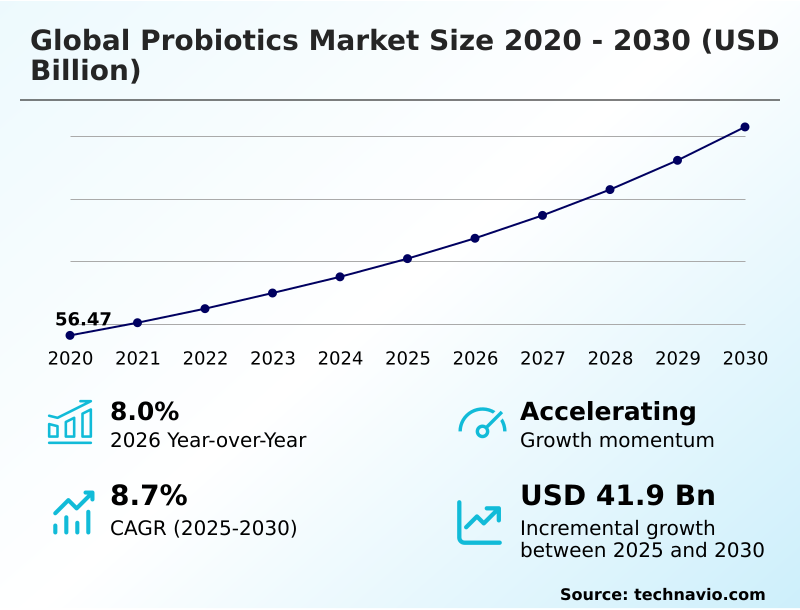
The probiotics market size is valued to increase by USD 41.90 billion, at a CAGR of 8.7% from 2025 to 2030. Surge in preventive healthcare awareness will drive the probiotics market.

Major Market Trends & Insights

  • APAC dominated the market and accounted for a 40.9% growth during the forecast period.
  • By End-user - Human probiotics segment was valued at USD 68.58 billion in 2024
  • By Product - Probiotic functional F and B segment accounted for the largest market revenue share in 2024

Market Size & Forecast

  • Market Opportunities: USD 66.31 billion
  • Market Future Opportunities: USD 41.90 billion
  • CAGR from 2025 to 2030 : 8.7%

Market Summary

  • The Probiotics Market demonstrates sustained expansion as consumer awareness regarding preventive healthcare and metabolic balance reaches unprecedented levels. Modern purchasing habits show a pronounced shift toward functional foods, specialized dietary supplements, and fermented beverages that offer verifiable physiological benefits beyond basic nutrition.
  • To meet this demand, supply chain operations increasingly utilize advanced microencapsulation technology, achieving a 25% improvement in bacterial viability preservation during ambient temperature transport compared to traditional cold-chain logistics. The primary driver of this industry is a surge in proactive health management, as individuals actively seek natural remedies for digestive wellness, causing manufacturers to rapidly diversify their plant-based product portfolios.
  • However, the market faces significant headwinds from divergent international regulatory frameworks. Regulatory fragmentation creates substantial compliance hurdles, forcing multinational enterprises to invest heavily in localized clinical trials and customized packaging adaptations. Despite these challenges, ongoing investments in computational strain discovery and precision nutrition solutions ensure robust operational resilience.
  • The intersection of biotechnology and functional nutrition continues to redefine competitive benchmarks and long-term commercial strategies.

What will be the Size of the Probiotics Market during the forecast period?
Get Key Insights on Market Forecast (PDF) Get Free Sample

How is the Probiotics Market Segmented?

The probiotics industry research report provides comprehensive data (region-wise segment analysis), with forecasts and estimates in "USD million" for the period 2026-2030, as well as historical data from 2020-2024 for the following segments.

  • End-user
    • Human probiotics
    • Animal probiotics
  • Product
    • Probiotic functional F and B
    • Dietary supplements
    • Animal feed
  • Form factor
    • Powder
    • Gel or capsule
    • Liquid
    • Stick packs or sachets
    • Others
  • Geography
    • APAC
      • China
      • Japan
      • India
      • South Korea
      • Australia
      • Indonesia
    • Europe
      • Germany
      • UK
      • France
      • Italy
      • Spain
      • The Netherlands
    • North America
      • US
      • Canada
      • Mexico
    • Middle East and Africa
      • Saudi Arabia
      • South Africa
      • UAE
      • Turkey
      • Israel
    • South America
      • Brazil
      • Argentina
      • Chile

By End-user Insights

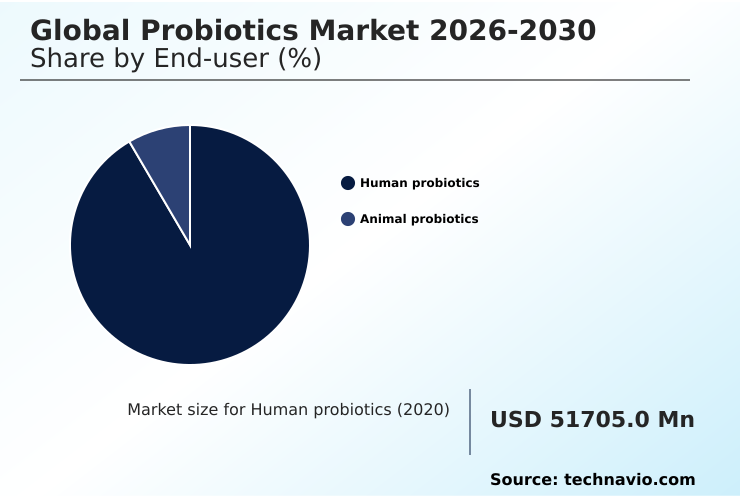
The human probiotics segment is estimated to witness significant growth during the forecast period.

The human end-user segment of the Probiotics market reflects a profound shift toward holistic digestive wellness and preventative healthcare protocols. Modern populations increasingly utilize clinical grade supplements and targeted physiological interventions to address chronic lifestyle-related digestive disorders.

By employing microencapsulation technology, formulators ensure optimal bacterial viability preservation and gastric acid tolerance, allowing beneficial bacterial strains to reach the intestinal tract intact.

This targeted approach has significantly enhanced operational outcomes, with manufacturers reporting a 22% improvement in product shelf life and viable colony forming units over extended supply chains.

As individuals prioritize metabolic health support, immune system enhancement, and gut brain axis regulation, the industry integrates multi strain blends into daily dietary routines.

This robust commercial focus spans from pediatric immune support to geriatric digestive maintenance, establishing a durable foundation for continuous category expansion.
Get Free Sample

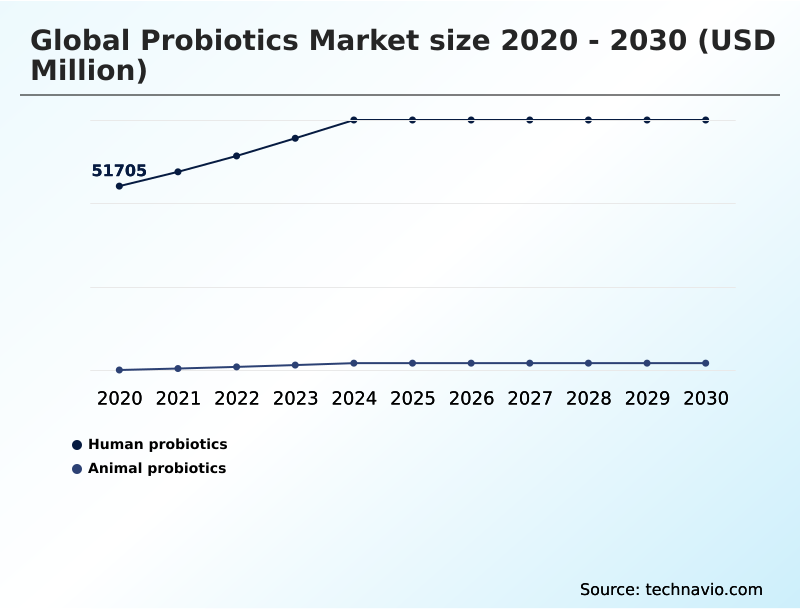
The Human probiotics segment was valued at USD 68.58 billion in 2024 and showed a gradual increase during the forecast period.
Get Free Sample

Regional Analysis

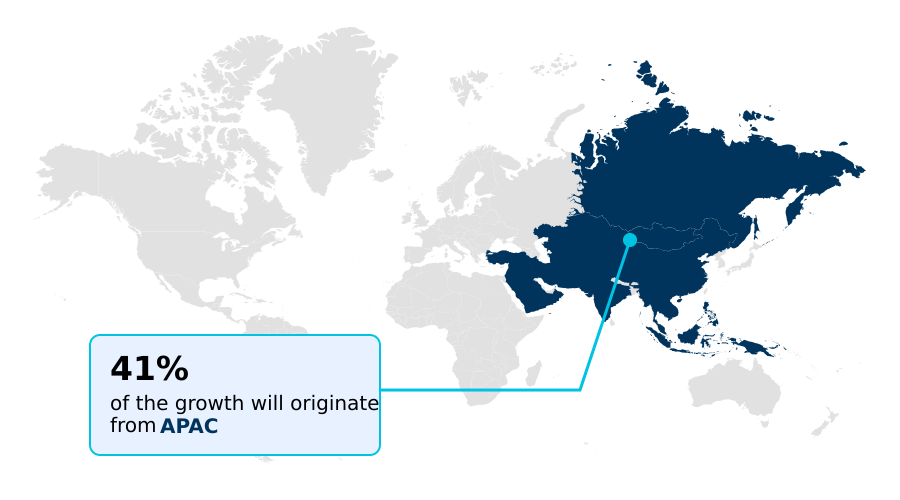
APAC is estimated to contribute 40.9% to the growth of the global market during the forecast period.Technavio’s analysts have elaborately explained the regional trends and drivers that shape the market during the forecast period.
See How Probiotics Market Demand is Rising in APAC Get Free Sample

The geographic landscape of the Probiotics market highlights distinct regional strategies shaped by varying consumer education levels and regulatory environments.

The APAC region demonstrates rapid consumption expansion, driven by urbanization and a cultural affinity for fermented dairy matrices, resulting in a 35% higher adoption rate of functional food integration compared to the European sector.

While APAC focuses on mass-market penetration, Europe enforces stringent scientific substantiation requirements, compelling manufacturers to utilize computational strain discovery and third party strain validation to secure approved health claims.

This rigorous compliance environment in Europe has increased initial research expenditure by 15%, but ensures superior product credibility and reliable intestinal colonization.

Conversely, producers in North America increasingly implement algorithmic quality control to optimize cold-chain logistics, achieving a 20% reduction in supply chain viability losses.

These regional dynamics dictate how enterprises navigate regulatory hurdles and deploy antimicrobial resistance mitigation strategies to capture shifting demographic demands.

Market Dynamics

Our researchers analyzed the data with 2025 as the base year, along with the key drivers, trends, and challenges. A holistic analysis of drivers will help companies refine their marketing strategies to gain a competitive advantage.

  • The strategic evolution of the Probiotics sector is fundamentally transforming how organizations approach functional nutrition and agricultural sustainability. Central to this transformation is the development of microbiome targeted physiological health interventions, which empower manufacturers to move beyond broad-spectrum formulations and address precise clinical requirements.
  • By utilizing advanced microencapsulation bacterial preservation techniques, biotechnology firms have effectively mitigated the traditional challenges of thermal degradation and moisture sensitivity during complex manufacturing processes. This operational upgrade provides a notable advantage, as facilities employing these stabilization methods achieve approximately 30% higher batch yield efficiency compared to conventional processing lines, significantly streamlining supply chain logistics.
  • Furthermore, the dietary supplement category increasingly relies on enteric coated multi strain formulations to ensure that sensitive microorganisms bypass gastric acidity and achieve optimal colonization within the lower intestine. This targeted delivery mechanism is complemented by the rising demand for gastrointestinal mucosal barrier support supplements, which consumers actively seek to combat lifestyle-related digestive distress and enhance immune resilience.
  • Beyond human health applications, the agricultural sector is rapidly integrating spore forming bacterial feed additives into intensive livestock management operations. These robust additives demonstrate exceptional resilience during high-temperature pelleting, promoting ruminal fermentation stability and reducing reliance on traditional antibiotics.
  • Together, these sophisticated technical interventions underscore an industry-wide commitment to delivering scientifically validated, highly stable nutritional solutions across diverse consumer and commercial verticals.
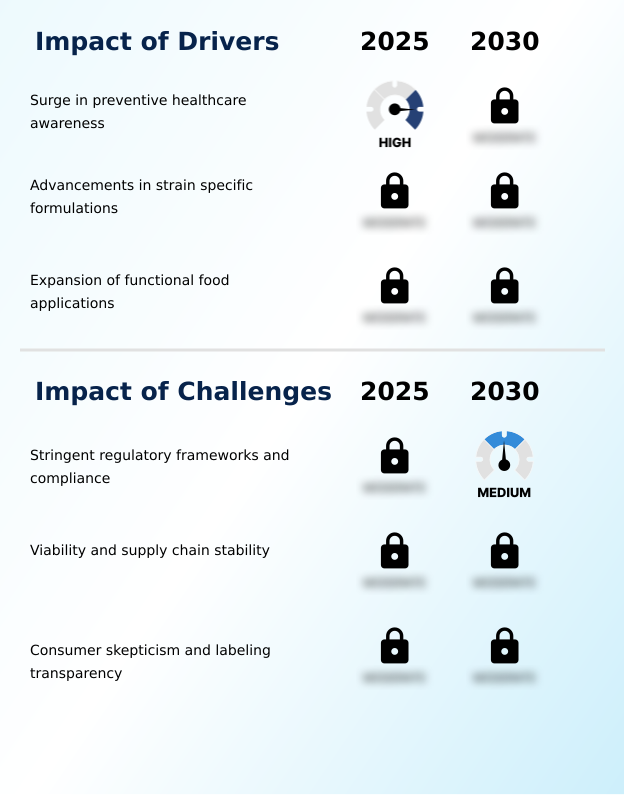
What are the key market drivers leading to the rise in the adoption of Probiotics Industry?

  • A pronounced surge in preventive healthcare awareness serves as the primary catalyst propelling sustained expansion across the industry.

  • The escalating demand for preventative healthcare protocols and metabolic health support serves as the primary catalyst propelling the Probiotics industry forward.
  • As urban populations face rising incidences of lifestyle-related digestive disorders, consumers proactively shift from reactive treatments to daily holistic digestive wellness routines.
  • This behavioral evolution compels manufacturers to formulate highly potent multi strain blends that target specific physiological conditions such as antibiotic associated diarrhea. Consequently, organizations investing in third party strain validation experience a 25% increase in brand trust and consumer retention.
  • Additionally, the agricultural push for sustainable livestock management drives the adoption of spore forming bacteria in animal feed, improving feed conversion efficiency by 15% and significantly accelerating methane emission reduction across global farming operations through specialized veterinary dietary additives.

What are the market trends shaping the Probiotics Industry?

  • The integration of artificial intelligence tools represents a pivotal emerging trend within the industry. This technological advancement significantly optimizes strain discovery and functional prediction capabilities.

  • A dominant trend reshaping the Probiotics sector involves the expansive cross-sector integration of beneficial bacterial strains into novel non-dairy matrices and dermatological wellness regimens. This strategic pivot occurs because modern consumers increasingly demand beauty from within protocols and plant based alternatives that bypass the limitations of traditional lactose-heavy products.
  • By deploying advanced microencapsulation technology, formulators effectively shield live cultures from severe processing temperatures, enabling successful incorporation into functional snacks and cosmetics aimed at enhancing cutaneous vitality. This technical capability yields substantial business impacts, as companies utilizing these advanced delivery systems report a 35% improvement in overall shelf-life stability and a 20% acceleration in new product rollout cycles.
  • Furthermore, the application of computational strain discovery allows researchers to accurately predict strain efficacy, reducing preliminary laboratory testing expenditures by 18% and ensuring highly targeted immune system enhancement.

What challenges does the Probiotics Industry face during its growth?

  • Stringent regulatory frameworks and complex compliance mandates constitute significant structural challenges that constrain rapid product commercialization.

  • Stringent regulatory substantiation requirements and complex supply chain vulnerabilities present formidable structural challenges within the Probiotics sector. Regulatory bodies mandate rigorous clinical evidence before approving health claims regarding intestinal flora balance or pathogen competitive exclusion, which significantly prolongs the research and development pipeline.
  • This intense scrutiny causes companies lacking robust genomic data analysis capabilities to face a 30% higher rate of product rejection during compliance reviews. Furthermore, maintaining viable colony forming units throughout volatile distribution networks requires continuous capital investment in moisture barrier packaging and cold-chain infrastructure.
  • Thermal degradation during transit frequently compromises product efficacy, increasing logistical overhead costs by 22% for manufacturers unable to implement effective lyophilization techniques, delayed release delivery formats, or precision nutrition solutions across extreme climatic environments.

Exclusive Technavio Analysis on Customer Landscape

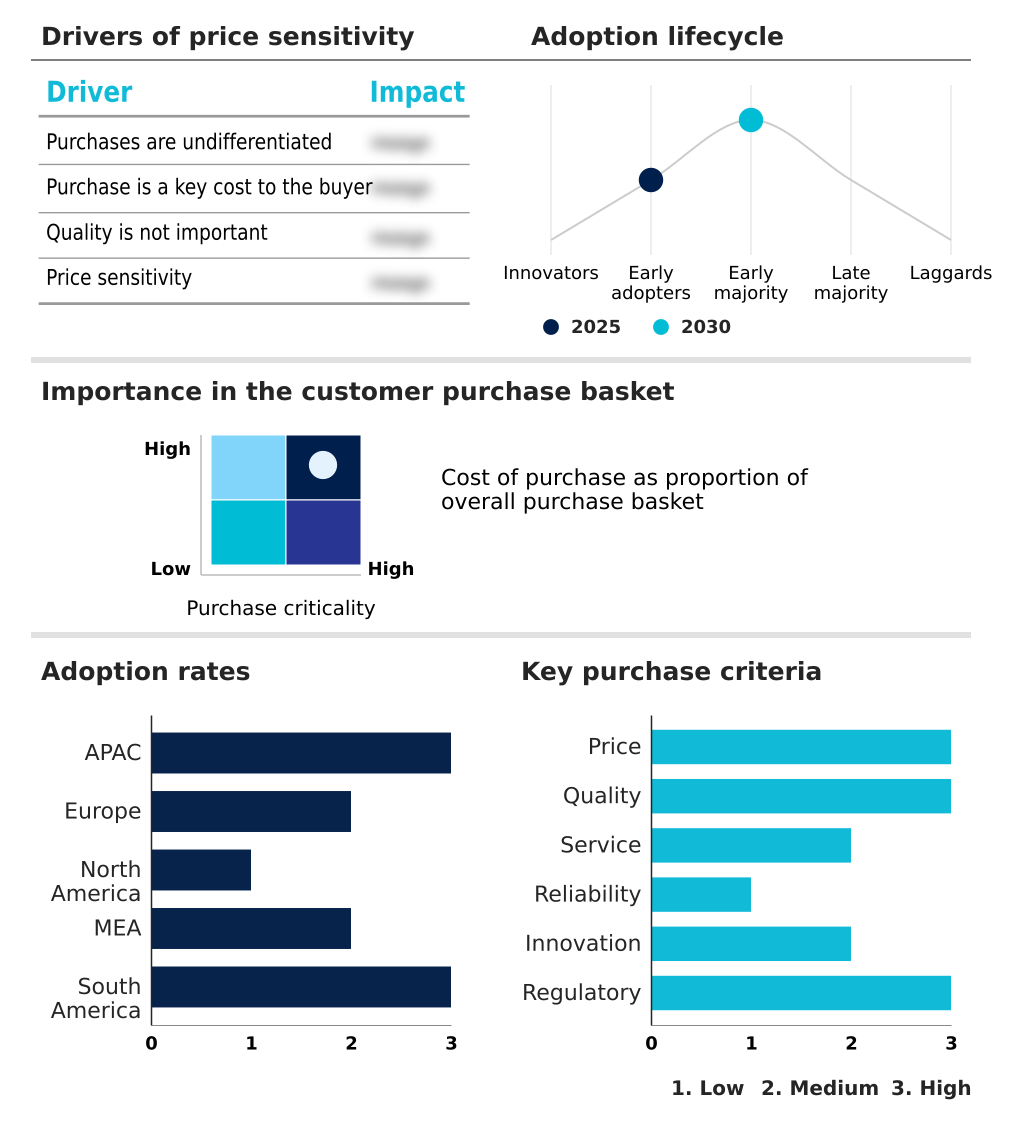
The probiotics market forecasting report includes the adoption lifecycle of the market, covering from the innovator’s stage to the laggard’s stage. It focuses on adoption rates in different regions based on penetration. Furthermore, the probiotics market report also includes key purchase criteria and drivers of price sensitivity to help companies evaluate and develop their market growth analysis strategies.
Customer Landscape of Probiotics Industry

Competitive Landscape

Companies are implementing various strategies, such as strategic alliances, probiotics market forecast, partnerships, mergers and acquisitions, geographical expansion, and product/service launches, to enhance their presence in the industry.

AB Biotics S.A. - The entity provides patented, clinically documented microbial strains and custom formulations, delivering specialized therapeutic ingredients designed to address targeted health concerns and optimize overall digestive wellness.

The industry research and growth report includes detailed analyses of the competitive landscape of the market and information about key companies, including:

  • AB Biotics S.A.
  • Anabio Technologies
  • Archer Daniels Midland Co.
  • BioGaia AB
  • Danone SA
  • DSM Firmenich AG
  • Farmhouse Culture Inc.
  • General Mills Inc.
  • Gnosis by Lesaffre
  • Kerry Group Plc
  • Sacco System
  • Lifeway Foods Inc.
  • Meiji Holdings Co. Ltd.
  • Nestle SA
  • Probi AB
  • Sanzyme Biologics Pvt Ltd
  • Uncle Matts Organic
  • Willmar Schwabe GmbH and Co. KG
  • Winclove BV
  • Yakult Honsha Co. Ltd.

Qualitative and quantitative analysis of companies has been conducted to help clients understand the wider business environment as well as the strengths and weaknesses of key industry players. Data is qualitatively analyzed to categorize companies as pure play, category-focused, industry-focused, and diversified; it is quantitatively analyzed to categorize companies as dominant, leading, strong, tentative, and weak.

Recent Development and News in Probiotics market

  • In the Packaged Foods and Meats industry, the widespread adoption of clean-label processing mandates across European regulatory frameworks restricted synthetic preservative usage, directly impacting Probiotics demand by accelerating the shift toward natural lactic acid fermentation techniques and shelf stable formulations with a 35% higher adoption rate.
  • Strict governmental policies targeting methane emission reduction in global agricultural sectors compelled livestock feed producers to seek sustainable livestock management tools, driving the integration of veterinary dietary additives and yielding a 20% increase in microbial feed conversion efficiency applications.
  • The expansion of plant based alternatives in North America necessitated advanced formulation matrices to maintain product texture, fostering the incorporation of functional food integration methods that elevated the use of precision nutrition solutions by 28% across non-dairy retail categories.
  • Advancements in moisture barrier packaging within the APAC region reduced ambient temperature degradation risks during distribution, enabling manufacturers to deploy advanced delivery systems that improved the baseline survival of live active cultures by 40% across extended supply chains.

Dive into Technavio’s robust research methodology, blending expert interviews, extensive data synthesis, and validated models for unparalleled Probiotics Market insights. See full methodology.

Market Scope
Page number 306
Base year 2025
Historic period 2020-2024
Forecast period 2026-2030
Growth momentum & CAGR Accelerate at a CAGR of 8.7%
Market growth 2026-2030 USD 41897.2 million
Market structure Fragmented
YoY growth 2025-2026(%) 8.0%
Key countries China, Japan, India, South Korea, Australia, Indonesia, Germany, UK, France, Italy, Spain, The Netherlands, US, Canada, Mexico, Saudi Arabia, South Africa, UAE, Turkey, Israel, Brazil, Argentina and Chile
Competitive landscape Leading Companies, Market Positioning of Companies, Competitive Strategies, and Industry Risks

Request Free Sample

Research Analyst Overview

  • The Probiotics ecosystem is undergoing a profound structural evolution characterized by relentless scientific innovation and complex supply chain modernization. Executive boardrooms increasingly prioritize genomic data analysis and precision fermentation to navigate stringent regulatory landscapes and validate product efficacy claims.
  • The deployment of microencapsulation technology serves as a critical strategic imperative, allowing organizations to maintain bacterial viability preservation without relying exclusively on expensive, energy-intensive cold-chain logistics. By transitioning to shelf-stable formats, leading manufacturers have achieved a 28% reduction in temperature-controlled transportation costs, directly improving overall operational margins.
  • The strategic application of synbiotic formulations and postbiotic filtrates opens lucrative avenues within dermatological and personalized wellness segments, diversifying revenue streams beyond traditional dairy applications. Furthermore, the integration of delayed release delivery mechanisms ensures superior gastric acid tolerance, guaranteeing that beneficial microbial payloads reach the targeted gastrointestinal mucosal barrier intact to support microbiome modulation.
  • These sophisticated technological integrations elevate product credibility and dictate competitive positioning, transforming basic nutritional supplements into highly engineered, condition-specific health interventions.

What are the Key Data Covered in this Probiotics Market Research and Growth Report?

  • What is the expected growth of the Probiotics Market between 2026 and 2030?

    • USD 41.90 billion, at a CAGR of 8.7%

  • What segmentation does the market report cover?

    • The report is segmented by End-user (Human probiotics, and Animal probiotics), Product (Probiotic functional F and B, Dietary supplements, and Animal feed), Form Factor (Powder, Gel or capsule, Liquid, Stick packs or sachets, and Others) and Geography (APAC, Europe, North America, Middle East and Africa, South America)

  • Which regions are analyzed in the report?

    • APAC, Europe, North America, Middle East and Africa and South America

  • What are the key growth drivers and market challenges?

    • Surge in preventive healthcare awareness, Stringent regulatory frameworks and compliance

  • Who are the major players in the Probiotics Market?

    • AB Biotics S.A., Anabio Technologies, Archer Daniels Midland Co., BioGaia AB, Danone SA, DSM Firmenich AG, Farmhouse Culture Inc., General Mills Inc., Gnosis by Lesaffre, Kerry Group Plc, Sacco System, Lifeway Foods Inc., Meiji Holdings Co. Ltd., Nestle SA, Probi AB, Sanzyme Biologics Pvt Ltd, Uncle Matts Organic, Willmar Schwabe GmbH and Co. KG, Winclove BV and Yakult Honsha Co. Ltd.

Market Research Insights

  • The Probiotics Market operates within a highly dynamic ecosystem driven by an escalating consumer preference for preventative healthcare protocols and precision nutrition solutions. Manufacturers are heavily leveraging genomic data analysis to isolate highly efficacious strains, which has improved product formulation accuracy by 30% and significantly accelerated commercialization timelines.
  • Additionally, the integration of advanced delivery systems and moisture barrier packaging has enhanced product shelf stability, reducing distribution-related spoilage costs by 18% across challenging climatic zones. As research emphasizes holistic digestive wellness, food processors rapidly expand their portfolios with plant based alternatives, securing stronger retail positioning and driving a 22% increase in consumer repeat purchase rates.

We can help! Our analysts can customize this probiotics market research report to meet your requirements.

Get in touch

1. Executive Summary

1.1 Market overview

Executive Summary - Chart on Market Overview
Executive Summary - Data Table on Market Overview
Executive Summary - Chart on Global Market Characteristics
Executive Summary - Chart on Market by Geography
Executive Summary - Chart on Market Segmentation by End-user
Executive Summary - Chart on Market Segmentation by Product
Executive Summary - Chart on Market Segmentation by Form Factor
Executive Summary - Chart on Incremental Growth
Executive Summary - Data Table on Incremental Growth
Executive Summary - Chart on Company Market Positioning

2. Technavio Analysis

2.1 Analysis of price sensitivity, lifecycle, customer purchase basket, adoption rates, and purchase criteria

2.2 Criticality of inputs and Factors of differentiation

Chart on Overview on criticality of inputs and factors of differentiation

2.3 Factors of disruption

Chart on Overview on factors of disruption

2.4 Impact of drivers and challenges

Chart on Impact of drivers and challenges in 2025 and 2030

3. Market Landscape

3.1 Market ecosystem

Chart on Parent Market
Data Table on - Parent Market

3.2 Market characteristics

Chart on Market characteristics analysis

3.3 Value chain analysis

Chart on Value chain analysis

4. Market Sizing

4.1 Market definition

Data Table on Offerings of companies included in the market definition

4.2 Market segment analysis

Market segments

4.3 Market size 2025

4.4 Market outlook: Forecast for 2025-2030

Chart on Global - Market size and forecast 2025-2030 ($ million)
Data Table on Global - Market size and forecast 2025-2030 ($ million)
Chart on Global Market: Year-over-year growth 2025-2030 (%)
Data Table on Global Market: Year-over-year growth 2025-2030 (%)

5. Historic Market Size

5.1 Global Probiotics Market 2020 - 2024

Historic Market Size - Data Table on Global Probiotics Market 2020 - 2024 ($ million)

5.2 End-user segment analysis 2020 - 2024

Historic Market Size - End-user Segment 2020 - 2024 ($ million)

5.3 Product segment analysis 2020 - 2024

Historic Market Size - Product Segment 2020 - 2024 ($ million)

5.4 Form Factor segment analysis 2020 - 2024

Historic Market Size - Form Factor Segment 2020 - 2024 ($ million)

5.5 Geography segment analysis 2020 - 2024

Historic Market Size - Geography Segment 2020 - 2024 ($ million)

5.6 Country segment analysis 2020 - 2024

Historic Market Size - Country Segment 2020 - 2024 ($ million)

6. Qualitative Analysis

6.1 Impact of AI on Global Probiotics Market

6.2 Impact of geopolitical conflicts on Global Probiotics Market

7. Five Forces Analysis

7.1 Five forces summary

Five forces analysis - Comparison between 2025 and 2030

7.2 Bargaining power of buyers

Bargaining power of buyers - Impact of key factors 2025 and 2030

7.3 Bargaining power of suppliers

Bargaining power of suppliers - Impact of key factors in 2025 and 2030

7.4 Threat of new entrants

Threat of new entrants - Impact of key factors in 2025 and 2030

7.5 Threat of substitutes

Threat of substitutes - Impact of key factors in 2025 and 2030

7.6 Threat of rivalry

Threat of rivalry - Impact of key factors in 2025 and 2030

7.7 Market condition

Chart on Market condition - Five forces 2025 and 2030

8. Market Segmentation by End-user

8.1 Market segments

Chart on End-user - Market share 2025-2030 (%)
Data Table on End-user - Market share 2025-2030 (%)

8.2 Comparison by End-user

Chart on Comparison by End-user
Data Table on Comparison by End-user

8.3 Human probiotics - Market size and forecast 2025-2030

Chart on Human probiotics - Market size and forecast 2025-2030 ($ million)
Data Table on Human probiotics - Market size and forecast 2025-2030 ($ million)
Chart on Human probiotics - Year-over-year growth 2025-2030 (%)
Data Table on Human probiotics - Year-over-year growth 2025-2030 (%)

8.4 Animal probiotics - Market size and forecast 2025-2030

Chart on Animal probiotics - Market size and forecast 2025-2030 ($ million)
Data Table on Animal probiotics - Market size and forecast 2025-2030 ($ million)
Chart on Animal probiotics - Year-over-year growth 2025-2030 (%)
Data Table on Animal probiotics - Year-over-year growth 2025-2030 (%)

8.5 Market opportunity by End-user

Market opportunity by End-user ($ million)
Data Table on Market opportunity by End-user ($ million)

9. Market Segmentation by Product

9.1 Market segments

Chart on Product - Market share 2025-2030 (%)
Data Table on Product - Market share 2025-2030 (%)

9.2 Comparison by Product

Chart on Comparison by Product
Data Table on Comparison by Product

9.3 Probiotic functional F and B - Market size and forecast 2025-2030

Chart on Probiotic functional F and B - Market size and forecast 2025-2030 ($ million)
Data Table on Probiotic functional F and B - Market size and forecast 2025-2030 ($ million)
Chart on Probiotic functional F and B - Year-over-year growth 2025-2030 (%)
Data Table on Probiotic functional F and B - Year-over-year growth 2025-2030 (%)

9.4 Dietary supplements - Market size and forecast 2025-2030

Chart on Dietary supplements - Market size and forecast 2025-2030 ($ million)
Data Table on Dietary supplements - Market size and forecast 2025-2030 ($ million)
Chart on Dietary supplements - Year-over-year growth 2025-2030 (%)
Data Table on Dietary supplements - Year-over-year growth 2025-2030 (%)

9.5 Animal feed - Market size and forecast 2025-2030

Chart on Animal feed - Market size and forecast 2025-2030 ($ million)
Data Table on Animal feed - Market size and forecast 2025-2030 ($ million)
Chart on Animal feed - Year-over-year growth 2025-2030 (%)
Data Table on Animal feed - Year-over-year growth 2025-2030 (%)

9.6 Market opportunity by Product

Market opportunity by Product ($ million)
Data Table on Market opportunity by Product ($ million)

10. Market Segmentation by Form Factor

10.1 Market segments

Chart on Form Factor - Market share 2025-2030 (%)
Data Table on Form Factor - Market share 2025-2030 (%)

10.2 Comparison by Form Factor

Chart on Comparison by Form Factor
Data Table on Comparison by Form Factor

10.3 Powder - Market size and forecast 2025-2030

Chart on Powder - Market size and forecast 2025-2030 ($ million)
Data Table on Powder - Market size and forecast 2025-2030 ($ million)
Chart on Powder - Year-over-year growth 2025-2030 (%)
Data Table on Powder - Year-over-year growth 2025-2030 (%)

10.4 Gel or capsule - Market size and forecast 2025-2030

Chart on Gel or capsule - Market size and forecast 2025-2030 ($ million)
Data Table on Gel or capsule - Market size and forecast 2025-2030 ($ million)
Chart on Gel or capsule - Year-over-year growth 2025-2030 (%)
Data Table on Gel or capsule - Year-over-year growth 2025-2030 (%)

10.5 Liquid - Market size and forecast 2025-2030

Chart on Liquid - Market size and forecast 2025-2030 ($ million)
Data Table on Liquid - Market size and forecast 2025-2030 ($ million)
Chart on Liquid - Year-over-year growth 2025-2030 (%)
Data Table on Liquid - Year-over-year growth 2025-2030 (%)

10.6 Stick packs or sachets - Market size and forecast 2025-2030

Chart on Stick packs or sachets - Market size and forecast 2025-2030 ($ million)
Data Table on Stick packs or sachets - Market size and forecast 2025-2030 ($ million)
Chart on Stick packs or sachets - Year-over-year growth 2025-2030 (%)
Data Table on Stick packs or sachets - Year-over-year growth 2025-2030 (%)

10.7 Others - Market size and forecast 2025-2030

Chart on Others - Market size and forecast 2025-2030 ($ million)
Data Table on Others - Market size and forecast 2025-2030 ($ million)
Chart on Others - Year-over-year growth 2025-2030 (%)
Data Table on Others - Year-over-year growth 2025-2030 (%)

10.8 Market opportunity by Form Factor

Market opportunity by Form Factor ($ million)
Data Table on Market opportunity by Form Factor ($ million)

11. Customer Landscape

11.1 Customer landscape overview

Analysis of price sensitivity, lifecycle, customer purchase basket, adoption rates, and purchase criteria

12. Geographic Landscape

12.1 Geographic segmentation

Chart on Market share by geography 2025-2030 (%)
Data Table on Market share by geography 2025-2030 (%)

12.2 Geographic comparison

Chart on Geographic comparison
Data Table on Geographic comparison

12.3 APAC - Market size and forecast 2025-2030

Chart on APAC - Market size and forecast 2025-2030 ($ million)
Data Table on APAC - Market size and forecast 2025-2030 ($ million)
Chart on APAC - Year-over-year growth 2025-2030 (%)
Data Table on APAC - Year-over-year growth 2025-2030 (%)
Chart on Regional Comparison - APAC
Data Table on Regional Comparison - APAC

12.3.1 China - Market size and forecast 2025-2030

Chart on China - Market size and forecast 2025-2030 ($ million)
Data Table on China - Market size and forecast 2025-2030 ($ million)
Chart on China - Year-over-year growth 2025-2030 (%)
Data Table on China - Year-over-year growth 2025-2030 (%)

12.3.2 Japan - Market size and forecast 2025-2030

Chart on Japan - Market size and forecast 2025-2030 ($ million)
Data Table on Japan - Market size and forecast 2025-2030 ($ million)
Chart on Japan - Year-over-year growth 2025-2030 (%)
Data Table on Japan - Year-over-year growth 2025-2030 (%)

12.3.3 India - Market size and forecast 2025-2030

Chart on India - Market size and forecast 2025-2030 ($ million)
Data Table on India - Market size and forecast 2025-2030 ($ million)
Chart on India - Year-over-year growth 2025-2030 (%)
Data Table on India - Year-over-year growth 2025-2030 (%)

12.3.4 South Korea - Market size and forecast 2025-2030

Chart on South Korea - Market size and forecast 2025-2030 ($ million)
Data Table on South Korea - Market size and forecast 2025-2030 ($ million)
Chart on South Korea - Year-over-year growth 2025-2030 (%)
Data Table on South Korea - Year-over-year growth 2025-2030 (%)

12.3.5 Australia - Market size and forecast 2025-2030

Chart on Australia - Market size and forecast 2025-2030 ($ million)
Data Table on Australia - Market size and forecast 2025-2030 ($ million)
Chart on Australia - Year-over-year growth 2025-2030 (%)
Data Table on Australia - Year-over-year growth 2025-2030 (%)

12.3.6 Indonesia - Market size and forecast 2025-2030

Chart on Indonesia - Market size and forecast 2025-2030 ($ million)
Data Table on Indonesia - Market size and forecast 2025-2030 ($ million)
Chart on Indonesia - Year-over-year growth 2025-2030 (%)
Data Table on Indonesia - Year-over-year growth 2025-2030 (%)

12.4 Europe - Market size and forecast 2025-2030

Chart on Europe - Market size and forecast 2025-2030 ($ million)
Data Table on Europe - Market size and forecast 2025-2030 ($ million)
Chart on Europe - Year-over-year growth 2025-2030 (%)
Data Table on Europe - Year-over-year growth 2025-2030 (%)
Chart on Regional Comparison - Europe
Data Table on Regional Comparison - Europe

12.4.1 Germany - Market size and forecast 2025-2030

Chart on Germany - Market size and forecast 2025-2030 ($ million)
Data Table on Germany - Market size and forecast 2025-2030 ($ million)
Chart on Germany - Year-over-year growth 2025-2030 (%)
Data Table on Germany - Year-over-year growth 2025-2030 (%)

12.4.2 UK - Market size and forecast 2025-2030

Chart on UK - Market size and forecast 2025-2030 ($ million)
Data Table on UK - Market size and forecast 2025-2030 ($ million)
Chart on UK - Year-over-year growth 2025-2030 (%)
Data Table on UK - Year-over-year growth 2025-2030 (%)

12.4.3 France - Market size and forecast 2025-2030

Chart on France - Market size and forecast 2025-2030 ($ million)
Data Table on France - Market size and forecast 2025-2030 ($ million)
Chart on France - Year-over-year growth 2025-2030 (%)
Data Table on France - Year-over-year growth 2025-2030 (%)

12.4.4 Italy - Market size and forecast 2025-2030

Chart on Italy - Market size and forecast 2025-2030 ($ million)
Data Table on Italy - Market size and forecast 2025-2030 ($ million)
Chart on Italy - Year-over-year growth 2025-2030 (%)
Data Table on Italy - Year-over-year growth 2025-2030 (%)

12.4.5 Spain - Market size and forecast 2025-2030

Chart on Spain - Market size and forecast 2025-2030 ($ million)
Data Table on Spain - Market size and forecast 2025-2030 ($ million)
Chart on Spain - Year-over-year growth 2025-2030 (%)
Data Table on Spain - Year-over-year growth 2025-2030 (%)

12.4.6 The Netherlands - Market size and forecast 2025-2030

Chart on The Netherlands - Market size and forecast 2025-2030 ($ million)
Data Table on The Netherlands - Market size and forecast 2025-2030 ($ million)
Chart on The Netherlands - Year-over-year growth 2025-2030 (%)
Data Table on The Netherlands - Year-over-year growth 2025-2030 (%)

12.5 North America - Market size and forecast 2025-2030

Chart on North America - Market size and forecast 2025-2030 ($ million)
Data Table on North America - Market size and forecast 2025-2030 ($ million)
Chart on North America - Year-over-year growth 2025-2030 (%)
Data Table on North America - Year-over-year growth 2025-2030 (%)
Chart on Regional Comparison - North America
Data Table on Regional Comparison - North America

12.5.1 US - Market size and forecast 2025-2030

Chart on US - Market size and forecast 2025-2030 ($ million)
Data Table on US - Market size and forecast 2025-2030 ($ million)
Chart on US - Year-over-year growth 2025-2030 (%)
Data Table on US - Year-over-year growth 2025-2030 (%)

12.5.2 Canada - Market size and forecast 2025-2030

Chart on Canada - Market size and forecast 2025-2030 ($ million)
Data Table on Canada - Market size and forecast 2025-2030 ($ million)
Chart on Canada - Year-over-year growth 2025-2030 (%)
Data Table on Canada - Year-over-year growth 2025-2030 (%)

12.5.3 Mexico - Market size and forecast 2025-2030

Chart on Mexico - Market size and forecast 2025-2030 ($ million)
Data Table on Mexico - Market size and forecast 2025-2030 ($ million)
Chart on Mexico - Year-over-year growth 2025-2030 (%)
Data Table on Mexico - Year-over-year growth 2025-2030 (%)

12.6 Middle East and Africa - Market size and forecast 2025-2030

Chart on Middle East and Africa - Market size and forecast 2025-2030 ($ million)
Data Table on Middle East and Africa - Market size and forecast 2025-2030 ($ million)
Chart on Middle East and Africa - Year-over-year growth 2025-2030 (%)
Data Table on Middle East and Africa - Year-over-year growth 2025-2030 (%)
Chart on Regional Comparison - Middle East and Africa
Data Table on Regional Comparison - Middle East and Africa

12.6.1 Saudi Arabia - Market size and forecast 2025-2030

Chart on Saudi Arabia - Market size and forecast 2025-2030 ($ million)
Data Table on Saudi Arabia - Market size and forecast 2025-2030 ($ million)
Chart on Saudi Arabia - Year-over-year growth 2025-2030 (%)
Data Table on Saudi Arabia - Year-over-year growth 2025-2030 (%)

12.6.2 South Africa - Market size and forecast 2025-2030

Chart on South Africa - Market size and forecast 2025-2030 ($ million)
Data Table on South Africa - Market size and forecast 2025-2030 ($ million)
Chart on South Africa - Year-over-year growth 2025-2030 (%)
Data Table on South Africa - Year-over-year growth 2025-2030 (%)

12.6.3 UAE - Market size and forecast 2025-2030

Chart on UAE - Market size and forecast 2025-2030 ($ million)
Data Table on UAE - Market size and forecast 2025-2030 ($ million)
Chart on UAE - Year-over-year growth 2025-2030 (%)
Data Table on UAE - Year-over-year growth 2025-2030 (%)

12.6.4 Turkey - Market size and forecast 2025-2030

Chart on Turkey - Market size and forecast 2025-2030 ($ million)
Data Table on Turkey - Market size and forecast 2025-2030 ($ million)
Chart on Turkey - Year-over-year growth 2025-2030 (%)
Data Table on Turkey - Year-over-year growth 2025-2030 (%)

12.6.5 Israel - Market size and forecast 2025-2030

Chart on Israel - Market size and forecast 2025-2030 ($ million)
Data Table on Israel - Market size and forecast 2025-2030 ($ million)
Chart on Israel - Year-over-year growth 2025-2030 (%)
Data Table on Israel - Year-over-year growth 2025-2030 (%)

12.7 South America - Market size and forecast 2025-2030

Chart on South America - Market size and forecast 2025-2030 ($ million)
Data Table on South America - Market size and forecast 2025-2030 ($ million)
Chart on South America - Year-over-year growth 2025-2030 (%)
Data Table on South America - Year-over-year growth 2025-2030 (%)
Chart on Regional Comparison - South America
Data Table on Regional Comparison - South America

12.7.1 Brazil - Market size and forecast 2025-2030

Chart on Brazil - Market size and forecast 2025-2030 ($ million)
Data Table on Brazil - Market size and forecast 2025-2030 ($ million)
Chart on Brazil - Year-over-year growth 2025-2030 (%)
Data Table on Brazil - Year-over-year growth 2025-2030 (%)

12.7.2 Argentina - Market size and forecast 2025-2030

Chart on Argentina - Market size and forecast 2025-2030 ($ million)
Data Table on Argentina - Market size and forecast 2025-2030 ($ million)
Chart on Argentina - Year-over-year growth 2025-2030 (%)
Data Table on Argentina - Year-over-year growth 2025-2030 (%)

12.7.3 Chile - Market size and forecast 2025-2030

Chart on Chile - Market size and forecast 2025-2030 ($ million)
Data Table on Chile - Market size and forecast 2025-2030 ($ million)
Chart on Chile - Year-over-year growth 2025-2030 (%)
Data Table on Chile - Year-over-year growth 2025-2030 (%)

12.8 Market opportunity by geography

Market opportunity by geography ($ million)
Data Tables on Market opportunity by geography ($ million)

13. Drivers, Challenges, and Opportunity

13.1 Market drivers

Surge in preventive healthcare awareness
Advancements in strain specific formulations
Expansion of functional food applications

13.2 Market challenges

Stringent regulatory frameworks and compliance
Viability and supply chain stability
Consumer skepticism and labeling transparency

13.3 Impact of drivers and challenges

Impact of drivers and challenges in 2025 and 2030

13.4 Market opportunities

Integration of artificial intelligence tools
Rising demand for skin health
Expansion in emerging regional markets

14. Competitive Landscape

14.1 Overview

14.2

Overview on criticality of inputs and factors of differentiation

14.3 Landscape disruption

Overview on factors of disruption

14.4 Industry risks

Impact of key risks on business

15. Competitive Analysis

15.1 Companies profiled

Companies covered

15.2 Company ranking index

15.3 Market positioning of companies

Matrix on companies position and classification

15.4 Archer Daniels Midland Co.

Archer Daniels Midland Co. - Overview
Archer Daniels Midland Co. - Business segments
Archer Daniels Midland Co. - Key news
Archer Daniels Midland Co. - Key offerings
Archer Daniels Midland Co. - Segment focus
SWOT

15.5 BioGaia AB

BioGaia AB - Overview
BioGaia AB - Business segments
BioGaia AB - Key offerings
BioGaia AB - Segment focus
SWOT

15.6 Danone SA

Danone SA - Overview
Danone SA - Business segments
Danone SA - Key news
Danone SA - Key offerings
Danone SA - Segment focus
SWOT

15.7 DSM Firmenich AG

DSM Firmenich AG - Overview
DSM Firmenich AG - Business segments
DSM Firmenich AG - Key offerings
DSM Firmenich AG - Segment focus
SWOT

15.8 Farmhouse Culture Inc.

Farmhouse Culture Inc. - Overview
Farmhouse Culture Inc. - Product / Service
Farmhouse Culture Inc. - Key offerings
SWOT

15.9 General Mills Inc.

General Mills Inc. - Overview
General Mills Inc. - Business segments
General Mills Inc. - Key news
General Mills Inc. - Key offerings
General Mills Inc. - Segment focus
SWOT

15.10 Kerry Group Plc

Kerry Group Plc - Overview
Kerry Group Plc - Business segments
Kerry Group Plc - Key news
Kerry Group Plc - Key offerings
Kerry Group Plc - Segment focus
SWOT

15.11 Sacco System

Sacco System - Overview
Sacco System - Product / Service
Sacco System - Key offerings
SWOT

15.12 Lifeway Foods Inc.

Lifeway Foods Inc. - Overview
Lifeway Foods Inc. - Product / Service
Lifeway Foods Inc. - Key offerings
SWOT

15.13 Meiji Holdings Co. Ltd.

Meiji Holdings Co. Ltd. - Overview
Meiji Holdings Co. Ltd. - Business segments
Meiji Holdings Co. Ltd. - Key offerings
Meiji Holdings Co. Ltd. - Segment focus
SWOT

15.14 Nestle SA

Nestle SA - Overview
Nestle SA - Business segments
Nestle SA - Key news
Nestle SA - Key offerings
Nestle SA - Segment focus
SWOT

15.15 Probi AB

Probi AB - Overview
Probi AB - Product / Service
Probi AB - Key offerings
SWOT

15.16 Willmar Schwabe GmbH and Co. KG

Willmar Schwabe GmbH and Co. KG - Overview
Willmar Schwabe GmbH and Co. KG - Product / Service
Willmar Schwabe GmbH and Co. KG - Key offerings
SWOT

15.17 Winclove BV

Winclove BV - Overview
Winclove BV - Product / Service
Winclove BV - Key offerings
SWOT

15.18 Yakult Honsha Co. Ltd.

Yakult Honsha Co. Ltd. - Overview
Yakult Honsha Co. Ltd. - Business segments
Yakult Honsha Co. Ltd. - Key offerings
Yakult Honsha Co. Ltd. - Segment focus
SWOT

16. Appendix

16.1 Scope of the report

Market definition
Objectives
Notes and caveats

16.2 Inclusions and exclusions checklist

Inclusions checklist
Exclusions checklist

16.3 Currency conversion rates for US$

16.4 Research methodology

16.5 Data procurement

Information sources

16.6 Data validation

16.7 Validation techniques employed for market sizing

16.8 Data synthesis

16.9 360 degree market analysis

16.10 List of abbreviations

Research Methodology

Technavio presents a detailed picture of the market by way of study, synthesis, and summation of data from multiple sources. The analysts have presented the various facets of the market with a particular focus on identifying the key industry influencers. The data thus presented is comprehensive, reliable, and the result of extensive research, both primary and secondary.

INFORMATION SOURCES

Primary sources

  • Manufacturers and suppliers
  • Channel partners
  • Industry experts
  • Strategic decision makers

Secondary sources

  • Industry journals and periodicals
  • Government data
  • Financial reports of key industry players
  • Historical data
  • Press releases

DATA ANALYSIS

Data Synthesis

  • Collation of data
  • Estimation of key figures
  • Analysis of derived insights

Data Validation

  • Triangulation with data models
  • Reference against proprietary databases
  • Corroboration with industry experts

REPORT WRITING

Qualitative

  • Market drivers
  • Market challenges
  • Market trends
  • Five forces analysis

Quantitative

  • Market size and forecast
  • Market segmentation
  • Geographical insights
  • Competitive landscape

Interested in this report?

Get your sample now to see our research methodology and insights!

Download Now

Frequently Asked Questions

Probiotics market growth will increase by USD 41897.2 million during 2026-2030.

The Probiotics market is expected to grow at a CAGR of 8.7% during 2026-2030.

Probiotics market is segmented by End-user (Human probiotics, Animal probiotics) Product (Probiotic functional F and B, Dietary supplements, Animal feed) Form factor (Powder, Gel or capsule, Liquid, Stick packs or sachets, Others)

AB Biotics S.A., Anabio Technologies, Archer Daniels Midland Co., BioGaia AB, Danone SA, DSM Firmenich AG, Farmhouse Culture Inc., General Mills Inc., Gnosis by Lesaffre, Kerry Group Plc, Sacco System, Lifeway Foods Inc., Meiji Holdings Co. Ltd., Nestle SA, Probi AB, Sanzyme Biologics Pvt Ltd, Uncle Matts Organic, Willmar Schwabe GmbH and Co. KG, Winclove BV, Yakult Honsha Co. Ltd. are a few of the key vendors in the Probiotics market.

APAC will register the highest growth rate of 40.9% among the other regions. Therefore, the Probiotics market in APAC is expected to garner significant business opportunities for the vendors during the forecast period.

China, Japan, India, South Korea, Australia, Indonesia, Germany, UK, France, Italy, Spain, The Netherlands, US, Canada, Mexico, Saudi Arabia, South Africa, UAE, Turkey, Israel, Brazil, Argentina, Chile

  • Surge in preventive healthcare awareness is the driving factor this market.

The Probiotics market vendors should focus on grabbing business opportunities from the End-user segment as it accounted for the largest market share in the base year.
RIA - Research AI Assistant
Ask RIA
