Procurement Analytics Market Size 2025-2029
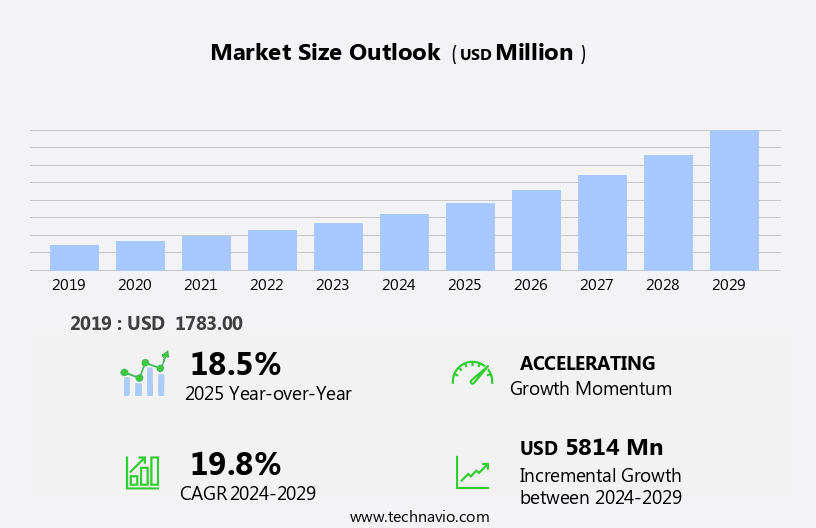
The procurement analytics market size is forecast to increase by USD 5.81 billion at a CAGR of 19.8% between 2024 and 2029.
- The market is experiencing significant growth, driven by the increasing demand for cost reduction and efficiency in business operations. Companies are recognizing the value of leveraging data-driven insights to optimize their procurement processes, leading to substantial savings and improved performance. A key trend fueling market expansion is the integration of Artificial Intelligence (AI) and predictive analytics, enabling more accurate forecasting and automated decision-making. However, market growth is tempered by challenges such as data security and privacy concerns, which require robust data protection measures to ensure the confidentiality and integrity of sensitive information. According to data analytics, consumers are increasingly seeking seamless shopping experiences across multiple channels, leading retailers to invest in omnichannel strategies.
- To capitalize on market opportunities and navigate challenges effectively, companies must prioritize data security, invest in advanced analytics technologies, and stay informed of regulatory developments. However, the market faces challenges related to procurement, particularly due to increasing environmental regulations and digital paper, and the shift towards digital transformation. By doing so, they can harness the power of procurement analytics to streamline operations, reduce costs, and gain a competitive edge.
What will be the Size of the Procurement Analytics Market during the forecast period?
- In the dynamic market, user experience (UX) plays a pivotal role in driving adoption of advanced data mining tools. Sustainable procurement practices are increasingly integrated into analytics solutions, ensuring data cleansing aligns with social responsibility. Agile methodologies and blockchain technology enable continuous improvement through real-time analytics and predictive modeling. Data visualization tools, custom reports, and interactive dashboards facilitate collaborative analytics, allowing stakeholders to make informed decisions. Procurement maturity models, mobile analytics, and procurement governance ensure data quality management and adherence to best practices. Deep learning and automated decision making streamline processes, while data validation and predictive modeling enhance accuracy.
- Role-based access control and change management ensure data security and efficiency. Cloud-based analytics and data enrichment provide scalability and flexibility. Procurement ethics and user interface (UI) design further enhance the value of analytics solutions, ensuring a seamless user experience and ethical decision-making. Overall, the market is evolving to meet the needs of modern businesses, offering innovative solutions for data management and strategic sourcing. Machine learning algorithms optimize supply chain management, enabling retailers to anticipate demand and maintain efficient operations. Digital marketing strategies, including influencer marketing and content marketing, engage customers and drive sales. E-commerce platforms and online retail offer convenience, while virtual reality shopping and augmented reality applications enhance the shopping experience.
How is this Procurement Analytics Industry segmented?
The procurement analytics industry research report provides comprehensive data (region-wise segment analysis), with forecasts and estimates in "USD million" for the period 2025-2029, as well as historical data from 2019-2023 for the following segments.
- Deployment
- On-premises
- Cloud
- Business Segment
- Large enterprises
- SMEs
- Component
- Solutions
- Services
- Geography
- North America
- US
- Canada
- Europe
- France
- Germany
- Italy
- UK
- APAC
- China
- India
- Japan
- South Korea
- Rest of World (ROW)
- North America
By Deployment Insights
The on-premises segment is estimated to witness significant growth during the forecast period. On-premises procurement analytics solutions refer to software systems installed and operated within an organization's data centers or IT infrastructure. These solutions offer businesses complete ownership and control over procurement data, making them suitable for industries with stringent data security, compliance, or customization requirements, such as finance, defense, and government. The primary advantage of on-premises deployment is the ability to deeply customize the system to align with specific organizational processes. Since the solution resides on internal servers, IT teams can tailor features, workflows, and integrations more freely than with most cloud-based options. Data warehousing plays a crucial role in procurement analytics by collecting, storing, and managing large volumes of procurement data.
Big data and machine learning technologies enable advanced data analysis, leading to insights for supply chain optimization, risk management, spend analysis, and strategic sourcing. Cloud computing offers flexibility and cost savings, while business intelligence and procurement intelligence provide actionable insights. Procurement transformation involves the integration of various procurement processes, including inventory management, data integration, data security, and compliance management. Procurement analytics platforms and tools facilitate supplier relationship management, contract management, and procurement process optimization. Cloud computing and supply chain digitization facilitate the collection and analysis of big data, providing businesses with real-time visibility into their supply chain operations. Machine learning and artificial intelligence further optimize processes, predicting disruptions and automating responses. Data visualization, financial reporting, and efficiency improvement are essential for effective procurement analytics. Digital transformation and automation have led to the adoption of procurement analytics software, which offers sourcing optimization, analytics dashboards, category management, and predictive analytics.
Data governance and privacy are crucial considerations for managing procurement data effectively. Demand forecasting and contract lifecycle management help businesses avoid costs and manage contracts efficiently. Artificial intelligence and supplier performance management are emerging trends in procurement analytics, enabling cost reduction and predictive analytics. Procurement process optimization and cost reduction are critical objectives for businesses seeking to improve their bottom line.
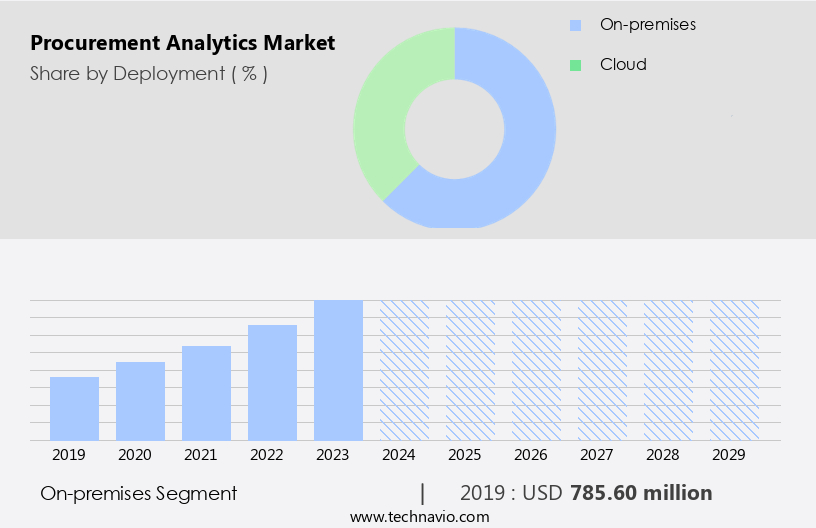
The On-premises segment was valued at USD 785.60 billion in 2019 and showed a gradual increase during the forecast period.
Regional Analysis
North America is estimated to contribute 35% to the growth of the global market during the forecast period. Technavio's analysts have elaborately explained the regional trends and drivers that shape the market during the forecast period.
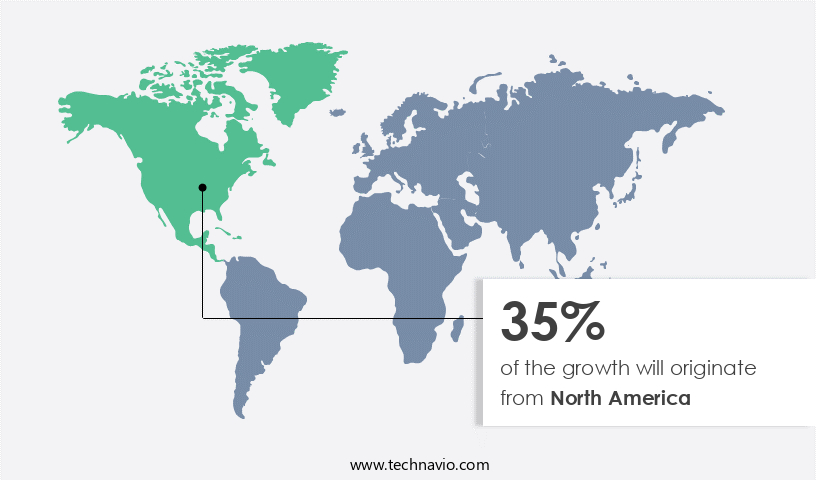
The market in North America is experiencing significant growth, driven by the region's advanced digital infrastructure and high investment in enterprise technologies. The United States leads the market, with widespread adoption of artificial intelligence (AI), cloud computing, and data analytics in procurement and supply chain functions. Over 80% of North American enterprises had either implemented or were in the process of adopting advanced procurement and supply chain analytics by 2023. This trend is particularly noticeable in sectors like manufacturing, healthcare, retail, and technology, where data-driven procurement is crucial for cost savings, risk mitigation, and sustainability compliance.
Procurement analytics platforms enable data integration, data security, and data visualization, while machine learning and predictive analytics improve efficiency and drive strategic sourcing and category management. Supplier relationship management, risk management, and compliance management are also key areas of focus, ensuring supply chain optimization and cost reduction. Data governance and data privacy are essential considerations, with cloud security a major concern for businesses utilizing cloud-based procurement analytics software. Overall, the North American market is characterized by a strong emphasis on digital transformation, strategic procurement, and supply chain visibility.
Market Dynamics
Our researchers analyzed the data with 2024 as the base year, along with the key drivers, trends, and challenges. A holistic analysis of drivers will help companies refine their marketing strategies to gain a competitive advantage.
What are the Procurement Analytics market drivers leading to the rise in the adoption of Industry?
- The market is driven forward by the increasing demand for cost reduction and efficiency. In today's competitive business landscape, the need for cost reduction and operational efficiency is paramount. Procurement, a significant portion of an organization's expenditure, presents numerous opportunities for optimization. Procurement analytics plays a crucial role in this regard, providing businesses with valuable insights into their spending patterns. By consolidating suppliers, negotiating better contracts, and reducing maverick spend, procurement teams can uncover substantial savings. Advanced analytics tools enable procurement teams to move beyond reactive, transactional processes and adopt proactive, strategic decision-making. These tools facilitate data warehousing, spend analysis, inventory management, and risk management, among other functions. Moreover, cloud computing and business intelligence solutions offer flexibility and accessibility, allowing organizations to make data-driven decisions in real-time.
- Supplier diversity and supply chain optimization are other critical areas where procurement analytics adds value. By analyzing supplier performance and identifying potential risks, businesses can improve their supplier relationships and mitigate supply chain disruptions. The adoption of procurement analytics is essential for businesses seeking to gain a competitive edge and streamline their operations.
What are the Procurement Analytics market trends shaping the Industry?
- The integration of artificial intelligence (AI) and predictive analytics is an emerging market trend. This fusion of technologies enables more accurate and efficient data analysis, leading to informed decision-making and improved business outcomes. Procurement analytics is undergoing a significant transformation due to the integration of artificial intelligence (AI) and predictive analytics. These technologies enable organizations to shift from reactive decision-making to proactive, strategic procurement management. Advanced capabilities such as demand forecasting, risk prediction, supplier performance monitoring, and real-time anomaly detection are now within reach. By analyzing vast amounts of structured and unstructured data, AI can uncover patterns and trends that are not apparent through conventional methods. This allows businesses to anticipate disruptions, optimize sourcing strategies, and reduce costs more effectively. AI-powered procurement analytics platforms offer features like data security, supplier relationship management, strategic sourcing, supply chain visibility, RFX management, compliance management, and machine learning.
- These tools help streamline processes, improve efficiency, and enhance the overall procurement experience. As businesses continue to prioritize strategic procurement, the demand for advanced procurement analytics solutions is expected to grow. The integration of AI and predictive analytics is revolutionizing the procurement landscape, providing organizations with valuable insights to make informed decisions and drive business success.
How does Procurement Analytics market faces challenges face during its growth?
- Data security and privacy concerns represent significant challenges that can hinder industry growth. Companies must prioritize these issues to protect sensitive information, maintain consumer trust, and adhere to regulatory compliance. The market is experiencing significant growth as organizations seek to enhance financial reporting, improve efficiency, and optimize sourcing through digital transformation. Procurement analytics software enables data visualization, category management, and procurement automation, offering valuable insights for informed decision-making. However, this reliance on advanced analytics comes with challenges, particularly in the realm of data security and privacy. With the increasing volume of sensitive data being processed and stored, including personally identifiable information (PII), financial records, and proprietary business information, the risk of cyberattacks is heightened.
- According to recent research, the average cost of a data breach reached an all-time high of USD4.88 million in 2024, marking a 10% increase from the previous year. Nearly half (46%) of these breaches involved customer PII, emphasizing the importance of robust data governance and security measures. Organizations must prioritize these concerns to protect their valuable data and maintain trust with their stakeholders.
Exclusive Customer Landscape
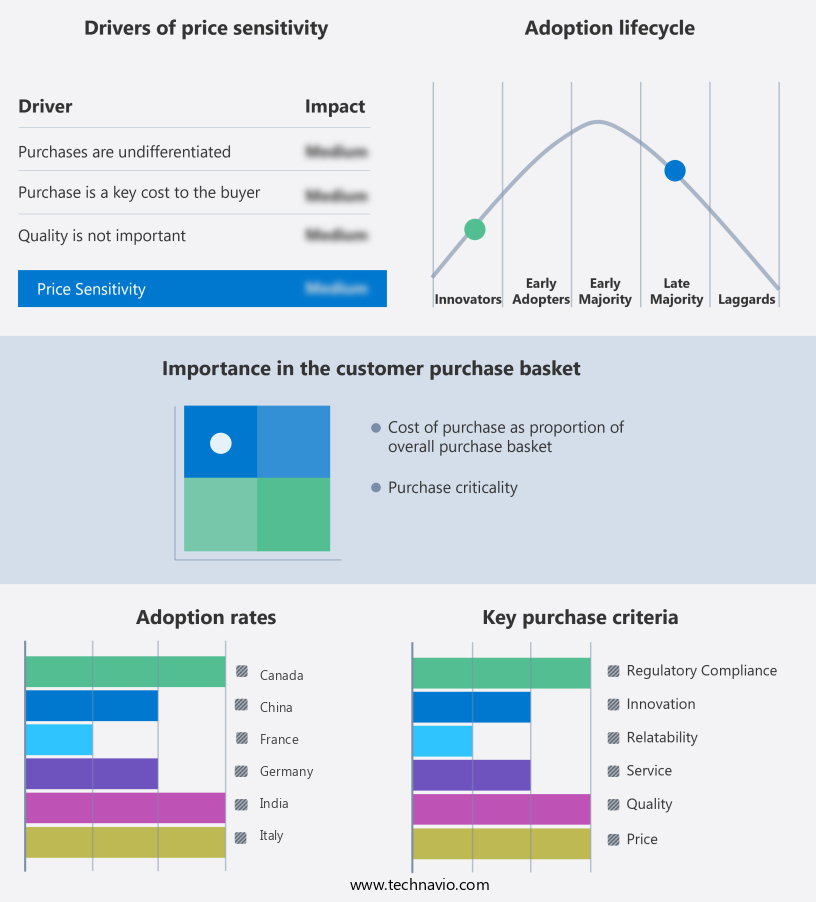
The procurement analytics market forecasting report includes the adoption lifecycle of the market, covering from the innovator's stage to the laggard's stage. It focuses on adoption rates in different regions based on penetration. Furthermore, the procurement analytics market report also includes key purchase criteria and drivers of price sensitivity to help companies evaluate and develop their market growth analysis strategies.
Customer Landscape
Key Companies & Market Insights
Companies are implementing various strategies, such as strategic alliances, procurement analytics market forecast, partnerships, mergers and acquisitions, geographical expansion, and product/service launches, to enhance their presence in the industry.
Accenture PLC - The company offers procurement analytics services such as supplier performance tracking, category strategy optimization, and others.
The industry research and growth report includes detailed analyses of the competitive landscape of the market and information about key companies, including:
- Accenture PLC
- BirchStreet Systems Inc.
- Coupa Software Inc.
- Empronc Solutions Pvt. Ltd
- Genpact Ltd.
- GEP
- International Business Machines Corp.
- Ivalua Inc.
- JAGGAER LLC
- Microsoft Corp.
- Oracle Corp.
- Proactis Holdings plc
- Robobai Pty Ltd.
- Rosslyn Data Technologies Plc
- SAP SE
- SAS Institute Inc.
- Sievo
- Simfoni Ltd.
- Xeeva Inc.
- Zycus Inc.
Qualitative and quantitative analysis of companies has been conducted to help clients understand the wider business environment as well as the strengths and weaknesses of key industry players. Data is qualitatively analyzed to categorize companies as pure play, category-focused, industry-focused, and diversified; it is quantitatively analyzed to categorize companies as dominant, leading, strong, tentative, and weak.
Recent Development and News in Procurement Analytics Market
- In February 2024, IBM announced the integration of AI and machine learning capabilities into its Procurement Insights solution, enabling clients to analyze large procurement data sets and identify savings opportunities more effectively (IBM Press Release, 2024). In May 2025, SAP Ariba, a leading procurement solutions provider, partnered with Google Cloud to offer a joint solution, combining SAP Ariba's procurement services with Google Cloud's data analytics capabilities, aiming to provide more efficient and data-driven procurement processes (SAP Ariba Press Release, 2025).
- In October 2024, Icertis, a prominent procurement software company, raised USD110 million in a Series E funding round, bringing its total funding to over USD300 million, fueling its growth in the market (Crunchbase News, 2024). In December 2025, Coupa Software expanded its presence in the Asia Pacific region by opening a new office in Singapore, aiming to cater to the growing demand for procurement analytics solutions in the region (Coupa Software Press Release, 2025). These developments underscore the increasing importance of data-driven insights and advanced technologies in the market.
Research Analyst Overview
The market continues to evolve, driven by the increasing adoption of data warehousing and big data solutions. Supplier diversity and supply chain optimization are key areas of focus, with businesses seeking to enhance risk management through advanced data analysis. Procurement intelligence and business intelligence are merging, providing organizations with procurement transformation and inventory management capabilities. Cloud computing plays a significant role in procurement analytics, enabling data integration and ensuring data security. Procurement analytics platforms facilitate supplier relationship management, strategic sourcing, and supply chain visibility. Rfx management and procurement analytics tools, powered by machine learning and artificial intelligence, streamline processes and improve efficiency.
Strategic procurement and compliance management are critical components of this dynamic landscape. Data visualization and financial reporting offer valuable insights, while cost avoidance and contract management solutions optimize procurement processes. Predictive analytics and demand forecasting enable better inventory management and cost reduction strategies. Data governance and data privacy are essential considerations, ensuring secure handling of sensitive information. Procurement automation and digital transformation continue to shape the market, as businesses seek to stay competitive and adapt to evolving market conditions.
Dive into Technavio's strong research methodology, blending expert interviews, extensive data synthesis, and validated models for unparalleled Procurement Analytics Market insights. See full methodology.
|
Market Scope |
|
|
Report Coverage |
Details |
|
Page number |
217 |
|
Base year |
2024 |
|
Historic period |
2019-2023 |
|
Forecast period |
2025-2029 |
|
Growth momentum & CAGR |
Accelerate at a CAGR of 19.8% |
|
Market growth 2025-2029 |
USD 5.81 billion |
|
Market structure |
Fragmented |
|
YoY growth 2024-2025(%) |
18.5 |
|
Key countries |
US, Canada, UK, China, Germany, Japan, India, France, South Korea, and Italy |
|
Competitive landscape |
Leading Companies, Market Positioning of Companies, Competitive Strategies, and Industry Risks |
What are the Key Data Covered in this Procurement Analytics Market Research and Growth Report?
- CAGR of the Procurement Analytics industry during the forecast period
- Detailed information on factors that will drive the growth and forecasting between 2025 and 2029
- Precise estimation of the size of the market and its contribution of the industry in focus to the parent market
- Accurate predictions about upcoming growth and trends and changes in consumer behaviour
- Growth of the market across North America, Europe, APAC, Middle East and Africa, and South America
- Thorough analysis of the market's competitive landscape and detailed information about companies
- Comprehensive analysis of factors that will challenge the procurement analytics market growth and forecasting
We can help! Our analysts can customize this procurement analytics market research report to meet your requirements.
 RIA -
RIA - 
