
Digital Newspaper Publishing Market Size 2025-2029
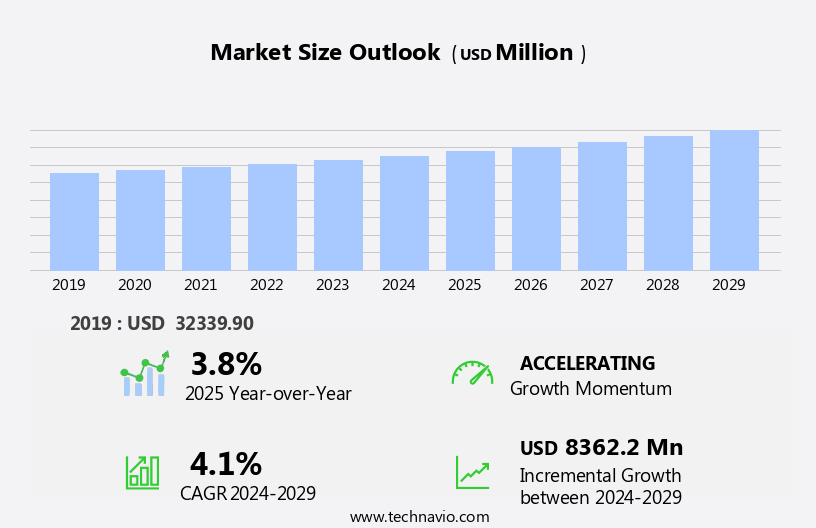
The digital newspaper publishing market size is forecast to increase by USD 8.36 billion, at a CAGR of 4.1% between 2024 and 2029.
- The market is experiencing significant growth, driven by the increasing adoption of e-newspapers among individuals. This shift is particularly noticeable among the millennial demographic, who value the convenience and instant access to news that digital content platforms offer. However, the market faces challenges as well. Strict regulations on digital newspaper platforms pose obstacles for publishers, requiring adherence to stringent guidelines to ensure credibility and trustworthiness. Navigating these regulations while maintaining a competitive edge will be crucial for market success. Companies seeking to capitalize on this dynamic market must focus on delivering high-quality, reliable digital news content while adhering to regulatory requirements. Adapting to the evolving digital landscape and staying abreast of consumer preferences will be essential for long-term success in the market.
What will be the Size of the Digital Newspaper Publishing Market during the forecast period?
Explore in-depth regional segment analysis with market size data - historical 2019-2023 and forecasts 2025-2029 - in the full report.
Request Free Sample
The market continues to evolve, driven by advancements in technology and shifting consumer preferences. Online news platforms are increasingly becoming the go-to source for news and information, with mobile news apps and social media integration playing significant roles. Content creation is a key focus, with programmatic advertising enabling targeted campaigns based on user data. Bounce rates and online advertising revenue are critical metrics for publishers, with cost optimization a constant concern. Digital newspapers are adapting to these dynamics, incorporating user engagement metrics such as time on site and click-through rates (CTR) to optimize advertising efficiency.
Content personalization algorithms are transforming the editorial process, enabling interactive and multimedia content that caters to audience segments. Newsroom workflows are being streamlined through cloud computing and data analytics, with artificial intelligence (AI) and machine learning (ML) automating content generation and curation. Data security and privacy policies are becoming increasingly important, with legal frameworks evolving to address intellectual property rights and data analytics. Broadcast media and print media are also adapting to the digital landscape, integrating podcasts and news aggregators into their subscription models and content syndication strategies. The ongoing unfolding of market activities and evolving patterns in the market underscore the importance of continuous adaptation and innovation. From user experience (UX) to advertising revenue, digital publishing platforms must remain agile to meet the evolving needs of consumers and advertisers alike.
How is this Digital Newspaper Publishing Industry segmented?
The digital newspaper publishing industry research report provides comprehensive data (region-wise segment analysis), with forecasts and estimates in "USD million" for the period 2025-2029, as well as historical data from 2019-2023 for the following segments.
- Type
- General news
- Specific news
- Application
- Smartphones
- Laptops
- PCs
- Others
- Product Type
- Digital books
- Digital journals
- Others
- End-user
- Individual consumers
- Educational institutions
- Corporate
- Geography
- North America
- US
- Canada
- Europe
- France
- Germany
- UK
- APAC
- China
- India
- Japan
- South Korea
- South America
- Brazil
- Rest of World (ROW)
- North America
By Type Insights
The general news segment is estimated to witness significant growth during the forecast period.
In the dynamic world of digital news, general news plays a significant role in keeping audiences informed about various global events and trends. This type of news, which covers a broad spectrum of topics, is designed to cater to diverse audience interests. Digital newspaper publishing platforms are a key medium for disseminating daily general news updates. Copyright management is essential in this context to protect intellectual property rights and maintain editorial integrity. Audio journalism, a growing trend, offers an immersive experience for audiences, complementing text-based content. Conversion rates and web design are crucial factors in attracting and retaining readers, with user-friendly interfaces and engaging multimedia content being key.
E-newspaper subscriptions, fueled by cloud computing, enable seamless access to news from anywhere. Audience segmentation and user engagement metrics help publishers tailor content to specific demographics and interests. Email newsletters and targeted advertising offer personalized content and revenue opportunities. Multimedia content, including video journalism, enhances user experience and fosters greater audience engagement. The editorial process and interactive content keep readers engaged, while newsroom workflow and podcast integration streamline content creation and distribution. Legal frameworks and data security are vital components of the digital publishing landscape, ensuring privacy and data protection. Time on site and click-through rates (CTR) are essential user behavior metrics, while audience analytics and artificial intelligence (AI) facilitate content personalization and advertising efficiency.
Data analytics and privacy policies are essential for understanding user behavior and preferences, while legacy system integration is crucial for maintaining continuity. News curation, push notifications, and machine learning (ML) enable real-time, personalized content delivery. Native advertising, big data, news aggregators, and subscription models offer new revenue streams. Print media and digital publishing platforms coexist, with bounce rates and online news platforms shaping the future of news consumption. Content creation, programmatic advertising, mobile news apps, and social media integration are essential components of the evolving digital news landscape. Advertising revenue, readership analysis, and cost optimization are key performance indicators for publishers.
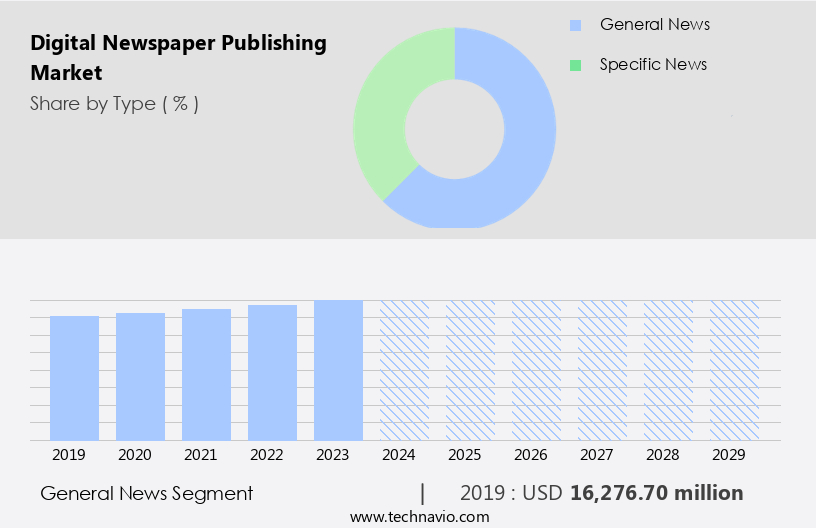
The General news segment was valued at USD 16.28 billion in 2019 and showed a gradual increase during the forecast period.
Regional Analysis
APAC is estimated to contribute 39% to the growth of the global market during the forecast period.Technavio's analysts have elaborately explained the regional trends and drivers that shape the market during the forecast period.
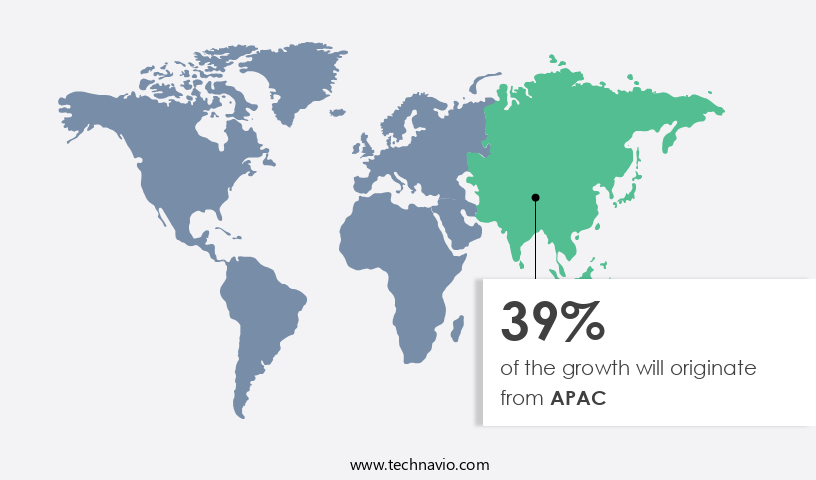
In The market, APAC is a significant and growing region. With a vast population and expanding Internet and mobile device usage, there's a notable transition to digital media consumption. In APAC, China holds the largest share of the market in 2024. The country's digital engagement is surging, boasting approximately 1 billion internet users by June 2024. This digital engagement evolution underscores China's prominent position in the region's media landscape. The Chinese market benefits from the government's commitment to a digital economy, leading to increased investments in digital infrastructure and innovation. Digital newspaper publishing in APAC is further propelled by cloud computing, enabling scalability and cost optimization.
Audience segmentation and user engagement metrics are crucial, driving personalized content and targeted advertising. Multimedia content, including video journalism and podcast integration, captivates readers. The editorial process and newsroom workflow are streamlined through interactive content and automated content generation. Intellectual property rights are protected through legal frameworks. Digital newspapers leverage data analytics and artificial intelligence to enhance user experience, news curation, and push notifications. Machine learning algorithms and native advertising cater to reader preferences. Big data and news aggregators facilitate content syndication and subscription models. Print media and digital publishing platforms coexist, with bounce rates and online advertising shaping revenue management.
Market Dynamics
Our researchers analyzed the data with 2024 as the base year, along with the key drivers, trends, and challenges. A holistic analysis of drivers will help companies refine their marketing strategies to gain a competitive advantage.
The global digital newspaper publishing market size and forecast projects growth, driven by digital newspaper market trends 2025-2029. B2B digital publishing solutions leverage AI-driven publishing platforms for engagement. Digital newspaper market growth opportunities 2025 include digital newspapers for mobile users and subscription-based news platforms, meeting reader demand. Publishing management software optimizes operations, while digital newspaper market competitive analysis highlights key publishers. Sustainable digital publishing and learning analytics practices align with eco-friendly publishing trends. Digital newspaper regulations 2025-2029 shapes news platform demand in North America 2025. Ad-supported digital news and premium digital newspaper insights boost revenue. Digital newspapers for niche markets and customized news formats target niches. Digital newspaper market challenges and solutions address monetization, with direct procurement strategies for publishing tools and digital news pricing optimization enhancing profitability. Data-driven digital newspaper analytics and AR-enhanced news trends drive innovation.
What are the key market drivers leading to the rise in the adoption of Digital Newspaper Publishing Industry?
- The significant rise in the number of individuals adopting e-newspapers serves as the primary growth driver for the market.
- E-newspapers have witnessed notable growth in recent years as consumers seek sustainable alternatives to traditional print media. Unlike print newspapers, which require the harvesting of trees and generate substantial waste, e-newspapers are digital, eco-friendly solutions. They offer several advantages, including privacy policies that protect user data, seamless legacy system integration, enhanced advertising efficiency, and a superior user experience (UX). News curation, push notifications, and machine learning (ML) algorithms facilitate personalized content delivery. Advertisers benefit from native advertising and big data analytics, while news aggregators and subscription models cater to diverse reader preferences.
- Content syndication enables the sharing of news articles across multiple platforms, further expanding reach. The digital publishing landscape continues to evolve, offering innovative solutions that prioritize privacy, efficiency, and user experience.
What are the market trends shaping the Digital Newspaper Publishing Industry?
- The increasing preference among millennials for convenient access to real-time news represents a significant market trend. This demographic prioritizes instant information delivery over traditional news sources.
- The market has experienced significant growth due to the increasing preference for instant news among the millennial demographic. With the widespread use of smartphones and social media, consumers now have constant access to real-time news updates. According to recent studies, approximately 90% of millennials access news via mobile devices, a stark contrast to the 25% of individuals aged 65 and above. Online news platforms have become the go-to source for news consumption, with bounce rates decreasing as users engage more deeply with content. Content creation remains a key focus for digital newspapers, with programmatic advertising enabling targeted and personalized advertising revenue.
- Mobile news apps and social media integration have further enhanced user experience, allowing for seamless sharing and engagement. Readership analysis and cost optimization are essential for publishers to optimize their strategies and remain competitive in the online advertising landscape. Content personalization algorithms enable publishers to deliver relevant and engaging content to individual users, increasing reader engagement and loyalty.
What challenges does the Digital Newspaper Publishing Industry face during its growth?
- The strict regulations governing digital newspaper platforms pose a significant challenge to the industry's growth. In order to comply with these stringent rules, newspapers face numerous obstacles, including increased operational costs and complex compliance processes, which can hinder their ability to expand and thrive in the digital age.
- Digital newspaper publishing is undergoing significant changes due to regulatory requirements aimed at combating misinformation and safeguarding user privacy. Regulations, such as the European Union's General Data Protection Regulation (GDPR), mandate that news platforms obtain explicit consent from users before collecting and processing their personal data. Users also have the right to access, correct, and delete their information. In the US, the Journalism Competition and Preservation Act (JCPA) proposes allowing news organizations to negotiate collectively with digital platforms for fair compensation. These regulations impact various aspects of digital newspaper publishing, including copyright management, web design, and audience engagement.
- To remain competitive, digital newspapers are focusing on user experience and engagement. They are investing in interactive content, multimedia journalism, and targeted advertising. Cloud computing is enabling the conversion of print newspapers into e-newspaper subscriptions, offering users the convenience of accessing news anytime, anywhere. Audience segmentation and user engagement metrics are crucial for understanding reader preferences and tailoring content accordingly. Email newsletters and social media platforms are popular channels for reaching and engaging readers. Multimedia content, including audio and video journalism, is becoming increasingly important. The editorial process is evolving to accommodate these formats, with a focus on immersive and harmonious storytelling.
- User-generated content and interactive features are also gaining popularity. Overall, digital newspaper publishing is adapting to regulatory requirements and changing user preferences to deliver high-quality, engaging, and accurate news content.
Exclusive Customer Landscape
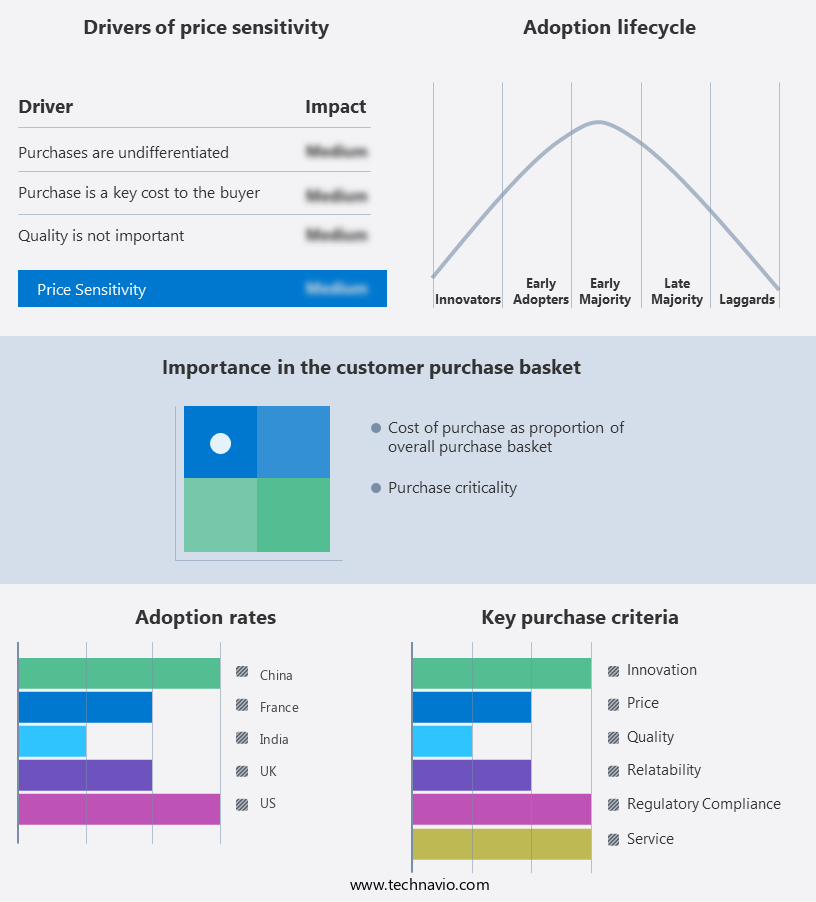
The digital newspaper publishing market forecasting report includes the adoption lifecycle of the market, covering from the innovator's stage to the laggard's stage. It focuses on adoption rates in different regions based on penetration. Furthermore, the digital newspaper publishing market report also includes key purchase criteria and drivers of price sensitivity to help companies evaluate and develop their market growth analysis strategies.
Customer Landscape
Key Companies & Market Insights
Companies are implementing various strategies, such as strategic alliances, digital newspaper publishing market forecast, partnerships, mergers and acquisitions, geographical expansion, and product/service launches, to enhance their presence in the industry.
Axel Springer SE - This company specializes in digital newspaper publishing, providing innovative solutions through offerings like Upday and Business Insider. Their platforms facilitate seamless access to news content, enhancing user experience and engagement.
The industry research and growth report includes detailed analyses of the competitive landscape of the market and information about key companies, including:
- Axel Springer SE
- Business Standard Pvt. Ltd.
- Daily Mail and General Trust plc
- EXOR N.V.
- Gannett Co. Inc.
- Guardian Media Group plc
- Hearst Communications Inc.
- IE Online Media Services Pvt. Ltd.
- McClatchy
- National World plc
- News Corp.
- NHI Nash Holdings Inc.
- Nikkei Inc.
- Readly International AB
- RTL Group SA
- Schibsted ASA
- The Economist Newspaper Ltd.
- The New York Times Co.
- Times Media Group
- Tribune Publishing Co.
Qualitative and quantitative analysis of companies has been conducted to help clients understand the wider business environment as well as the strengths and weaknesses of key industry players. Data is qualitatively analyzed to categorize companies as pure play, category-focused, industry-focused, and diversified; it is quantitatively analyzed to categorize companies as dominant, leading, strong, tentative, and weak.
Recent Development and News in Digital Newspaper Publishing Market
- In January 2024, NewsCorp, a global media company, announced the launch of its new digital newspaper platform, "Newspaper360," which integrates artificial intelligence and virtual reality technologies to enhance user experience (NewsCorp Press Release, 2024).
- In March 2024, Google and Microsoft entered into a strategic partnership to collaborate on Google News Showcase, a subscription service that allows publishers to sell their content directly to readers through Microsoft's Edge browser (Microsoft News Blog, 2024).
- In April 2025, The New York Times Company raised USD200 million in a funding round led by BlackRock and Fidelity Investments to accelerate its digital transformation and expand its international presence (The New York Times Company Press Release, 2025).
- In May 2025, Apple News+, Apple's subscription news service, secured approval from the European Commission to expand its operations in the European Union, marking a significant geographic expansion for the platform (European Commission Press Release, 2025).
Research Analyst Overview
- In the dynamic the market, reputation management and social media monitoring play crucial roles in shaping public perception. News archives and metadata management enable effective content repurposing, while an editorial calendar and content strategy ensure consistent digital storytelling. Fraud prevention and A/B testing optimize revenue streams, and responsive web design and mobile-first approach cater to evolving reader preferences. Brand building through data journalism and accessibility standards enhances reader engagement, and digital preservation safeguards valuable content. Interactive advertising formats, SEO strategies, and subscription management boost revenue forecasting.
- Database management, payment gateways, and email marketing streamline operations, and usability testing maintains reader satisfaction. Crisis communication and public relations mitigate potential damage, and social media marketing and data visualization expand reach. Mobile advertising networks offer new monetization opportunities, and SEO strategies and crisis communication are essential components of effective crisis management.
Dive into Technavio's robust research methodology, blending expert interviews, extensive data synthesis, and validated models for unparalleled Digital Newspaper Publishing Market insights. See full methodology.
|
Market Scope |
|
|
Report Coverage |
Details |
|
Page number |
234 |
|
Base year |
2024 |
|
Historic period |
2019-2023 |
|
Forecast period |
2025-2029 |
|
Growth momentum & CAGR |
Accelerate at a CAGR of 4.1% |
|
Market growth 2025-2029 |
USD 8362.2 million |
|
Market structure |
Fragmented |
|
YoY growth 2024-2025(%) |
3.8 |
|
Key countries |
US, China, Japan, India, Germany, Canada, South Korea, France, UK, and Brazil |
|
Competitive landscape |
Leading Companies, Market Positioning of Companies, Competitive Strategies, and Industry Risks |
What are the Key Data Covered in this Digital Newspaper Publishing Market Research and Growth Report?
- CAGR of the Digital Newspaper Publishing industry during the forecast period
- Detailed information on factors that will drive the growth and forecasting between 2025 and 2029
- Precise estimation of the size of the market and its contribution of the industry in focus to the parent market
- Accurate predictions about upcoming growth and trends and changes in consumer behaviour
- Growth of the market across APAC, North America, Europe, Middle East and Africa, and South America
- Thorough analysis of the market's competitive landscape and detailed information about companies
- Comprehensive analysis of factors that will challenge the digital newspaper publishing market growth of industry companies
We can help! Our analysts can customize this digital newspaper publishing market research report to meet your requirements.
 RIA -
RIA - 
