Produced Water Treatment Market Analysis North America, Europe, Middle East and Africa, South America, APAC - US, Russia, Saudi Arabia, United Arab Emirates, Brazil - Size and Forecast 2024-2028

Produced Water Treatment Market Analysis North America, Europe, Middle East and Africa, South America, APAC - US, Russia, Saudi Arabia, United Arab Emirates, Brazil - Size and Forecast 2024-2028

Published: May 2024 168 Pages SKU: IRTNTR44980

Market Overview at a Glance

$2.98 B
Market Opportunity
7.06%
CAGR
6.47
YoY growth 2023-2024(%)

Produced Water Treatment Market Size 2024-2028 

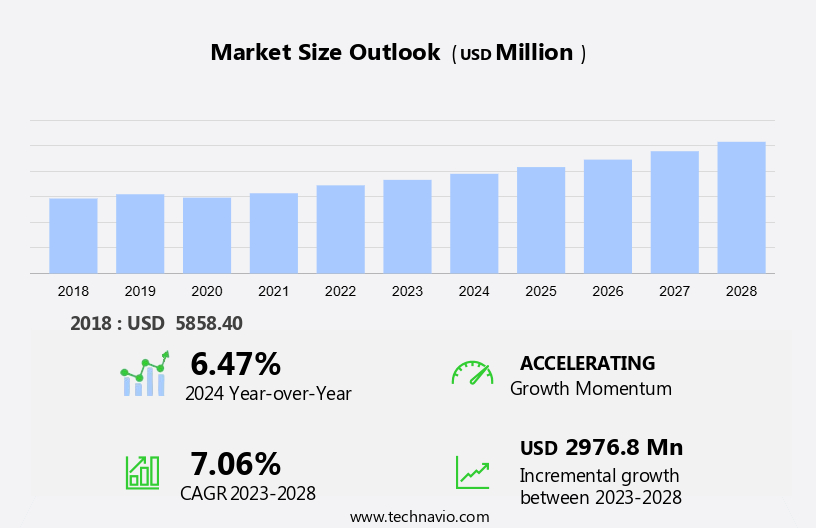
The produced water treatment market size is forecast to increase by USD 2.98 billion at a CAGR of 7.06% between 2023 and 2028. The market is experiencing significant growth due to several key drivers. The increasing global concerns regarding water scarcity and the need for freshwater usage in various industries are major factors fueling market growth. Additionally, the rise in unconventional gas resources, such as shale formations, has led to an increase in produced water generation. This water must be treated before it can be safely disposed of or reused, creating a demand for advanced water treatment technologies. Furthermore, the increasing use of renewable energy sources, particularly in oil and gas operations, is driving the adoption of membrane filtration and electrocoagulation techniques for produced water treatment. Population growth and urbanization are also putting pressure on freshwater resources, making the treatment and reuse of produced water an essential solution for meeting future water demands. Overall, the market is expected to continue growing as companies seek sustainable and cost-effective solutions for managing produced water.

Produced Water Treatment Market Size

 Request Free Sample

The produced water market is witnessing significant growth due to the increasing oil & gas exploration activities. Urbanization and population growth in various regions have led to an increase in the demand for fossil fuels, resulting in a wave in crude oil and natural gas production. This, in turn, leads to the generation of large volumes of produced water. Produced water contains impurities such as oil droplets, sediments, mud particles, heavy metal particles, salts, hydrocarbons, and organic compounds. Regulatory requirements, water scarcity, environmental concerns, freshwater usage, and energy consumption are some of the key factors driving the demand for produced water treatment.

Moreover, membrane filtration and electrocoagulation are the most commonly used treatment technologies for producing water. These technologies help in removing impurities and making the water suitable for reuse or disposal. The oil and gas industry generates produced water from oil and gas reservoirs, and it also enters the water stream through river streams during transportation and industrial activities. Therefore, the market is expected to grow significantly in the coming years.

Market Segmentation

The market research report provides comprehensive data (region-wise segment analysis), with forecasts and estimates in "USD billion" for the period 2024-2028, as well as historical data from 2018-2022 for the following segments.

  • Application
    • Onshore
    • Offshore
  • Technology
    • Secondary treatment
    • Primary treatment
    • Tertiary treatment
  • Geography
    • North America
      • US
    • Europe
    • Middle East and Africa
    • South America
      • Brazil
    • APAC

By Application Insights

The onshore segment is estimated to witness significant growth during the forecast period. The market in the onshore segment is projected to expand at a steady pace over the upcoming years. Onshore oil and gas production has been the primary contributor to global production, making the onshore segment a significant market for produced water treatment. The wave in shale gas production in the US, particularly in recent years, has significantly boosted the demand for produced water treatment. During shale gas extraction, vast quantities of water are utilized for hydraulic fracturing, resulting in the production of large volumes of water containing oil droplets, sediments, mud particles, heavy metal particles, salts, hydrocarbons, and organic compounds.

Moreover, the produced water, which emerges at the surface, requires treatment to meet regulatory standards and to minimize environmental impact. This high volume of produced water in the US, driven by its shale gas boom, has resulted in a high water-oil ratio (WOR), making the market a vital sector in the country.

Produced Water Treatment Market Size

Get a glance at the market share of various segments Request Free Sample

The onshore segment was valued at USD 4.05 billion in 2018 and showed a gradual increase during the forecast period.

Regional Insights

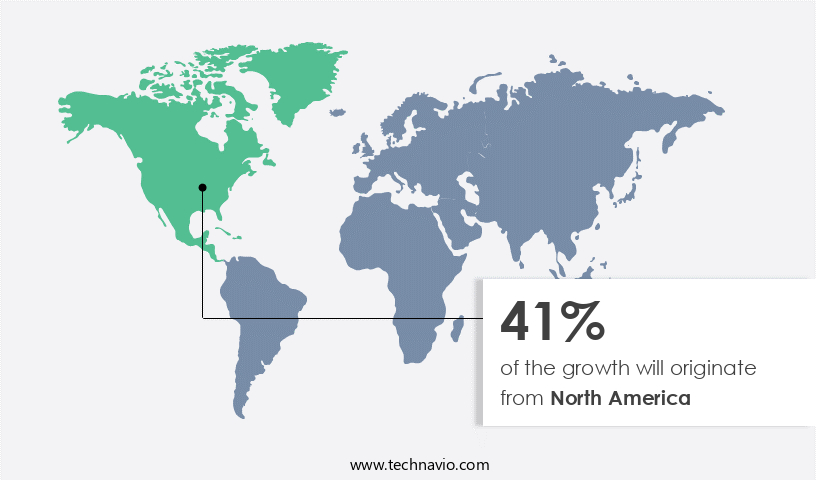
North America is estimated to contribute 41% to the growth of the global market during the forecast period. Technavio's analysts have elaborately explained the regional trends and drivers that shape the market during the forecast period.

Produced Water Treatment Market Share by Geography

For more insights on the market share of various regions Request Free Sample

The United States and Canada are significant contributors to oil and gas production in North America, with the US being the world's largest crude oil producer. With the maturity of many oilfields in the US and the expansion of the shale gas industry, there is an increase in the generation of produced water. This water contains oil droplets, sediments, mud particles, heavy metal particles, salts, hydrocarbons, and organic compounds. To address the challenges posed by this wastewater, companies in the region are advancing their oil and gas exploration technologies, leading to improved produced water treatment solutions. These innovations will help manage the produced water more effectively and mitigate potential environmental concerns.

Our researchers analyzed the data with 2023 as the base year, along with the key drivers, trends, and challenges. A holistic analysis of drivers will help companies refine their marketing strategies to gain a competitive advantage.

Market Driver

Increasing global concerns regarding water scarcity are the key drivers of the market. The depletion of global water resources is a pressing issue, with over 2 billion people currently lacking access to safe drinking water according to the UN's 2022 World Water Development Report. With population growth projected to increase by nearly one-third by 2050, the demand for water is anticipated to rise significantly. The UN defines water stress as occurring when a country's water availability falls below 1,700 m3/year or 4,600 liters/day per person. Absolute water scarcity is considered for countries with less than 500 m3/year or approximately 1,400 liters/day per person. The oil & gas exploration industry, urbanization, population growth, transportation, and industrial activities are major contributors to the increasing demand for water. The produced water generated from the extraction of crude oil and natural gas exacerbates this issue. Effective produced water treatment is crucial to mitigate the strain on already limited water resources.

Market Trends

The rise in unconventional oil and gas resources is the upcoming trend in the market. The oil and gas industry is witnessing a shift towards unconventional resources, such as tight oil, shale gas, coalbed methane, and oil from unconventional sources. These resources are located in low permeability formations, including limestone, carbonates, siltstones, and fine-grained organic-rich rock. The extraction of these resources necessitates advanced well completion and stimulation methods, including hydraulic fracturing and acidizing. With the rise of unconventional oil and gas exploration, population growth and urbanization in various regions are driving the demand for these resources. Fossil fuels, including crude oil and natural gas, continue to play a significant role in transportation and industrial activities.

However, the extraction of unconventional resources requires vast amounts of water, making water management services essential. As the share of oil and gas extracted from unconventional sources is projected to increase significantly over the next decade, the need for effective water management solutions will become even more critical. The urbanization and population growth in areas with unconventional resources will further increase the demand for these services. Therefore, the market for produced water treatment is expected to grow substantially in the coming years.

Market Challenge

Increasing use of renewable energy sources is a key challenge affecting the market growth. Fossil fuels, primarily crude oil, and natural gas have historically met the world's energy demands. However, over the past two decades, there has been a significant shift in the global energy landscape. Renewable energy sources, such as wind and solar, are increasingly becoming competitive in terms of cost and are producing lower greenhouse gas emissions compared to fossil fuels. This trend is being driven by urbanization, population growth, and the increasing demand for transportation and industrial activities. Europe, in particular, is making strides towards decarbonization with a firm commitment to the Paris Agreement of 2015. The European Union aims to generate 35% of its power from renewable sources by 2030. This transition towards renewable energy is a response to the need for a more sustainable and low-carbon energy future.

Exclusive Customer Landscape

The market forecasting report includes the adoption lifecycle of the market, covering from the innovator's stage to the laggard's stage. It focuses on adoption rates in different regions based on penetration. Furthermore, the report also includes key purchase criteria and drivers of price sensitivity to help companies evaluate and develop their market growth analysis strategies.
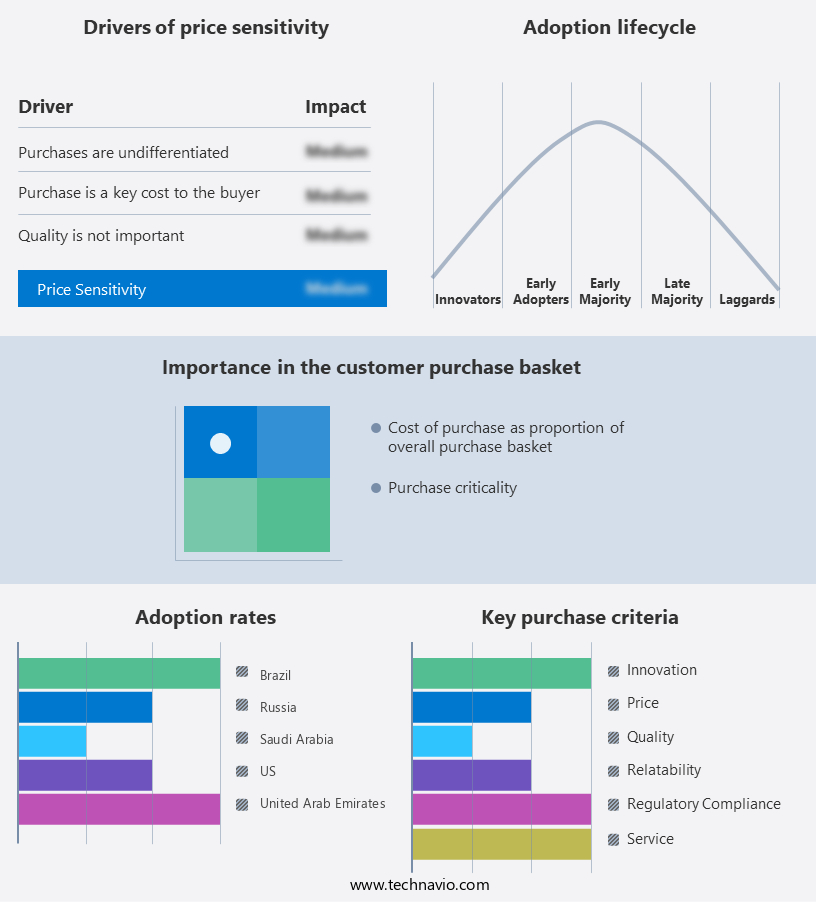
Produced Water Treatment Market Share by Geography

 Customer Landscape

Key Companies & Market Insights

Companies are implementing various strategies, such as strategic alliances, partnerships, mergers and acquisitions, geographical expansion, and product/service launches, to enhance their presence in the market.

Alderley Plc - The company offers produced water treatment solutions such as AP20 Hydrocyclone Liner. Also, the company offers gas metering systems, turbine meters, and de-oiling and de-sanding hydro-cyclone equipment.

The market research and growth report includes detailed analyses of the competitive landscape of the market and information about key companies, including:

  • Aker Solutions ASA
  • Aquatech International LLC
  • Baker Hughes Co.
  • Enviro Tech Systems
  • Exterran Corp.
  • Frames Energy Systems BV
  • Genesis Water Technologies Inc.
  • Halliburton Co.
  • IDE Water Technologies
  • Minerals Technologies Inc.
  • NOV Inc.
  • Ovivo Inc.
  • Prosep Inc.
  • Schlumberger Ltd.
  • Siemens Energy AG
  • SUEZ SA
  • TechnipFMC plc
  • Veolia Environnement SA
  • Weatherford International Plc

Qualitative and quantitative analysis of companies has been conducted to help clients understand the wider business environment as well as the strengths and weaknesses of key market players. Data is qualitatively analyzed to categorize companies as pure play, category-focused, industry-focused, and diversified; it is quantitatively analyzed to categorize companies as dominant, leading, strong, tentative, and weak.

Research Analyst Overview

The produced water market in the oil & gas exploration industry is experiencing significant growth due to urbanization and population growth, leading to increased demand for fossil fuels such as crude oil and natural gas. Produced water, which is water that comes up with oil and natural gas during extraction, contains various contaminants like oil droplets, sediments, mud particles, heavy metal particles, salts, hydrocarbons, and organic compounds. These contaminants pose environmental concerns when discharged into water bodies, leading to stringent regulations. Well exploration projects result in large volumes of produced water, which requires compliance with regulatory requirements for disposal.

Moreover, the traditional methods like saltwater disposal wells and lined evaporation pits have been used, but innovative treatment solutions are gaining popularity to reduce the environmental impact. Advanced treatment technologies like membrane filtration, electrocoagulation, and chemical treatment processes are being adopted to remove harmful contaminants from produced water. Environmental concerns, water scarcity, and freshwater usage are driving the demand for efficient and cost-effective water treatment methods. The oil & gas reservoirs and river streams are the primary sources of produced water, and the wastewater industry is also adopting these advanced treatment technologies to address the challenges of handling large volumes of contaminated water.

Further, the focus on productivity, water table management, and filtration techniques like flotation is essential for the sustainable use of produced water. Siemens Energy and other leading players are investing in research and development to provide efficient and eco-friendly produced water treatment solutions.

Market Scope

Report Coverage

Details

Page number

168

Base year

2023

Historic period

2018-2022

Forecast period

2024-2028

Growth momentum & CAGR

Accelerate at a CAGR of 7.06%

Market growth 2024-2028

USD 2.97 billion

Market structure

Fragmented

YoY growth 2023-2024(%)

6.47

Regional analysis

North America, Europe, Middle East and Africa, South America, and APAC

Performing market contribution

North America at 41%

Key countries

US, Russia, Saudi Arabia, United Arab Emirates, and Brazil

Competitive landscape

Leading Companies, Market Positioning of Companies, Competitive Strategies, and Industry Risks

Key companies profiled

Aker Solutions ASA, Alderley Plc, Aquatech International LLC, Baker Hughes Co., Enviro Tech Systems, Exterran Corp., Frames Energy Systems BV, Genesis Water Technologies Inc., Halliburton Co., IDE Water Technologies, Minerals Technologies Inc., NOV Inc., Ovivo Inc., Prosep Inc., Schlumberger Ltd., Siemens Energy AG, SUEZ SA, TechnipFMC plc, Veolia Environnement SA, and Weatherford International Plc

Market dynamics

Parent market analysis, market growth inducers and obstacles, market forecast, fast-growing and slow-growing segment analysis, COVID-19 impact and recovery analysis and future consumer dynamics, market condition analysis for the forecast period

Customization purview

If our market report has not included the data that you are looking for, you can reach out to our analysts and get segments customized.

Request Free Sample

What are the Key Data Covered in this Market Research and Growth Report?

  • CAGR of the market during the forecast period
  • Detailed information on factors that will drive the market growth and forecasting between 2024 and 2028
  • Precise estimation of the size of the market  and its contribution of the market in focus to the parent market
  • Accurate predictions about upcoming market growth and trends and changes in consumer behaviour
  • Growth of the market across North America, Europe, Middle East and Africa, South America, and APAC
  • Thorough analysis of the market's competitive landscape and detailed information about companies
  • Comprehensive analysis of factors that will challenge the growth of market companies

We can help! Our analysts can customize this market research report to meet your requirements. Get in touch

1 Executive Summary

  • 1.1 Market overview
    • Executive Summary - Chart on Market Overview
    • Executive Summary - Data Table on Market Overview
    • Executive Summary - Chart on Global Market Characteristics
    • Executive Summary - Chart on Market by Geography
    • Executive Summary - Chart on Market Segmentation by Application
    • Executive Summary - Chart on Market Segmentation by Technology
    • Executive Summary - Chart on Incremental Growth
    • Executive Summary - Data Table on Incremental Growth
    • Executive Summary - Chart on Company Market Positioning

2 Market Landscape

  • 2.1 Market ecosystem
    • Parent Market
    • Data Table on - Parent Market
  • 2.2 Market characteristics
    • Market characteristics analysis
  • 2.3 Value chain analysis
    • Value Chain Analysis

3 Market Sizing

  • 3.1 Market definition
    • Offerings of companies included in the market definition
  • 3.2 Market segment analysis
    • Market segments
  • 3.3 Market size 2023
    • 3.4 Market outlook: Forecast for 2023-2028
      • Chart on Global - Market size and forecast 2023-2028 ($ million)
      • Data Table on Global - Market size and forecast 2023-2028 ($ million)
      • Chart on Global Market: Year-over-year growth 2023-2028 (%)
      • Data Table on Global Market: Year-over-year growth 2023-2028 (%)

    4 Historic Market Size

    • 4.1 Global Produced Water Treatment Market 2018 - 2022
      • Historic Market Size - Data Table on Global Produced Water Treatment Market 2018 - 2022 ($ million)
    • 4.2 Application segment analysis 2018 - 2022
      • Historic Market Size - Application Segment 2018 - 2022 ($ million)
    • 4.3 Technology segment analysis 2018 - 2022
      • Historic Market Size - Technology Segment 2018 - 2022 ($ million)
    • 4.4 Geography segment analysis 2018 - 2022
      • Historic Market Size - Geography Segment 2018 - 2022 ($ million)
    • 4.5 Country segment analysis 2018 - 2022
      • Historic Market Size - Country Segment 2018 - 2022 ($ million)

    5 Five Forces Analysis

    • 5.1 Five forces summary
      • Five forces analysis - Comparison between 2023 and 2028
    • 5.2 Bargaining power of buyers
      • Bargaining power of buyers - Impact of key factors 2023 and 2028
    • 5.3 Bargaining power of suppliers
      • Bargaining power of suppliers - Impact of key factors in 2023 and 2028
    • 5.4 Threat of new entrants
      • Threat of new entrants - Impact of key factors in 2023 and 2028
    • 5.5 Threat of substitutes
      • Threat of substitutes - Impact of key factors in 2023 and 2028
    • 5.6 Threat of rivalry
      • Threat of rivalry - Impact of key factors in 2023 and 2028
    • 5.7 Market condition
      • Chart on Market condition - Five forces 2023 and 2028

    6 Market Segmentation by Application

    • 6.1 Market segments
      • Chart on Application - Market share 2023-2028 (%)
      • Data Table on Application - Market share 2023-2028 (%)
    • 6.2 Comparison by Application
      • Chart on Comparison by Application
      • Data Table on Comparison by Application
    • 6.3 Onshore - Market size and forecast 2023-2028
      • Chart on Onshore - Market size and forecast 2023-2028 ($ million)
      • Data Table on Onshore - Market size and forecast 2023-2028 ($ million)
      • Chart on Onshore - Year-over-year growth 2023-2028 (%)
      • Data Table on Onshore - Year-over-year growth 2023-2028 (%)
    • 6.4 Offshore - Market size and forecast 2023-2028
      • Chart on Offshore - Market size and forecast 2023-2028 ($ million)
      • Data Table on Offshore - Market size and forecast 2023-2028 ($ million)
      • Chart on Offshore - Year-over-year growth 2023-2028 (%)
      • Data Table on Offshore - Year-over-year growth 2023-2028 (%)
    • 6.5 Market opportunity by Application
      • Market opportunity by Application ($ million)
      • Data Table on Market opportunity by Application ($ million)

    7 Market Segmentation by Technology

    • 7.1 Market segments
      • Chart on Technology - Market share 2023-2028 (%)
      • Data Table on Technology - Market share 2023-2028 (%)
    • 7.2 Comparison by Technology
      • Chart on Comparison by Technology
      • Data Table on Comparison by Technology
    • 7.3 Secondary treatment - Market size and forecast 2023-2028
      • Chart on Secondary treatment - Market size and forecast 2023-2028 ($ million)
      • Data Table on Secondary treatment - Market size and forecast 2023-2028 ($ million)
      • Chart on Secondary treatment - Year-over-year growth 2023-2028 (%)
      • Data Table on Secondary treatment - Year-over-year growth 2023-2028 (%)
    • 7.4 Primary treatment - Market size and forecast 2023-2028
      • Chart on Primary treatment - Market size and forecast 2023-2028 ($ million)
      • Data Table on Primary treatment - Market size and forecast 2023-2028 ($ million)
      • Chart on Primary treatment - Year-over-year growth 2023-2028 (%)
      • Data Table on Primary treatment - Year-over-year growth 2023-2028 (%)
    • 7.5 Tertiary treatment - Market size and forecast 2023-2028
      • Chart on Tertiary treatment - Market size and forecast 2023-2028 ($ million)
      • Data Table on Tertiary treatment - Market size and forecast 2023-2028 ($ million)
      • Chart on Tertiary treatment - Year-over-year growth 2023-2028 (%)
      • Data Table on Tertiary treatment - Year-over-year growth 2023-2028 (%)
    • 7.6 Market opportunity by Technology
      • Market opportunity by Technology ($ million)
      • Data Table on Market opportunity by Technology ($ million)

    8 Customer Landscape

    • 8.1 Customer landscape overview
      • Analysis of price sensitivity, lifecycle, customer purchase basket, adoption rates, and purchase criteria

    9 Geographic Landscape

    • 9.1 Geographic segmentation
      • Chart on Market share by geography 2023-2028 (%)
      • Data Table on Market share by geography 2023-2028 (%)
    • 9.2 Geographic comparison
      • Chart on Geographic comparison
      • Data Table on Geographic comparison
    • 9.3 North America - Market size and forecast 2023-2028
      • Chart on North America - Market size and forecast 2023-2028 ($ million)
      • Data Table on North America - Market size and forecast 2023-2028 ($ million)
      • Chart on North America - Year-over-year growth 2023-2028 (%)
      • Data Table on North America - Year-over-year growth 2023-2028 (%)
    • 9.4 Europe - Market size and forecast 2023-2028
      • Chart on Europe - Market size and forecast 2023-2028 ($ million)
      • Data Table on Europe - Market size and forecast 2023-2028 ($ million)
      • Chart on Europe - Year-over-year growth 2023-2028 (%)
      • Data Table on Europe - Year-over-year growth 2023-2028 (%)
    • 9.5 Middle East and Africa - Market size and forecast 2023-2028
      • Chart on Middle East and Africa - Market size and forecast 2023-2028 ($ million)
      • Data Table on Middle East and Africa - Market size and forecast 2023-2028 ($ million)
      • Chart on Middle East and Africa - Year-over-year growth 2023-2028 (%)
      • Data Table on Middle East and Africa - Year-over-year growth 2023-2028 (%)
    • 9.6 South America - Market size and forecast 2023-2028
      • Chart on South America - Market size and forecast 2023-2028 ($ million)
      • Data Table on South America - Market size and forecast 2023-2028 ($ million)
      • Chart on South America - Year-over-year growth 2023-2028 (%)
      • Data Table on South America - Year-over-year growth 2023-2028 (%)
    • 9.7 APAC - Market size and forecast 2023-2028
      • Chart on APAC - Market size and forecast 2023-2028 ($ million)
      • Data Table on APAC - Market size and forecast 2023-2028 ($ million)
      • Chart on APAC - Year-over-year growth 2023-2028 (%)
      • Data Table on APAC - Year-over-year growth 2023-2028 (%)
    • 9.8 US - Market size and forecast 2023-2028
      • Chart on US - Market size and forecast 2023-2028 ($ million)
      • Data Table on US - Market size and forecast 2023-2028 ($ million)
      • Chart on US - Year-over-year growth 2023-2028 (%)
      • Data Table on US - Year-over-year growth 2023-2028 (%)
    • 9.9 Russia - Market size and forecast 2023-2028
      • Chart on Russia - Market size and forecast 2023-2028 ($ million)
      • Data Table on Russia - Market size and forecast 2023-2028 ($ million)
      • Chart on Russia - Year-over-year growth 2023-2028 (%)
      • Data Table on Russia - Year-over-year growth 2023-2028 (%)
    • 9.10 Saudi Arabia - Market size and forecast 2023-2028
      • Chart on Saudi Arabia - Market size and forecast 2023-2028 ($ million)
      • Data Table on Saudi Arabia - Market size and forecast 2023-2028 ($ million)
      • Chart on Saudi Arabia - Year-over-year growth 2023-2028 (%)
      • Data Table on Saudi Arabia - Year-over-year growth 2023-2028 (%)
    • 9.11 United Arab Emirates - Market size and forecast 2023-2028
      • Chart on United Arab Emirates - Market size and forecast 2023-2028 ($ million)
      • Data Table on United Arab Emirates - Market size and forecast 2023-2028 ($ million)
      • Chart on United Arab Emirates - Year-over-year growth 2023-2028 (%)
      • Data Table on United Arab Emirates - Year-over-year growth 2023-2028 (%)
    • 9.12 Brazil - Market size and forecast 2023-2028
      • Chart on Brazil - Market size and forecast 2023-2028 ($ million)
      • Data Table on Brazil - Market size and forecast 2023-2028 ($ million)
      • Chart on Brazil - Year-over-year growth 2023-2028 (%)
      • Data Table on Brazil - Year-over-year growth 2023-2028 (%)
    • 9.13 Market opportunity by geography
      • Market opportunity by geography ($ million)
      • Data Tables on Market opportunity by geography ($ million)

    10 Drivers, Challenges, and Opportunity/Restraints

    • 10.1 Market drivers
      • 10.2 Market challenges
        • 10.3 Impact of drivers and challenges
          • Impact of drivers and challenges in 2023 and 2028
        • 10.4 Market opportunities/restraints

          11 Competitive Landscape

          • 11.1 Overview
            • 11.2 Competitive Landscape
              • Overview on criticality of inputs and factors of differentiation
            • 11.3 Landscape disruption
              • Overview on factors of disruption
            • 11.4 Industry risks
              • Impact of key risks on business

            12 Competitive Analysis

            • 12.1 Companies profiled
              • Companies covered
            • 12.2 Market positioning of companies
              • Matrix on companies position and classification
            • 12.3 Aker Solutions ASA
              • Aker Solutions ASA - Overview
              • Aker Solutions ASA - Business segments
              • Aker Solutions ASA - Key news
              • Aker Solutions ASA - Key offerings
              • Aker Solutions ASA - Segment focus
            • 12.4 Alderley Plc
              • Alderley Plc - Overview
              • Alderley Plc - Product / Service
              • Alderley Plc - Key offerings
            • 12.5 Aquatech International LLC
              • Aquatech International LLC - Overview
              • Aquatech International LLC - Product / Service
              • Aquatech International LLC - Key offerings
            • 12.6 Baker Hughes Co.
              • Baker Hughes Co. - Overview
              • Baker Hughes Co. - Business segments
              • Baker Hughes Co. - Key news
              • Baker Hughes Co. - Key offerings
              • Baker Hughes Co. - Segment focus
            • 12.7 Enviro Tech Systems
              • Enviro Tech Systems - Overview
              • Enviro Tech Systems - Product / Service
              • Enviro Tech Systems - Key offerings
            • 12.8 Exterran Corp.
              • Exterran Corp. - Overview
              • Exterran Corp. - Business segments
              • Exterran Corp. - Key offerings
              • Exterran Corp. - Segment focus
            • 12.9 Frames Energy Systems BV
              • Frames Energy Systems BV - Overview
              • Frames Energy Systems BV - Product / Service
              • Frames Energy Systems BV - Key offerings
            • 12.10 Genesis Water Technologies Inc.
              • Genesis Water Technologies Inc. - Overview
              • Genesis Water Technologies Inc. - Product / Service
              • Genesis Water Technologies Inc. - Key offerings
            • 12.11 Halliburton Co.
              • Halliburton Co. - Overview
              • Halliburton Co. - Business segments
              • Halliburton Co. - Key news
              • Halliburton Co. - Key offerings
              • Halliburton Co. - Segment focus
            • 12.12 IDE Water Technologies
              • IDE Water Technologies - Overview
              • IDE Water Technologies - Product / Service
              • IDE Water Technologies - Key offerings
            • 12.13 Minerals Technologies Inc.
              • Minerals Technologies Inc. - Overview
              • Minerals Technologies Inc. - Business segments
              • Minerals Technologies Inc. - Key news
              • Minerals Technologies Inc. - Key offerings
              • Minerals Technologies Inc. - Segment focus
            • 12.14 NOV Inc.
              • NOV Inc. - Overview
              • NOV Inc. - Business segments
              • NOV Inc. - Key news
              • NOV Inc. - Key offerings
              • NOV Inc. - Segment focus
            • 12.15 Ovivo Inc.
              • Ovivo Inc. - Overview
              • Ovivo Inc. - Product / Service
              • Ovivo Inc. - Key offerings
            • 12.16 Prosep Inc.
              • Prosep Inc. - Overview
              • Prosep Inc. - Product / Service
              • Prosep Inc. - Key offerings
            • 12.17 Schlumberger Ltd.
              • Schlumberger Ltd. - Overview
              • Schlumberger Ltd. - Business segments
              • Schlumberger Ltd. - Key news
              • Schlumberger Ltd. - Key offerings
              • Schlumberger Ltd. - Segment focus

            13 Appendix

            • 13.1 Scope of the report
              • 13.2 Inclusions and exclusions checklist
                • Inclusions checklist
                • Exclusions checklist
              • 13.3 Currency conversion rates for US$
                • Currency conversion rates for US$
              • 13.4 Research methodology
                • Research methodology
              • 13.5 Data procurement
                • Information sources
              • 13.6 Data validation
                • Data validation
              • 13.7 Validation techniques employed for market sizing
                • Validation techniques employed for market sizing
              • 13.8 Data synthesis
                • Data synthesis
              • 13.9 360 degree market analysis
                • 360 degree market analysis
              • 13.10 List of abbreviations
                • List of abbreviations

              Research Methodology

              Technavio presents a detailed picture of the market by way of study, synthesis, and summation of data from multiple sources. The analysts have presented the various facets of the market with a particular focus on identifying the key industry influencers. The data thus presented is comprehensive, reliable, and the result of extensive research, both primary and secondary.

              INFORMATION SOURCES

              Primary sources

              • Manufacturers and suppliers
              • Channel partners
              • Industry experts
              • Strategic decision makers

              Secondary sources

              • Industry journals and periodicals
              • Government data
              • Financial reports of key industry players
              • Historical data
              • Press releases

              DATA ANALYSIS

              Data Synthesis

              • Collation of data
              • Estimation of key figures
              • Analysis of derived insights

              Data Validation

              • Triangulation with data models
              • Reference against proprietary databases
              • Corroboration with industry experts

              REPORT WRITING

              Qualitative

              • Market drivers
              • Market challenges
              • Market trends
              • Five forces analysis

              Quantitative

              • Market size and forecast
              • Market segmentation
              • Geographical insights
              • Competitive landscape

              Interested in this report?

              Get your sample now to see our research methodology and insights!

              Download Now

              Frequently Asked Questions

              Produced Water Treatment market growth will increase by $ 2976.8 mn during 2024-2028 .

              The Produced Water Treatment market is expected to grow at a CAGR of 7.06% during 2024-2028 .

              Produced Water Treatment market is segmented by Application( Onshore, Offshore) Technology( Secondary treatment, Primary treatment, Tertiary treatment, South America, APAC)

              Aker Solutions ASA, Alderley Plc, Aquatech International LLC, Baker Hughes Co., Enviro Tech Systems, Exterran Corp., Frames Energy Systems BV, Genesis Water Technologies Inc., Halliburton Co., IDE Water Technologies, Minerals Technologies Inc., NOV Inc., Ovivo Inc., Prosep Inc., Schlumberger Ltd., Siemens Energy AG, SUEZ SA, TechnipFMC plc, Veolia Environnement SA, Weatherford International Plc are a few of the key vendors in the Produced Water Treatment market.

              North America will register the highest growth rate of 41% among the other regions. Therefore, the Produced Water Treatment market in North America is expected to garner significant business opportunities for the vendors during the forecast period.

              US, Russia, Saudi Arabia, United Arab Emirates, Brazil

              • Increasing global concerns regarding water scarcityThe growing global stress due to the depleting water resources is a key factor driving the demand for produced water treatment. According to the world water development report released by the United Nations (UN) in 2022 is the driving factor this market.
              • more than 2 billion people do not have access to safe drinking water. Moreover is the driving factor this market.
              • the report stated that with the global population growing rapidly is the driving factor this market.
              • the demand for water is expected to increase by nearly one-third by 2050.As per the UN is the driving factor this market.
              • water stress starts when the water available in a country drops below 1 is the driving factor this market.
              • 700 m3/year or 4 is the driving factor this market.
              • 600 liters/day per person. Absolute water scarcity is considered for countries with less than 500 m3/year or roughly 1 is the driving factor this market.
              • 400 liters/day per person. As per this definition is the driving factor this market.
              • in the current scenario is the driving factor this market.
              • almost 49 countries are water-stressed is the driving factor this market.
              • 9 of which are experiencing water scarcity is the driving factor this market.
              • and 21 are facing absolute water scarcity. These facts clearly highlight the reason why there has been a global consensus regarding water conservation and protecting water bodies. Moreover is the driving factor this market.
              • there has been a reduction in the water resources available due to factors such as shrinking groundwater resources is the driving factor this market.
              • receding lakes is the driving factor this market.
              • and diminishing snowmelt. Factors such as lower-than-average rainfalls and increasing global temperature due to global warming are further increasing the stress related to the availability of water resources.Water scarcity is a huge concern as water is extensively used for residential purposes and commercial purposes is the driving factor this market.
              • especially for high-volume industrial water facilities and businesses. Geographically is the driving factor this market.
              • countries and various states that have a huge industrial base and a huge population is the driving factor this market.
              • such as California in the US and Chennai in India is the driving factor this market.
              • are water-stressed locations is the driving factor this market.
              • and they continue to struggle when it comes to allocating fair amounts of water. Even though there are certain areas of the world that have not yet felt the pressure of a water shortage is the driving factor this market.
              • it is very feasible for companies to plan and adopt technologies to conserve water. These factors are expected to drive the demand for produced water treatment during the forecast period. is the driving factor this market.

              The Produced Water Treatment market vendors should focus on grabbing business opportunities from the Onshore segment as it accounted for the largest market share in the base year.