Silver Salt Market Analysis APAC, North America, Europe, Middle East and Africa, South America - US, Canada, China, Japan, UK - Size and Forecast 2024-2028

Silver Salt Market Analysis APAC, North America, Europe, Middle East and Africa, South America - US, Canada, China, Japan, UK - Size and Forecast 2024-2028

Published: Mar 2024 158 Pages SKU: IRTNTR77807

Market Overview at a Glance

$721.34 Mn
Market Opportunity
7.91%
CAGR
7.51
YoY growth 2023-2024(%)

Silver Salt Market Size 2024-2028 

The silver salt market size is forecast to increase by USD 721.34 million at a CAGR of 7.91% between 2023 and 2028.

  • The market is experiencing significant growth due to its applications in various industries, including the ceramic industry, weather modification, water and wastewater treatment, medicine and healthcare, and analytical reagents for glass coating. The miniaturization of electronics and advancements in nanotechnology are driving market expansion. The market is driven by the growing trend towards smaller, more efficient electronics, which require high-performance materials like silver salt. In healthcare, silver nanoparticles are employed in antimicrobial coatings, wound dressings, medical devices, and hygiene products, inhibiting the growth of bacteria, fungi, and viruses. However, the market faces challenges due to the volatility in silver prices, which can impact the cost-effectiveness of using silver salt in manufacturing processes. Despite this, the market is expected to continue growing, driven by the increasing demand for electronic devices and the ongoing advancements in technology.

What will be the Size of the Market During the Forecast Period?

Silver Salt Market Size

 Request Free Sample

  • Silver salt, a chemical substance obtained from the reaction of silver with halogens such as chlorine, bromine, iodine, or fluorine, plays a significant role in various industries. The primary use of silver salt is in photography as a photosensitive material, where it forms the emulsion layer on photographic film or paper. Silver salt reacts with light to produce metallic silver, which forms the image on the film or paper. Silver nitrate is a common form of silver salt used in photography. In the electrical industry, silver salt is used as an anode in batteries. In the medical industry, silver salt is used in the production of cosmic radiation detectors and as an oxidizing agent in medicine.

  • In water & wastewater treatment, silver salt is used as a disinfectant. In the chemical manufacturing industry, silver salt is used as a catalyst in organic synthesis. Silver chloride (AgCl), silver bromide (AgBr), silver iodide (AgI), and silver fluoride (AgF) are different forms of silver salt. Silver salt is also used in bleaching & cleaning processes due to its oxidizing properties. Overall, the market is driven by the demand from the photography industry, the electrical industry, the medical industry, and the water & wastewater treatment industry.

How is this market segmented and which is the largest segment?

The market research report provides comprehensive data (region-wise segment analysis), with forecasts and estimates in "USD million" for the period 2024-2028, as well as historical data from 2018-2022 for the following segments.

  • Type
    • Silver iodide
    • Silver bromide
    • Silver chloride
    • Silver fluoride
    • Others
  • Application
    • Chemical manufacturing
    • Medical and medical devices
    • Photographic film and paper
    • Others
  • Geography
    • APAC
      • China
      • Japan
    • North America
      • Canada
      • US
    • Europe
      • UK
    • Middle East and Africa
    • South America

By Type Insights

  • The silver iodide segment is estimated to witness significant growth during the forecast period.

Silver salt, specifically silver iodide (AgI), plays a significant role in various industries due to its unique properties. In the field of photography, silver iodide is a crucial component of photosensitive materials, including photographic film and paper. The silver salt crystals on a paper or glass substrate are sensitive to light, enabling the capture of images. Halogens, such as iodine, bromine, and chlorine, react with silver nitrate to form silver halides during the manufacturing process of photographic materials. These silver salts are essential in the chemical reaction that produces an image when exposed to light. Beyond photography, silver iodide is utilized in diverse applications.

Furthermore, it serves as an anode in the electrical industry, an oxidizing agent in water & wastewater treatment, and a disinfectant and deodorizing agent in the medical industry. In the chemical manufacturing industry, silver iodide is employed as a catalyst in organic synthesis and infrared applications. Moreover, silver iodide is a vital component in cosmic radiation detectors due to its photosensitive properties and antiseptic properties in the pharmaceutical & medical devices sector. Its usage extends to bleaching & cleaning processes and plating & electronics. In research & laboratory settings, silver iodide is employed as a catalyst in numerous chemical reactions.

Silver Salt Market Size

Get a glance at the market report of share of various segments Request Free Sample

The Silver iodide segment was valued at USD 327.58 million in 2018 and showed a gradual increase during the forecast period.

Regional Analysis

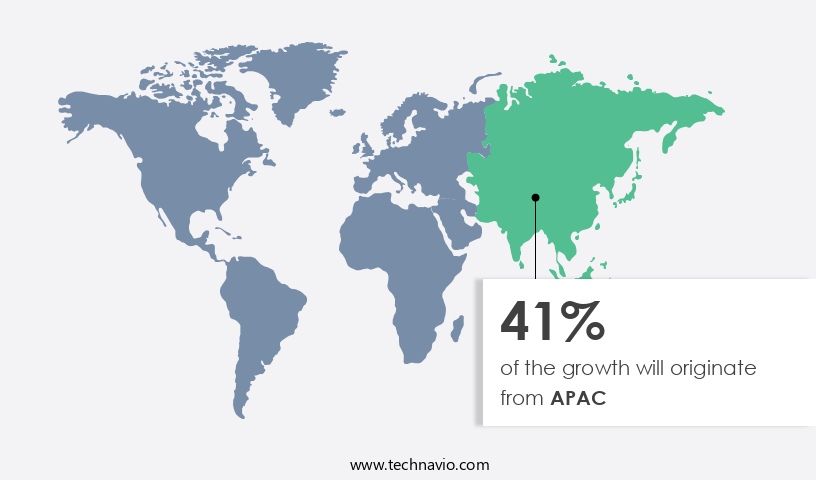
  • APAC is estimated to contribute 41% to the growth of the global market during the forecast period.

Technavio's analysts have elaborately explained the regional trends and drivers that shape the market during the forecast period.

Silver Salt Market Share by Geography

For more insights on the market share of various regions Request Free Sample

The Asia Pacific (APAC) region is undergoing significant industrial expansion, notably in sectors such as electronics, automotive, pharmaceuticals, and chemicals. The increasing manufacturing activities in these industries may lead to a heightened demand for silver salts, which are utilized as catalysts, conductive materials, or chemical intermediates. The APAC region is a significant production hub for electronics, encompassing semiconductors, consumer electronics, and telecommunication devices. Silver salts, primarily silver nitrate, are integral to the formulation of conductive inks and pastes for printed electronics. The burgeoning electronics industry in APAC is poised to fuel the demand for silver salts. Moreover, with the expanding population and escalating healthcare expenditure in the APAC region, there is a projected rise in the utilization of silver salts in healthcare and pharmaceutical applications.

Market Dynamics

Our researchers analyzed the data with 2023 as the base year, along with the key drivers, trends, and challenges. A holistic analysis of drivers will help companies refine their marketing strategies to gain a competitive advantage.

What are the key market drivers leading to the rise in adoption of Silver Salt Market?

The growing miniaturization of electronics is the key driver of the market.

  • In the realm of advanced technology, the demand for miniaturized electronic components and flexible electronics is on the rise. Conductive inks and pastes play a crucial role in the production of these components, with silver salts, such as silver nitrate, being essential materials in their manufacture. These chemical substances are used in the creation of conductive inks and films for printed circuit boards (PCBs), flexible electronics, and other compact electronic devices. Flexible electronics, including wearable technology, foldable displays, and smart sensors, necessitate the use of flexible substrates and conductive materials that can adapt to irregular shapes. Silver salts are integral to the production of flexible conductive inks and films, which enable the fabrication of flexible electronic components.
  • The chemical manufacture of silver salts is a critical process in the photography industry, where they are used as developing agents. Furthermore, the medical sector also utilizes silver salts for various applications, such as wound care and water purification. The end-use industries for silver salts are diverse, making it a versatile chemical substance in the technology and healthcare sectors. 

What are the market trends shaping the Silver Salt Market?

Advancements in nanotechnology is the upcoming trend in the market.

  • Nanotechnology facilitates the precise manipulation of matter at the nanoscale, resulting in the generation of silver nanoparticles from silver salts. Silver nanoparticles boast distinctive characteristics, such as a large surface area-to-volume ratio, heightened reactivity, and antimicrobial properties.
  • These nanoparticles can be synthesized from silver chloride, silver bromide, and silver iodide using techniques like chemical reduction, sol-gel methods, and electrochemical deposition. In various industries, including healthcare, textiles, cosmetics, and consumer products, silver nanoparticles derived from silver salts are extensively employed due to their potent antimicrobial capabilities. These nanoparticles inhibit the growth of bacteria, fungi, and viruses, making them valuable components in antimicrobial coatings, wound dressings, medical devices, and hygiene products.

What challenges does Silver Salt Market face during the growth?

Volatility in silver prices is a key challenge affecting the market growth.

  • Silver salts are essential in various industries, including the ceramic industry, weather modification, water and wastewater treatment, medicine and healthcare, and analytical reagents, among others. The price of silver, a primary ingredient in the production of silver salts, can significantly impact the market. Fluctuations in silver prices can lead to increased production costs for silver salt manufacturers, making it difficult for them to maintain stable prices for their products.
  • This price instability can disrupt supply chains, negatively affect profit margins, and impact business planning and investment decisions. Furthermore, the sensitivity of demand for silver salts to changes in silver prices varies across industries and applications. In the ceramic industry, for instance, the demand for silver salts may be less sensitive to silver price changes compared to the weather modification industry. 

Exclusive Customer Landscape

The market forecasting report includes the adoption lifecycle of the market, covering from the innovator's stage to the laggard's stage. It focuses on adoption rates in different regions based on penetration. Furthermore, the market report also includes key purchase criteria and drivers of price sensitivity to help companies evaluate and develop their market growth analysis strategies.
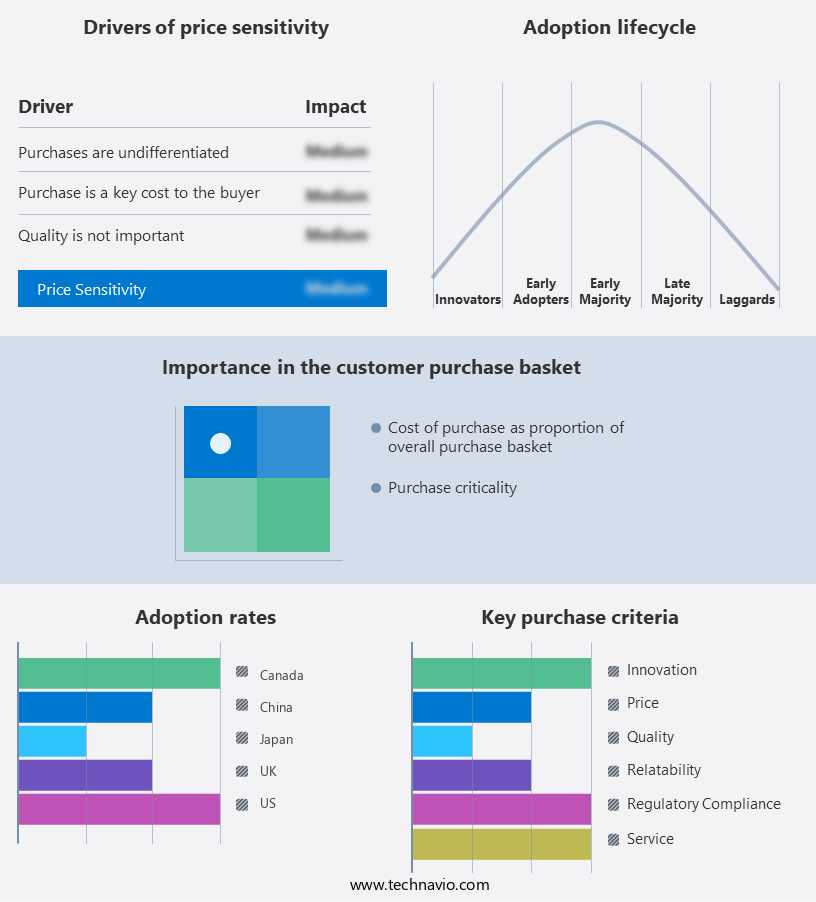
Silver Salt Market Share by Geography

 Customer Landscape

Key Companies & Market Insights

Companies are implementing various strategies, such as strategic alliances, market forecast, partnerships, mergers and acquisitions, geographical expansion, and product/service launches, to enhance their presence in the market.

The market research and growth report includes detailed analyses of the competitive landscape of the market and information about key companies, including:

  • ACS Chemicals
  • ALPHA CHEMIKA
  • American Elements
  • Ames Goldsmith Corp.
  • Celtic Chemicals Ltd.
  • Central Drug House P Ltd.
  • East India Chemicals International
  • Ennore India Chemical International
  • Fine Chemicals and Scientific Co.
  • INDIAN PLATINUM PVT LTD.
  • Infinium Pharmachem Pvt. Ltd.
  • Innova Corporate India
  • Marine Chemicals
  • Modison Metals Ltd.
  • Otto Chemie Pvt. Ltd.
  • RXChemicals
  • Sky Chem
  • Texchem Industries
  • Vizag Chemical International
  • Yogi Dye Chem Industries

Qualitative and quantitative analysis of companies has been conducted to help clients understand the wider business environment as well as the strengths and weaknesses of key market players. Data is qualitatively analyzed to categorize companies as pure play, category-focused, industry-focused, and diversified; it is quantitatively analyzed to categorize companies as dominant, leading, strong, tentative, and weak.

Research Analyst Overview

Silver salt, a chemical substance derived from the reaction of silver with halogens such as chlorine, bromine, iodine, or fluorine, plays a significant role in various industries. Silver nitrate is a common form of silver salt used in photography for creating images on film and paper. In the medical industry, silver salt crystals are utilized as anodes in electrical devices, an oxidizing agent in disinfectants, and an antiseptic in medicine. Silver salt also finds applications in the chemical manufacturing industry for bleaching and cleaning processes, as a catalyst in organic synthesis, and in the production of infrared application materials.

Furthermore, in the electrical industry, silver salt is used in plating and electronics. Moreover, silver salt is used in the research and laboratory sector for various applications, including as a catalyst in pharmaceutical & medical devices and in the ceramic industry for glass coating. The weather modification industry employs silver iodide for cloud seeding. In water & wastewater treatment, silver salt serves as a disinfectant and deodorizing agent. Silver salt's versatility extends to the cosmic radiation detector industry, where it is used in the production of photosensitive materials. Its antiseptic properties make it an essential component in medicine and healthcare, particularly in the production of analytical reagents.

Market Scope

Report Coverage

Details

Page number

158

Base year

2023

Historic period

2018-2022

Forecast period

2024-2028

Growth momentum & CAGR

Accelerate at a CAGR of 7.91%

Market Growth 2024-2028

USD 721.34 million

Market structure

Fragmented

YoY growth 2023-2024(%)

7.51

Key countries

US, Canada, China, Japan, and UK

Competitive landscape

Leading Companies, Market Positioning of Companies, Competitive Strategies, and Industry Risks

Request Free Sample

What are the Key Data Covered in this Market Research and Growth Report?

  • CAGR of the market during the forecast period
  • Detailed information on factors that will drive the market growth and forecasting between 2024 and 2028
  • Precise estimation of the size of the market  and its contribution of the market in focus to the parent market
  • Accurate predictions about upcoming market growth and trends and changes in consumer behaviour
  • Growth of the market across APAC, North America, Europe, Middle East and Africa, and South America
  • Thorough analysis of the market's competitive landscape and detailed information about companies
  • Comprehensive analysis of factors that will challenge the growth of market companies

We can help! Our analysts can customize this market research report to meet your requirements. Get in touch

1 Executive Summary

  • 1.1 Market overview
    • Exhibit 01: Executive Summary – Chart on Market Overview
    • Exhibit 02: Executive Summary – Data Table on Market Overview
    • Exhibit 03: Executive Summary – Chart on Global Market Characteristics
    • Exhibit 04: Executive Summary – Chart on Market by Geography
    • Exhibit 05: Executive Summary – Chart on Market Segmentation by Type
    • Exhibit 06: Executive Summary – Chart on Market Segmentation by Application
    • Exhibit 07: Executive Summary – Chart on Incremental Growth
    • Exhibit 08: Executive Summary – Data Table on Incremental Growth
    • Exhibit 09: Executive Summary – Chart on Vendor Market Positioning

2 Market Landscape

  • 2.1 Market ecosystem
    • Exhibit 10: Parent market
    • Exhibit 11: Market Characteristics

3 Market Sizing

  • 3.1 Market definition
    • Exhibit 12: Offerings of vendors included in the market definition
  • 3.2 Market segment analysis
    • Exhibit 13: Market segments
  • 3.3 Market size 2023
    • 3.4 Market outlook: Forecast for 2023-2028
      • Exhibit 14: Chart on Global - Market size and forecast 2023-2028 ($ million)
      • Exhibit 15: Data Table on Global - Market size and forecast 2023-2028 ($ million)
      • Exhibit 16: Chart on Global Market: Year-over-year growth 2023-2028 (%)
      • Exhibit 17: Data Table on Global Market: Year-over-year growth 2023-2028 (%)

    4 Historic Market Size

    • 4.1 Global silver salt market 2018 - 2022
      • Exhibit 18: Historic Market Size – Data Table on global silver salt market 2018 - 2022 ($ million)
    • 4.2 Type Segment Analysis 2018 - 2022
      • Exhibit 19: Historic Market Size – Type Segment 2018 - 2022 ($ million)
    • 4.3 Application Segment Analysis 2018 - 2022
      • Exhibit 20: Historic Market Size – Application Segment 2018 - 2022 ($ million)
    • 4.4 Geography Segment Analysis 2018 - 2022
      • Exhibit 21: Historic Market Size – Geography Segment 2018 - 2022 ($ million)
    • 4.5 Country Segment Analysis 2018 - 2022
      • Exhibit 22: Historic Market Size – Country Segment 2018 - 2022 ($ million)

    5 Five Forces Analysis

    • 5.1 Five forces summary
      • Exhibit 23: Five forces analysis - Comparison between 2023 and 2028
    • 5.2 Bargaining power of buyers
      • Exhibit 24: Chart on Bargaining power of buyers – Impact of key factors 2023 and 2028
    • 5.3 Bargaining power of suppliers
      • Exhibit 25: Bargaining power of suppliers – Impact of key factors in 2023 and 2028
    • 5.4 Threat of new entrants
      • Exhibit 26: Threat of new entrants – Impact of key factors in 2023 and 2028
    • 5.5 Threat of substitutes
      • Exhibit 27: Threat of substitutes – Impact of key factors in 2023 and 2028
    • 5.6 Threat of rivalry
      • Exhibit 28: Threat of rivalry – Impact of key factors in 2023 and 2028
    • 5.7 Market condition
      • Exhibit 29: Chart on Market condition - Five forces 2023 and 2028

    6 Market Segmentation by Type

    • 6.1 Market segments
      • Exhibit 30: Chart on Type - Market share 2023-2028 (%)
      • Exhibit 31: Data Table on Type - Market share 2023-2028 (%)
    • 6.2 Comparison by Type
      • Exhibit 32: Chart on Comparison by Type
      • Exhibit 33: Data Table on Comparison by Type
    • 6.3 Silver iodide - Market size and forecast 2023-2028
      • Exhibit 34: Chart on Silver iodide - Market size and forecast 2023-2028 ($ million)
      • Exhibit 35: Data Table on Silver iodide - Market size and forecast 2023-2028 ($ million)
      • Exhibit 36: Chart on Silver iodide - Year-over-year growth 2023-2028 (%)
      • Exhibit 37: Data Table on Silver iodide - Year-over-year growth 2023-2028 (%)
    • 6.4 Silver bromide - Market size and forecast 2023-2028
      • Exhibit 38: Chart on Silver bromide - Market size and forecast 2023-2028 ($ million)
      • Exhibit 39: Data Table on Silver bromide - Market size and forecast 2023-2028 ($ million)
      • Exhibit 40: Chart on Silver bromide - Year-over-year growth 2023-2028 (%)
      • Exhibit 41: Data Table on Silver bromide - Year-over-year growth 2023-2028 (%)
    • 6.5 Silver chloride - Market size and forecast 2023-2028
      • Exhibit 42: Chart on Silver chloride - Market size and forecast 2023-2028 ($ million)
      • Exhibit 43: Data Table on Silver chloride - Market size and forecast 2023-2028 ($ million)
      • Exhibit 44: Chart on Silver chloride - Year-over-year growth 2023-2028 (%)
      • Exhibit 45: Data Table on Silver chloride - Year-over-year growth 2023-2028 (%)
    • 6.6 Silver fluoride - Market size and forecast 2023-2028
      • Exhibit 46: Chart on Silver fluoride - Market size and forecast 2023-2028 ($ million)
      • Exhibit 47: Data Table on Silver fluoride - Market size and forecast 2023-2028 ($ million)
      • Exhibit 48: Chart on Silver fluoride - Year-over-year growth 2023-2028 (%)
      • Exhibit 49: Data Table on Silver fluoride - Year-over-year growth 2023-2028 (%)
    • 6.7 Others - Market size and forecast 2023-2028
      • Exhibit 50: Chart on Others - Market size and forecast 2023-2028 ($ million)
      • Exhibit 51: Data Table on Others - Market size and forecast 2023-2028 ($ million)
      • Exhibit 52: Chart on Others - Year-over-year growth 2023-2028 (%)
      • Exhibit 53: Data Table on Others - Year-over-year growth 2023-2028 (%)
    • 6.8 Market opportunity by Type
      • Exhibit 54: Market opportunity by Type ($ million)
      • Exhibit 55: Data Table on Market opportunity by Type ($ million)

    7 Market Segmentation by Application

    • 7.1 Market segments
      • Exhibit 56: Chart on Application - Market share 2023-2028 (%)
      • Exhibit 57: Data Table on Application - Market share 2023-2028 (%)
    • 7.2 Comparison by Application
      • Exhibit 58: Chart on Comparison by Application
      • Exhibit 59: Data Table on Comparison by Application
    • 7.3 Chemical manufacturing - Market size and forecast 2023-2028
      • Exhibit 60: Chart on Chemical manufacturing - Market size and forecast 2023-2028 ($ million)
      • Exhibit 61: Data Table on Chemical manufacturing - Market size and forecast 2023-2028 ($ million)
      • Exhibit 62: Chart on Chemical manufacturing - Year-over-year growth 2023-2028 (%)
      • Exhibit 63: Data Table on Chemical manufacturing - Year-over-year growth 2023-2028 (%)
    • 7.4 Medical and medical devices - Market size and forecast 2023-2028
      • Exhibit 64: Chart on Medical and medical devices - Market size and forecast 2023-2028 ($ million)
      • Exhibit 65: Data Table on Medical and medical devices - Market size and forecast 2023-2028 ($ million)
      • Exhibit 66: Chart on Medical and medical devices - Year-over-year growth 2023-2028 (%)
      • Exhibit 67: Data Table on Medical and medical devices - Year-over-year growth 2023-2028 (%)
    • 7.5 Photographic film and paper - Market size and forecast 2023-2028
      • Exhibit 68: Chart on Photographic film and paper - Market size and forecast 2023-2028 ($ million)
      • Exhibit 69: Data Table on Photographic film and paper - Market size and forecast 2023-2028 ($ million)
      • Exhibit 70: Chart on Photographic film and paper - Year-over-year growth 2023-2028 (%)
      • Exhibit 71: Data Table on Photographic film and paper - Year-over-year growth 2023-2028 (%)
    • 7.6 Others - Market size and forecast 2023-2028
      • Exhibit 72: Chart on Others - Market size and forecast 2023-2028 ($ million)
      • Exhibit 73: Data Table on Others - Market size and forecast 2023-2028 ($ million)
      • Exhibit 74: Chart on Others - Year-over-year growth 2023-2028 (%)
      • Exhibit 75: Data Table on Others - Year-over-year growth 2023-2028 (%)
    • 7.7 Market opportunity by Application
      • Exhibit 76: Market opportunity by Application ($ million)
      • Exhibit 77: Data Table on Market opportunity by Application ($ million)

    8 Customer Landscape

    • 8.1 Customer landscape overview
      • Exhibit 78: Analysis of price sensitivity, lifecycle, customer purchase basket, adoption rates, and purchase criteria

    9 Geographic Landscape

    • 9.1 Geographic segmentation
      • Exhibit 79: Chart on Market share by geography 2023-2028 (%)
      • Exhibit 80: Data Table on Market share by geography 2023-2028 (%)
    • 9.2 Geographic comparison
      • Exhibit 81: Chart on Geographic comparison
      • Exhibit 82: Data Table on Geographic comparison
    • 9.3 APAC - Market size and forecast 2023-2028
      • Exhibit 83: Chart on APAC - Market size and forecast 2023-2028 ($ million)
      • Exhibit 84: Data Table on APAC - Market size and forecast 2023-2028 ($ million)
      • Exhibit 85: Chart on APAC - Year-over-year growth 2023-2028 (%)
      • Exhibit 86: Data Table on APAC - Year-over-year growth 2023-2028 (%)
    • 9.4 North America - Market size and forecast 2023-2028
      • Exhibit 87: Chart on North America - Market size and forecast 2023-2028 ($ million)
      • Exhibit 88: Data Table on North America - Market size and forecast 2023-2028 ($ million)
      • Exhibit 89: Chart on North America - Year-over-year growth 2023-2028 (%)
      • Exhibit 90: Data Table on North America - Year-over-year growth 2023-2028 (%)
    • 9.5 Europe - Market size and forecast 2023-2028
      • Exhibit 91: Chart on Europe - Market size and forecast 2023-2028 ($ million)
      • Exhibit 92: Data Table on Europe - Market size and forecast 2023-2028 ($ million)
      • Exhibit 93: Chart on Europe - Year-over-year growth 2023-2028 (%)
      • Exhibit 94: Data Table on Europe - Year-over-year growth 2023-2028 (%)
    • 9.6 Middle East and Africa - Market size and forecast 2023-2028
      • Exhibit 95: Chart on Middle East and Africa - Market size and forecast 2023-2028 ($ million)
      • Exhibit 96: Data Table on Middle East and Africa - Market size and forecast 2023-2028 ($ million)
      • Exhibit 97: Chart on Middle East and Africa - Year-over-year growth 2023-2028 (%)
      • Exhibit 98: Data Table on Middle East and Africa - Year-over-year growth 2023-2028 (%)
    • 9.7 South America - Market size and forecast 2023-2028
      • Exhibit 99: Chart on South America - Market size and forecast 2023-2028 ($ million)
      • Exhibit 100: Data Table on South America - Market size and forecast 2023-2028 ($ million)
      • Exhibit 101: Chart on South America - Year-over-year growth 2023-2028 (%)
      • Exhibit 102: Data Table on South America - Year-over-year growth 2023-2028 (%)
    • 9.8 China - Market size and forecast 2023-2028
      • Exhibit 103: Chart on China - Market size and forecast 2023-2028 ($ million)
      • Exhibit 104: Data Table on China - Market size and forecast 2023-2028 ($ million)
      • Exhibit 105: Chart on China - Year-over-year growth 2023-2028 (%)
      • Exhibit 106: Data Table on China - Year-over-year growth 2023-2028 (%)
    • 9.9 US - Market size and forecast 2023-2028
      • Exhibit 107: Chart on US - Market size and forecast 2023-2028 ($ million)
      • Exhibit 108: Data Table on US - Market size and forecast 2023-2028 ($ million)
      • Exhibit 109: Chart on US - Year-over-year growth 2023-2028 (%)
      • Exhibit 110: Data Table on US - Year-over-year growth 2023-2028 (%)
    • 9.10 Japan - Market size and forecast 2023-2028
      • Exhibit 111: Chart on Japan - Market size and forecast 2023-2028 ($ million)
      • Exhibit 112: Data Table on Japan - Market size and forecast 2023-2028 ($ million)
      • Exhibit 113: Chart on Japan - Year-over-year growth 2023-2028 (%)
      • Exhibit 114: Data Table on Japan - Year-over-year growth 2023-2028 (%)
    • 9.11 Canada - Market size and forecast 2023-2028
      • Exhibit 115: Chart on Canada - Market size and forecast 2023-2028 ($ million)
      • Exhibit 116: Data Table on Canada - Market size and forecast 2023-2028 ($ million)
      • Exhibit 117: Chart on Canada - Year-over-year growth 2023-2028 (%)
      • Exhibit 118: Data Table on Canada - Year-over-year growth 2023-2028 (%)
    • 9.12 UK - Market size and forecast 2023-2028
      • Exhibit 119: Chart on UK - Market size and forecast 2023-2028 ($ million)
      • Exhibit 120: Data Table on UK - Market size and forecast 2023-2028 ($ million)
      • Exhibit 121: Chart on UK - Year-over-year growth 2023-2028 (%)
      • Exhibit 122: Data Table on UK - Year-over-year growth 2023-2028 (%)
    • 9.13 Market opportunity by geography
      • Exhibit 123: Market opportunity by geography ($ million)
      • Exhibit 124: Data Tables on Market opportunity by geography ($ million)

    10 Drivers, Challenges, and Trends

    • 10.1 Market drivers
      • 10.2 Market challenges
        • 10.3 Impact of drivers and challenges
          • Exhibit 125: Impact of drivers and challenges in 2023 and 2028
        • 10.4 Market trends

          11 Vendor Landscape

          • 11.1 Overview
            • 11.2 Vendor landscape
              • Exhibit 126: Overview on Criticality of inputs and Factors of differentiation
            • 11.3 Landscape disruption
              • Exhibit 127: Overview on factors of disruption
            • 11.4 Industry risks
              • Exhibit 128: Impact of key risks on business

            12 Vendor Analysis

            • 12.1 Vendors covered
              • Exhibit 129: Vendors covered
            • 12.2 Market positioning of vendors
              • Exhibit 130: Matrix on vendor position and classification
            • 12.3 ACS Chemicals
              • Exhibit 131: ACS Chemicals - Overview
              • Exhibit 132: ACS Chemicals - Product / Service
              • Exhibit 133: ACS Chemicals - Key offerings
            • 12.4 ALPHA CHEMIKA
              • Exhibit 134: ALPHA CHEMIKA - Overview
              • Exhibit 135: ALPHA CHEMIKA - Key offerings
            • 12.5 American Elements
              • Exhibit 136: American Elements - Overview
              • Exhibit 137: American Elements - Product / Service
              • Exhibit 138: American Elements - Key offerings
            • 12.6 Ames Goldsmith Corp.
              • Exhibit 139: Ames Goldsmith Corp. - Overview
              • Exhibit 140: Ames Goldsmith Corp. - Product / Service
              • Exhibit 141: Ames Goldsmith Corp. - Key offerings
            • 12.7 Celtic Chemicals Ltd.
              • Exhibit 142: Celtic Chemicals Ltd. - Overview
              • Exhibit 143: Celtic Chemicals Ltd. - Product / Service
              • Exhibit 144: Celtic Chemicals Ltd. - Key offerings
            • 12.8 East India Chemicals International
              • Exhibit 145: East India Chemicals International - Overview
              • Exhibit 146: East India Chemicals International - Product / Service
              • Exhibit 147: East India Chemicals International - Key offerings
            • 12.9 INDIAN PLATINUM PVT LTD.
              • Exhibit 148: INDIAN PLATINUM PVT LTD. - Overview
              • Exhibit 149: INDIAN PLATINUM PVT LTD. - Product / Service
              • Exhibit 150: INDIAN PLATINUM PVT LTD. - Key offerings
            • 12.10 Infinium Pharmachem Pvt. Ltd.
              • Exhibit 151: Infinium Pharmachem Pvt. Ltd. - Overview
              • Exhibit 152: Infinium Pharmachem Pvt. Ltd. - Key offerings
            • 12.11 Innova Corporate India
              • Exhibit 153: Innova Corporate India - Overview
              • Exhibit 154: Innova Corporate India - Product / Service
              • Exhibit 155: Innova Corporate India - Key offerings
            • 12.12 Modison Metals Ltd.
              • Exhibit 156: Modison Metals Ltd. - Overview
              • Exhibit 157: Modison Metals Ltd. - Product / Service
              • Exhibit 158: Modison Metals Ltd. - Key offerings
            • 12.13 Otto Chemie Pvt. Ltd.
              • Exhibit 159: Otto Chemie Pvt. Ltd. - Overview
              • Exhibit 160: Otto Chemie Pvt. Ltd. - Product / Service
              • Exhibit 161: Otto Chemie Pvt. Ltd. - Key offerings
            • 12.14 RXChemicals
              • Exhibit 162: RXChemicals - Overview
              • Exhibit 163: RXChemicals - Product / Service
              • Exhibit 164: RXChemicals - Key offerings
            • 12.15 Sky Chem
              • Exhibit 165: Sky Chem - Overview
              • Exhibit 166: Sky Chem - Product / Service
              • Exhibit 167: Sky Chem - Key offerings
            • 12.16 Texchem Industries
              • Exhibit 168: Texchem Industries - Overview
              • Exhibit 169: Texchem Industries - Product / Service
              • Exhibit 170: Texchem Industries - Key offerings
            • 12.17 Vizag Chemical International
              • Exhibit 171: Vizag Chemical International - Overview
              • Exhibit 172: Vizag Chemical International - Product / Service
              • Exhibit 173: Vizag Chemical International - Key offerings

            13 Appendix

            • 13.1 Scope of the report
              • 13.2 Inclusions and exclusions checklist
                • Exhibit 174: Inclusions checklist
                • Exhibit 175: Exclusions checklist
              • 13.3 Currency conversion rates for US$
                • Exhibit 176: Currency conversion rates for US$
              • 13.4 Research methodology
                • Exhibit 177: Research methodology
                • Exhibit 178: Validation techniques employed for market sizing
                • Exhibit 179: Information sources
              • 13.5 List of abbreviations
                • Exhibit 180: List of abbreviations

              Research Methodology

              Technavio presents a detailed picture of the market by way of study, synthesis, and summation of data from multiple sources. The analysts have presented the various facets of the market with a particular focus on identifying the key industry influencers. The data thus presented is comprehensive, reliable, and the result of extensive research, both primary and secondary.

              INFORMATION SOURCES

              Primary sources

              • Manufacturers and suppliers
              • Channel partners
              • Industry experts
              • Strategic decision makers

              Secondary sources

              • Industry journals and periodicals
              • Government data
              • Financial reports of key industry players
              • Historical data
              • Press releases

              DATA ANALYSIS

              Data Synthesis

              • Collation of data
              • Estimation of key figures
              • Analysis of derived insights

              Data Validation

              • Triangulation with data models
              • Reference against proprietary databases
              • Corroboration with industry experts

              REPORT WRITING

              Qualitative

              • Market drivers
              • Market challenges
              • Market trends
              • Five forces analysis

              Quantitative

              • Market size and forecast
              • Market segmentation
              • Geographical insights
              • Competitive landscape

              Interested in this report?

              Get your sample now to see our research methodology and insights!

              Download Now

              Frequently Asked Questions

              Silver Salt market growth will increase by $ 721.34 mn during 2024-2028 .

              The Silver Salt market is expected to grow at a CAGR of 7.91% during 2024-2028 .

              Silver Salt market is segmented by Type( Silver iodide, Silver bromide, Silver chloride, Silver fluoride, Others) Application( Chemical manufacturing, Medical and medical devices, Photographic film and paper, Others)

              ACS Chemicals, ALPHA CHEMIKA, American Elements, Ames Goldsmith Corp., Celtic Chemicals Ltd., Central Drug House P Ltd., East India Chemicals International, Ennore India Chemical International, Fine Chemicals and Scientific Co., INDIAN PLATINUM PVT LTD., Infinium Pharmachem Pvt. Ltd., Innova Corporate India, Marine Chemicals, Modison Metals Ltd., Otto Chemie Pvt. Ltd., RXChemicals, Sky Chem, Texchem Industries, Vizag Chemical International, Yogi Dye Chem Industries are a few of the key vendors in the Silver Salt market.

              APAC will register the highest growth rate of 41% among the other regions. Therefore, the Silver Salt market in APAC is expected to garner significant business opportunities for the vendors during the forecast period.

              US, Canada, China, Japan, UK

              • Growing miniaturization of electronicsAs electronic devices get smaller and more compact is the driving factor this market.
              • there is an increasing demand for conductive inks and pastes that may be printed on flexible substrates or coated in thin layers. Silver salts is the driving factor this market.
              • such as silver nitrate is the driving factor this market.
              • are important materials in the production of conductive inks and pastes for printed circuit boards (PCBs) is the driving factor this market.
              • flexible electronics is the driving factor this market.
              • and other miniaturized electronic components. Flexible electronics is the driving factor this market.
              • including wearable devices is the driving factor this market.
              • foldable displays is the driving factor this market.
              • and smart sensors is the driving factor this market.
              • rely on flexible substrates and conductive materials that can conform to irregular shapes. Silver salts are used in the production of flexible conductive inks and films that enable the fabrication of flexible electronic components. The growing demand for flexible electronics is driving the need for silver salts. Additionally is the driving factor this market.
              • the proliferation of Internet of Things (IoT) devices is the driving factor this market.
              • which are often small and battery-powered is the driving factor this market.
              • is driving demand for miniaturized electronic components. Silver salts are used in the production of sensors is the driving factor this market.
              • antennas is the driving factor this market.
              • and other electronic components found in IoT devices. As the IoT market continues to grow is the driving factor this market.
              • the demand for silver salts in this sector is expected to increase. Moreover is the driving factor this market.
              • additive manufacturing technologies is the driving factor this market.
              • such as 3D printing is the driving factor this market.
              • are being increasingly used to produce complex electronic components with precise geometries. Silver salts can be incorporated into conductive filaments or resins used in 3D printing to create intricate electronic structures. The development of 3D printing techniques for electronics manufacturing is creating new opportunities for silver salt suppliers. Furthermore is the driving factor this market.
              • silver salts are used in microelectronics manufacturing processes is the driving factor this market.
              • including semiconductor fabrication and microelectromechanical systems (MEMS) production. As the semiconductor industry continues to advance towards smaller feature sizes and higher integration densities is the driving factor this market.
              • the demand for silver salts for applications such as metallization and interconnection is expected to grow. Metallization involves depositing a thin layer of metal onto the surface of the semiconductor material is the driving factor this market.
              • typically silicon is the driving factor this market.
              • to create conductive pathways on the surface of the semiconductor is the driving factor this market.
              • whereas interconnection ensures low-resistance electrical connections while minimizing shading and electrical losses. Thus is the driving factor this market.
              • the growing miniaturization of electronics will propel the growth of the global silver salt market during the forecast period. is the driving factor this market.

              The Silver Salt market vendors should focus on grabbing business opportunities from the Silver iodide segment as it accounted for the largest market share in the base year.