Australia Water Treatment Chemicals Market Size 2024-2028
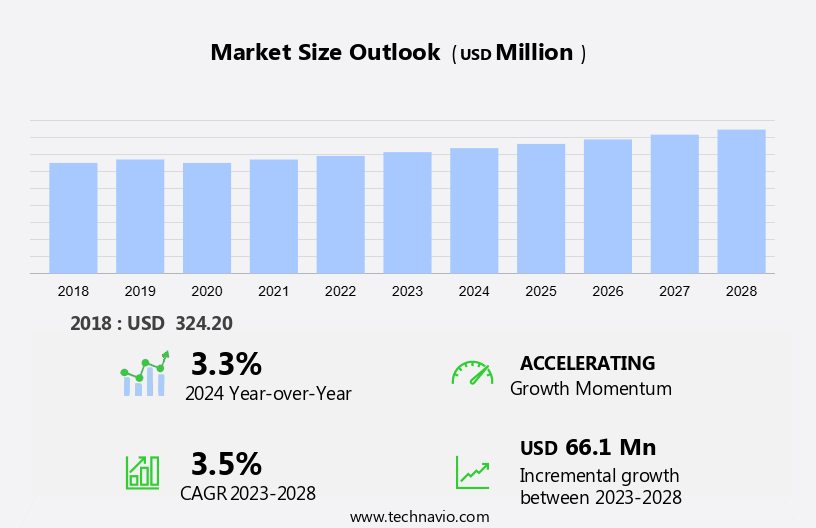
The Australia water treatment chemicals market size is forecast to increase by USD 66.1 million at a CAGR of 3.5% between 2023 and 2028.
- The water treatment chemicals market is experiencing significant growth due to the increasing demand from various industries such as sugar and ethanol production, fertilizer manufacturing, geothermal power generation, and petrochemical manufacturing. Physical methods and chemical methods are commonly used for water treatment, with chemical methods gaining popularity due to their effectiveness in removing impurities. The use of advanced analytics is driving efficiency in water treatment processes, enabling companies to optimize their operations and reduce costs.
- However, the market faces challenges such as stringent regulations and the need for sustainable and eco-friendly solutions. As the demand for water treatment chemicals continues to rise, it is essential for market players to stay abreast of the latest trends and technologies to remain competitive. The market analysis report provides insights into these trends and challenges, helping businesses make informed decisions and capitalize on opportunities in the water treatment chemicals industry.
What will be the size of the Australia Water Treatment Chemicals Market during the forecast period?
- The water treatment chemicals market is experiencing significant growth due to the increasing demand for treated water in various sectors. This demand stems from the essential role water plays in power generation and various industries such as petrochemical, ethanol, sugar, fertilizer, geothermal power generation, and renewable energy sources. Power generation relies heavily on water for cooling purposes in thermal, hydro, nuclear, and geothermal power plants. In thermal power generation, water is used as a coolant to remove heat from the turbines, while in hydroelectric power generation, water is used to generate electricity through the movement of turbines.
- In nuclear power generation, water is used as a coolant and a moderator, while in geothermal power generation, water is used as a heat transfer medium. Beyond power generation, water treatment chemicals are also crucial in various industries. In the petrochemical industry, water treatment chemicals such as sodium metabisulfite and ferric chloride are used to treat process water and wastewater to prevent corrosion and scale formation. Similarly, in the ethanol industry, water treatment chemicals like sodium hexametaphosphate are used to prevent fouling and scaling in the production process. In the sugar industry, water treatment chemicals are used to ensure the quality of the final product by removing impurities from the water used in the production process.
- In the fertilizer industry, water treatment chemicals are used to prevent the formation of scale and corrosion in cooling systems and boilers. The water treatment process involves both physical and chemical methods to ensure the water meets the required standards. Physical methods include filtration, sedimentation, and membrane technology, while chemical methods involve the addition of chemicals such as coagulants, flocculants, and disinfectants. The water requirements for various industries and power generation differ based on the specific application. For instance, the water requirements for the cooling process in power generation differ from the water requirements for the production process in the petrochemical industry.
- Therefore, the selection of water treatment chemicals depends on the specific application and the water quality requirements. The water treatment chemicals market is experiencing growth due to the increasing demand for treated water in power generation and various industries. The essential role water plays in power generation and various industries necessitates the use of water treatment chemicals to ensure the water meets the required standards. The selection of water treatment chemicals depends on the specific application and the water quality requirements.
How is this market segmented and which is the largest segment?
The market research report provides comprehensive data (region-wise segment analysis), with forecasts and estimates in "USD million" for the period 2024-2028, as well as historical data from 2018-2022 for the following segments.
- Application
- Municipality
- Power generation
- Pulp and paper
- Metal and mining
- Others
- Type
- Coagulants and flocculants
- pH adjusters and softeners
- Corrosion and scale inhibitors
- Biocides and disinfectants
- Others
- Geography
- Australia
- Australia
- Australia
By Application Insights
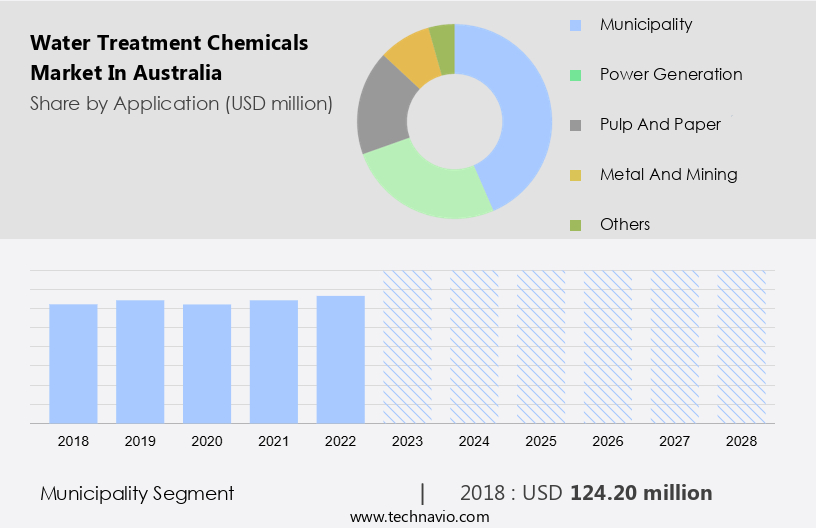
- The municipality segment is estimated to witness significant growth during the forecast period.
In Australia, municipal applications hold the largest market share in the water treatment chemicals industry. This segment caters to end-users like wastewater treatment plants and drinking water suppliers. The primary function of water treatment chemicals in municipal applications is to purify municipal water for residential use and to treat wastewater for sludge dewatering in sewage treatment plants. The demand for these chemicals is consistent due to the vast volume of water treated. The primary objective of water treatment is to eliminate impurities and render the water suitable for basic uses. The market for water treatment chemicals in municipal applications is poised for growth due to the escalating demand for clean and potable water.
Saline water treatment is another significant application of water treatment chemicals, particularly in regions with limited freshwater resources. The petrochemical industry also utilizes these chemicals extensively for water requirements in their operations. The increasing water demand, driven by population growth and industrialization, is a major factor fueling the growth of the water treatment chemicals market. Desalination technology, which converts seawater into potable water, is an emerging application for water treatment chemicals. The technology's adoption is increasing in regions with scarce freshwater resources, providing a lucrative opportunity for market growth. The water treatment chemicals market is expected to expand further as the world grapples with the challenges of increasing water demand and the need for sustainable water management solutions.
Get a glance at the market share of various segments Request Free Sample
The municipality segment was valued at USD 124.20 million in 2018 and showed a gradual increase during the forecast period.
Market Dynamics
Our researchers analyzed the data with 2023 as the base year, along with the key drivers, trends, and challenges. A holistic analysis of drivers will help companies refine their marketing strategies to gain a competitive advantage.
What are the key market drivers leading to the rise in adoption of Australia Water Treatment Chemicals Market?
Increasing demand for water treatment chemicals from end-users is the key driver of the market.
- In today's world, freshwater resources comprise only a small percentage of the total water available, making the efficient use and recycling of water essential for various industries and household needs. In many regions of Australia, such as those relying on surface water from reservoirs for municipal water supply, water scarcity becomes a significant concern during droughts. Groundwater accounts for a smaller portion of the water supply in these areas. To address the growing disparity between water demand and supply, water treatment chemicals are increasingly being used to recycle wastewater for various end-user industries, including power generation, oil and gas, mining, and chemicals. The need for clean water for domestic, agricultural, and industrial use has significantly increased in Australia due to the expansion of industrial activities. Power generation is a significant consumer of water, and the power industry's water usage is projected to increase due to the growing demand for electricity.
- Additionally, water treatment chemicals play a crucial role in ensuring the efficient and effective use of water in power generation. In the agricultural sector, water treatment chemicals help in maintaining the quality of irrigation water, ensuring optimal crop growth. The demand for clean water for drinking and cooking purposes is also on the rise, and water treatment chemicals are essential in ensuring the safety and quality of drinking water. The use of water treatment chemicals is not only limited to industrial applications but is also becoming increasingly common in residential areas to ensure the availability of clean and safe water for daily use. Thus, the efficient use and recycling of water are becoming crucial for various industries and household needs. Water treatment chemicals play a vital role in ensuring the availability and quality of water for various applications, including power generation, agriculture, and domestic use. The increasing demand for clean water in Australia and other regions necessitates the continued development and use of advanced water treatment technologies and chemicals.
What are the market trends shaping the Australia Water Treatment Chemicals Market?
The use of analytics to drive efficiency is the upcoming trend in the market.
- Water treatment plants, including municipal and industrial varieties, generate substantial data from various processes and operations. This data, which includes information on energy and chemical consumption and equipment performance metrics such as sewer flows and meter readings, can significantly enhance operational efficiency if effectively collected and analyzed. Two primary methods for treating water are physical and chemical.
- Additionally, physical methods involve the use of filters, sedimentation tanks, and membranes to remove impurities, while chemical methods incorporate the addition of substances like coagulants and disinfectants to alter water properties. Industries such as sugar and ethanol production, fertilizer manufacturing, geothermal power generation, and petrochemical manufacturing all rely on water treatment to maintain their processes. The application of water treatment chemicals is essential in these industries to ensure water quality and prevent corrosion, fouling, and scaling.
What challenges does Australia Water Treatment Chemicals Market face during the growth?
Water treatment technologies substitutes are a key challenge affecting the market growth.
- In the realm of industrial water treatment processes, there has been a growing preference for physical methods over the use of chemicals. This shift is driven by environmental concerns and regulatory demands, leading to a decrease in the application of chemicals such as Sodium metabisulfite, Ferric chloride, and Sodium Hexametaphosphate. Instead, innovative water treatment technologies like UV disinfection and Reverse Osmosis (RO) filtration are gaining traction.
- Additionally, Australian water treatment companies are prioritizing research and development in membrane technology, with nano-engineered composite membranes being a recent breakthrough. This new membrane technology offers enhanced filtration capabilities, reducing the need for chemical treatment systems. The future of water treatment in Australia lies in sustainable solutions that minimize the use of chemicals while maintaining effective water treatment processes.
Exclusive Australia Water Treatment Chemicals Market Customer Landscape
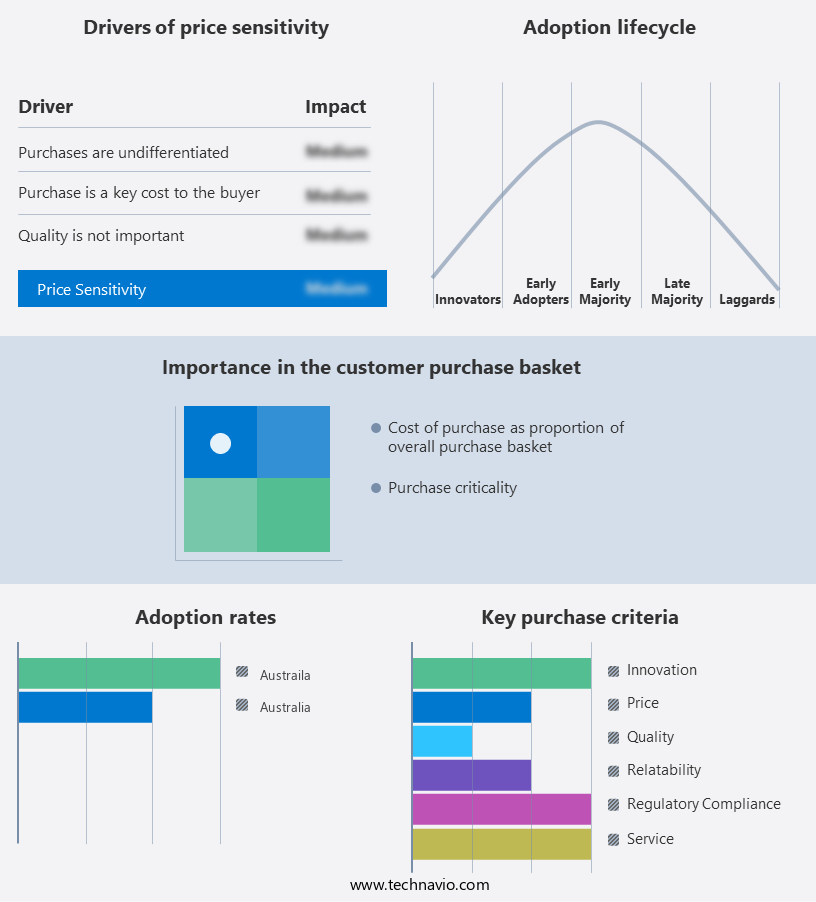
The market forecasting report includes the adoption lifecycle of the market, covering from the innovator's stage to the laggard's stage. It focuses on adoption rates in different regions based on penetration. Furthermore, the report also includes key purchase criteria and drivers of price sensitivity to help companies evaluate and develop their market growth analysis strategies.
Customer Landscape
Key Companies & Market Insights
Companies are implementing various strategies, such as strategic alliances, market forecast partnerships, mergers and acquisitions, geographical expansion, and product/service launches, to enhance their presence in the market. The market research and growth report includes detailed analyses of the competitive landscape of the market and information about key companies, including:
- Accepta Ltd
- Albemarle Corp.
- Aquasol
- Buckman Laboratories lnternational Inc.
- Challenge Chemicals
- Chemdrex Chemicals
- Coogee
- Dow Inc.
- Ecolab Inc.
- Italmatch Chemicals Spa
- Kemira Oyj
- Lonza Group Ltd.
- SNF Group
- Solenis
- Veolia Environnement SA
Qualitative and quantitative analysis of companies has been conducted to help clients understand the wider business environment as well as the strengths and weaknesses of key market players. Data is qualitatively analyzed to categorize companies as pure play, category-focused, industry-focused, and diversified; it is quantitatively analyzed to categorize companies as dominant, leading, strong, tentative, and weak.
Research Analyst Overview
The water treatment chemicals market is experiencing significant growth due to the increasing demand for treated water across various sectors. Power generation is a major consumer of treated water, with thermal, hydro, nuclear, and geothermal power plants relying on water treatment chemicals to ensure the efficient operation of their plants. In addition, the demand for treated water in industries such as petrochemical manufacturing, refining, and fertilizer production is on the rise. The water treatment process involves both physical and chemical methods. Physical methods include filtration, sedimentation, and membrane separation, while chemical methods utilize chemicals such as sodium metabasulfite, ferric chloride, and sodium hexametaphosphate to remove impurities and disinfect the water.
Additionally, treated water is essential for various applications, including drinking, cooking, irrigation, and industrial processes. The emerging economies are witnessing a growth in demand for treated water due to the growing population and increasing industrialization. Centralized facilities and fluid treatment units are common methods for treating large volumes of water, while small-scale manufacturers rely on in-situ processes for treating water on-site. Zero discharge and saline water treatment are emerging trends in the water treatment chemicals market. Desalination technology is also gaining popularity in regions with scarce water resources. The water requirements of the energy business, including power generation and desalination, are driving the demand for water treatment chemicals. The sugar and ethanol industry, as well as the petrochemical industry, are other significant consumers of water treatment chemicals.
|
Market Scope |
|
|
Report Coverage |
Details |
|
Page number |
145 |
|
Base year |
2023 |
|
Historic period |
2018-2022 |
|
Forecast period |
2024-2028 |
|
Growth momentum & CAGR |
Accelerate at a CAGR of 3.5% |
|
Market growth 2024-2028 |
USD 66.1 million |
|
Market structure |
Fragmented |
|
YoY growth 2023-2024(%) |
3.3 |
|
Competitive landscape |
Leading Companies, Market Positioning of Companies, Competitive Strategies, and Industry Risks |
What are the Key Data Covered in this Market Research Report?
- CAGR of the market during the forecast period
- Detailed information on factors that will drive the market growth and forecasting between 2024 and 2028
- Precise estimation of the size of the market and its contribution of the market in focus to the parent market
- Accurate predictions about upcoming market growth and trends and changes in consumer behaviour
- Growth of the market across Australia
- Thorough analysis of the market's competitive landscape and detailed information about companies
- Comprehensive analysis of factors that will challenge the growth of market companies
We can help! Our analysts can customize this market research report to meet your requirements Get in touch
 RIA -
RIA - 
