
Projector Screen Market Size 2025-2029
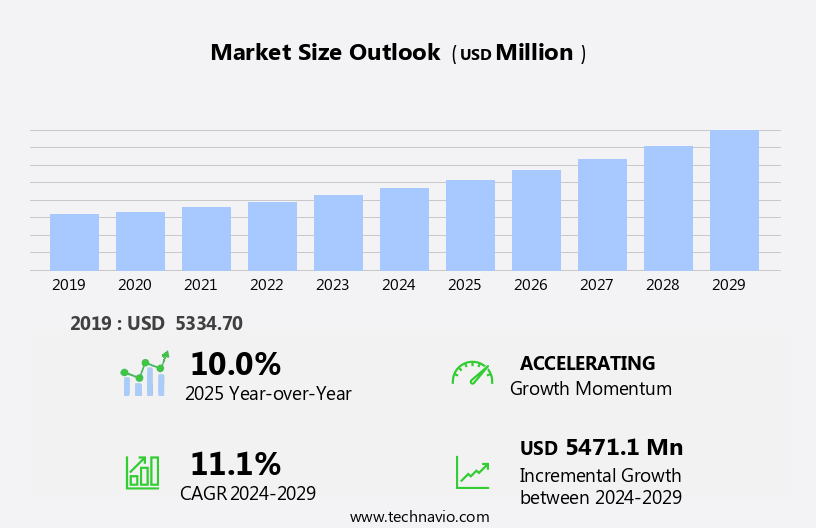
The projector screen market size is forecast to increase by USD 5.47 billion, at a CAGR of 11.1% between 2024 and 2029.
- The market is characterized by dynamic growth, driven by continuous product innovation and advances leading to portfolio extension and product premiumization. Manufacturers are focusing on developing screens with advanced features such as motorized screens, ambient light rejection, and 3D capabilities to cater to evolving consumer preferences. Simultaneously, there is a growing emphasis on organic growth, with companies exploring opportunities in untapped markets and expanding their distribution networks. However, intense competition in the market poses significant challenges. The industry is witnessing price wars, which puts pressure on profit margins and forces companies to adopt aggressive pricing strategies.
- Additionally, the market is highly fragmented, with numerous players vying for market share. To navigate these challenges, companies must focus on differentiating their offerings through superior quality, innovative features, and effective marketing strategies. By staying abreast of the latest trends and consumer preferences, they can capitalize on opportunities and maintain a competitive edge in the market.
What will be the Size of the Projector Screen Market during the forecast period?
Explore in-depth regional segment analysis with market size data - historical 2019-2023 and forecasts 2025-2029 - in the full report.
Request Free Sample
The market continues to evolve, with dynamic market activities unfolding across various sectors. Fixed frame screens remain a popular choice for home theater applications, offering high-definition (HD) viewing experiences with 4k resolution and improved color accuracy. However, the emergence of interactive screens and touchscreen projectors is revolutionizing the way we engage with digital content. Rear projection screens, once a staple in commercial installations, are being replaced by front projection screens with better image distortion correction and higher contrast ratios. Projection bulbs are evolving to support 4k resolution and HDR compatibility, while screen cleaning solutions ensure optimal visual performance.
Throw ratio, ambient light rejection, and screen size are critical factors in selecting the right projector screen for different applications. Commercial installations require robust mounting hardware and wireless connectivity, while home theater setups prioritize viewing angle and black level. Screen masking, edge blending, and projection mapping are innovative technologies that enhance the visual experience in various settings, from corporate presentations and event venues to digital signage and video conferencing. The market's continuous evolution is driven by advancements in projection technology, screen material, and screen resolution, among other factors. Screen cleaning and maintenance remain essential to ensure optimal performance and longevity.
Motorized and retractable screens offer convenience and flexibility, while manual screens cater to budget-conscious consumers. The market's ongoing dynamism reflects the evolving needs of consumers and businesses across industries.
How is this Projector Screen Industry segmented?
The projector screen industry research report provides comprehensive data (region-wise segment analysis), with forecasts and estimates in "USD million" for the period 2025-2029, as well as historical data from 2019-2023 for the following segments.
- Application
- Professional
- Personal
- Type
- Wall and ceiling
- Ceiling recessed
- Floor rising
- Portable
- Others
- Geography
- North America
- US
- Canada
- Europe
- France
- Germany
- Italy
- UK
- APAC
- China
- India
- Japan
- South America
- Brazil
- Rest of World (ROW)
- North America
By Application Insights
The professional segment is estimated to witness significant growth during the forecast period.
The market is witnessing significant advancements, with key trends including the integration of interactive capabilities. Interactive projectors, such as those offered by Epson, are gaining popularity, particularly in educational settings. These projectors transform walls into interactive whiteboards, enabling multi-touch functionality for enhanced collaboration and engagement. Supporting up to 5-8 touch points, these projectors allow multiple students to interact with content simultaneously, fostering a more dynamic and collaborative learning environment. Interactive projectors also contribute to improved knowledge retention due to their superior engagement properties. Additionally, the market is seeing the adoption of high-definition and ultra-high definition resolutions, such as 4k and 8k, for crisp and clear visuals.
Wall mounts, floor stands, and ceiling mounts cater to various installation preferences, while repair services ensure uninterrupted usage. Edge blending and screen masking technologies address image distortion issues, and frame rates and refresh rates optimize motion clarity. Projection technology, including front and rear projection, caters to diverse application needs. Mounting hardware, control systems, and wireless connectivity facilitate ease of use, while screen cleaning solutions ensure long-term maintenance. Digital signage and projection mapping expand the market's reach into event venues and commercial installations. Motorized and fixed frame screens cater to different user preferences, and contrast ratios ensure optimal image quality. Repair services address potential issues with projection bulbs and screen materials, while ambient light rejection and screen gain enhance viewing quality.
Smart screens and touchscreen projectors add a layer of interactivity, further engaging users. Frame materials, aspect ratios, and throw ratios cater to various application requirements. Overall, the market is evolving to meet the demands of diverse industries and applications, offering advanced features and solutions.
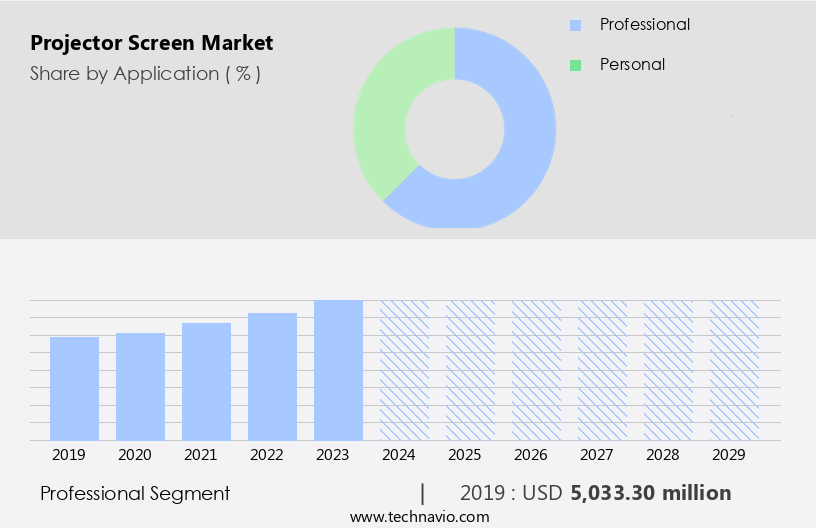
The Professional segment was valued at USD 5.03 billion in 2019 and showed a gradual increase during the forecast period.
Regional Analysis
APAC is estimated to contribute 46% to the growth of the global market during the forecast period.Technavio's analysts have elaborately explained the regional trends and drivers that shape the market during the forecast period.
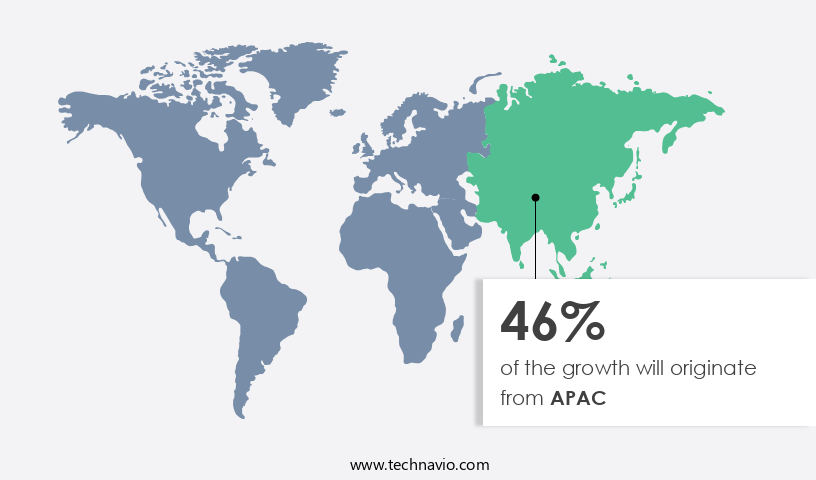
The market in APAC is experiencing significant growth, with China, Japan, and India leading the way. The expansion of the service sector and increasing literacy rates are driving sales, as more office spaces, startups, and multinational companies emerge. Japan, Australia, and South Korea, with their mature technology adoption rates, have a well-established end-user base across various industries. Emerging economies like Vietnam, Indonesia, China, and India are also expected to fuel market growth due to the need for operational efficiency in business operations. Projector screens are increasingly being adopted for corporate presentations, video conferencing, and digital signage.
Installation services, wall mounts, and floor stands facilitate easy setup and usage. Manual screens, retractable cases, and motorized screens cater to diverse user preferences. Refresh rates, frame rates, and screen resolution ensure smooth visuals, while edge blending and screen masking enhance image quality. Projection technology, screen material, and ambient light rejection contribute to optimal viewing experiences. Screen sizes, aspect ratios, and throw ratios cater to various application requirements. Ultra-high definition (UHD) and high-definition (HD) screens offer superior image clarity. Input lag, screen gain, and contrast ratio are essential considerations for specific applications. Repair services ensure longevity, and screen cleaning maintains screen health.
Interactive screens, rear projection screens, and touchscreen projectors offer innovative solutions. Projection mapping and hdr compatibility add a new dimension to visual experiences, making them ideal for event venues and front projection screens. Keystone correction and ceiling mounts ensure proper alignment. Wireless connectivity and remote control add convenience. Commercial installations benefit from screen cleaning and screen masking solutions. Home theater setups prioritize viewing angle, black level, and color accuracy. In conclusion, the market in APAC is thriving, driven by the service sector's expansion and increasing literacy rates. The growing need for operational efficiency and advanced visual experiences across various industries fuels market growth.
Innovative technologies, diverse product offerings, and reliable repair and installation services cater to the evolving needs of businesses and consumers.
Market Dynamics
Our researchers analyzed the data with 2024 as the base year, along with the key drivers, trends, and challenges. A holistic analysis of drivers will help companies refine their marketing strategies to gain a competitive advantage.
The market caters to the demand for large, high-definition displays for both residential and commercial applications. Projector screens come in various sizes and materials, including fixed, retractable, manual, and electric models. Popular screen materials include matte white, gain, and high contrast screens, designed to optimize image quality for different lighting conditions. The market also offers 3D-capable screens and motorized models with adjustable tilt and focus. Projector screens are compatible with various projector resolutions, including 1080p, 4K, and 8K. Additionally, screens with ambient light rejecting (ALR) and short-throw capabilities are gaining popularity. The market continues to evolve, offering innovative solutions for home theaters, classrooms, conference rooms, and outdoor events.
What are the key market drivers leading to the rise in the adoption of Projector Screen Industry?
- Product innovation and advances, which include the development of new offerings and the enhancement of existing ones, are the primary catalysts for portfolio extension and product premiumization in the market.
- The market has experienced significant competition and innovation in recent years. Driven by technological advancements, customer preferences have shifted, necessitating continuous research and development from market participants. companies in the projector screen industry are expanding their product offerings to cater to evolving consumer demands. Notable innovations include improvements in projection technology, screen resolution, and refresh rates, such as 8k resolution and high frame rates. Additionally, features like edge blending, retractable cases, wall mounts, and floor stands have gained popularity. Repair services are also essential to ensure the longevity of these screens, particularly for outdoor models.
- Aspect ratios and screen sizes continue to vary, catering to diverse applications and user needs. Overall, the market is dynamic and competitive, with companies focusing on delivering high-quality, innovative products to meet the evolving demands of customers.
What are the market trends shaping the Projector Screen Industry?
- Organic growth is gaining increasing importance in market trends. It is a professional and knowledgeable approach to business development, focusing on natural expansion through customer engagement and high-quality offerings.
- The market is experiencing organic growth due to the continuous introduction of innovative products. companies are launching new projector screens, both in traditional and online formats, to cater to diverse business needs. One recent example is dnp Denmark's release of the new dnp Supernova XL screen. This latest version boasts a 20% reduction in installation time and a 25% decrease in weight, making it easier to install and less taxing on walls. Additionally, dnp Denmark introduced the 80 dnp Clear Sign optical projector screens, designed for advertising and digital signage applications. These screens prioritize image quality with high screen gain, ambient light rejection, and color accuracy.
- Furthermore, advanced features like mounting hardware, control systems, and smart screens enhance user experience. Projector screens made of screen fabric and frame materials offer excellent image quality and durability for corporate presentations. Ultra-high definition (UHD) screens provide immersive visuals for large audiences. Remote control functionality adds convenience and flexibility. These product innovations underscore the market's dynamic nature and commitment to meeting the evolving demands of businesses.
What challenges does the Projector Screen Industry face during its growth?
- The intense competition prevalent in the industry can lead to price wars, thereby significantly reducing profit margins and posing a significant challenge to industry growth.
- The market is characterized by intense competition among manufacturers, who distribute their products through organized and unorganized channels. Key competitive factors include product portfolio, premiumization, differentiation, and pricing. New companies and private-label brands are entering the market, leading to price wars that may compromise product quality and hinder market growth. Multichannel retailers, such as Walmart, with lower cost structures, further intensify competition. Online sales are on the rise due to increasing Internet penetration and the use of digital devices. Despite these challenges, the market offers opportunities for innovation, particularly in areas like screen masking, 4k resolution, and interactive screens. Rear projection screens and high-definition (HD) screens continue to be popular choices for commercial installations.
- Viewing angle and throw ratio are critical considerations for businesses seeking large-format screens. Proper screen cleaning is essential for maintaining image clarity and longevity. In the home theater market, consumers prioritize immersive, harmonious experiences with minimal image distortion and excellent black level.
Exclusive Customer Landscape
The projector screen market forecasting report includes the adoption lifecycle of the market, covering from the innovator's stage to the laggard's stage. It focuses on adoption rates in different regions based on penetration. Furthermore, the projector screen market report also includes key purchase criteria and drivers of price sensitivity to help companies evaluate and develop their market growth analysis strategies.
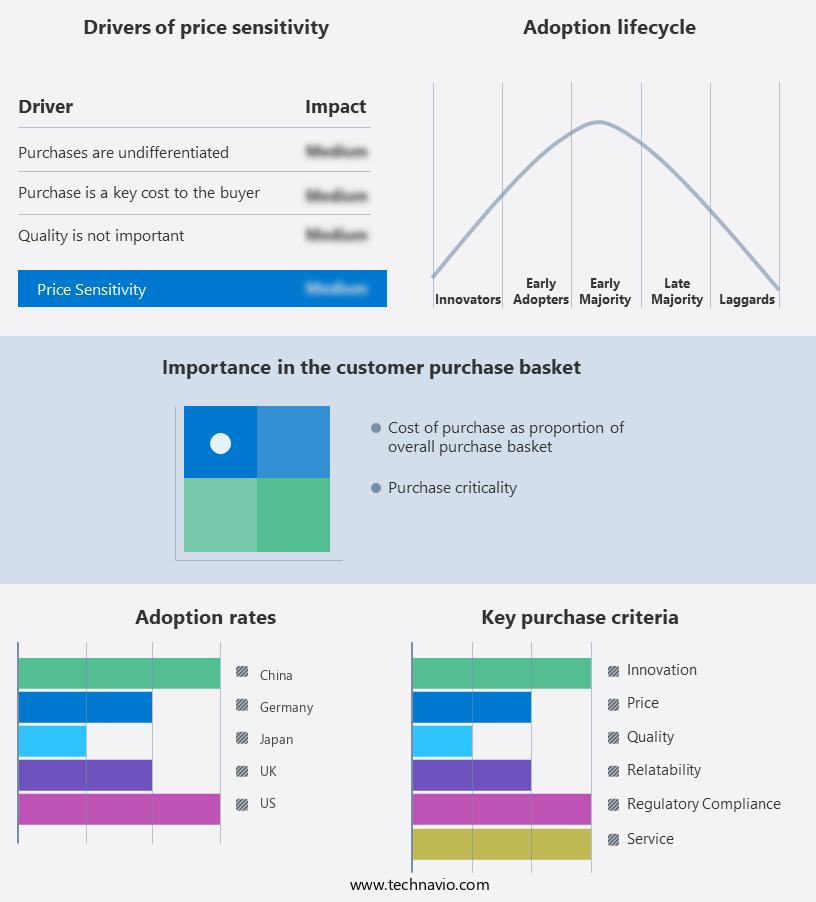
Customer Landscape
Key Companies & Market Insights
Companies are implementing various strategies, such as strategic alliances, projector screen market forecast, partnerships, mergers and acquisitions, geographical expansion, and product/service launches, to enhance their presence in the industry.
ACCO Brands Corp. - The Nobo brand, under our company, provides a range of projector screens in varying specifications and sizes. Our offerings cater to diverse user needs, enhancing visual experiences for presentations and home theaters. Nobo screens deliver superior image quality and durability, ensuring optimal performance and versatility.
The industry research and growth report includes detailed analyses of the competitive landscape of the market and information about key companies, including:
- ACCO Brands Corp.
- Barco NV
- dnp Visiosign A/S
- Draper Inc.
- Elite Screens Inc
- Glimm Screens BV
- Grandview Crystal Screen Co. Ltd.
- Groupe Adeo
- Harkness Screens International Ltd
- Legrand
- Pioneer Audio Visual Equipment
- Pyle USA Sound Around Inc
- Remaco Technologies Pte Ltd.
- Screen Innovations
- Seiko Epson Corp.
- Severtson Screens
- Silver Ticket Products
- Stewart Filmscreen
- Swastik Telon
- Vutec Corp
Qualitative and quantitative analysis of companies has been conducted to help clients understand the wider business environment as well as the strengths and weaknesses of key industry players. Data is qualitatively analyzed to categorize companies as pure play, category-focused, industry-focused, and diversified; it is quantitatively analyzed to categorize companies as dominant, leading, strong, tentative, and weak.
Recent Development and News in Projector Screen Market
- In January 2024, LG Display and Sony announced a strategic partnership to co-develop and manufacture large-format projector screens using OLED technology. This collaboration aimed to address the growing demand for high-quality, large-screen displays in various industries, including education, healthcare, and entertainment (LG Display Press Release, 2024).
- In March 2024, ViewSonic, a leading projector manufacturer, launched its X10-WXGA 3LCD projector, which boasted a record-breaking brightness of 15,000 lumens. This innovative product catered to the increasing need for high-brightness projectors in large venues and outdoor settings (ViewSonic Press Release, 2024).
- In May 2024, Barco, a global technology company specializing in visualization solutions, acquired Screenex, a leading manufacturer of projection screens. This strategic move strengthened Barco's position in the market and expanded its product portfolio, enabling it to cater to a broader customer base (Barco Press Release, 2024).
- In April 2025, the European Union introduced new regulations mandating the use of energy-efficient projector screens in all public and commercial buildings. This initiative aimed to reduce energy consumption and carbon emissions, driving demand for eco-friendly projector screen solutions (European Commission Press Release, 2025).
Research Analyst Overview
- The market experiences dynamic shifts as profit margins remain competitive, driven by safety regulations and material sourcing considerations. Brands prioritize reputation management through compliance with industry standards and ensuring acoustic transparency. Distribution channels expand, with online sales gaining traction, while energy consumption remains a critical factor in product innovation. Emerging trends include screen features such as black level uniformity, light diffusion, and screen surface texture. Price comparison and warranty claims influence consumer decision-making, while sales volume and repair cost impact the bottom line.
- User reviews and maintenance frequency shape brand reputation, with screen lifespan and image sharpness key product features. Environmental impact and industry standards guide manufacturing processes, and screen durability and setup time are essential for competitor analysis. Screen curvature, color temperature, and screen reflectivity further differentiate offerings. Supply chain complexities and installation complexity continue to shape market trends.
Dive into Technavio's robust research methodology, blending expert interviews, extensive data synthesis, and validated models for unparalleled Projector Screen Market insights. See full methodology.
|
Market Scope |
|
|
Report Coverage |
Details |
|
Page number |
202 |
|
Base year |
2024 |
|
Historic period |
2019-2023 |
|
Forecast period |
2025-2029 |
|
Growth momentum & CAGR |
Accelerate at a CAGR of 11.1% |
|
Market growth 2025-2029 |
USD 5471.1 million |
|
Market structure |
Fragmented |
|
YoY growth 2024-2025(%) |
10.0 |
|
Key countries |
US, Canada, UK, China, Japan, Germany, France, India, Italy, and Brazil |
|
Competitive landscape |
Leading Companies, Market Positioning of Companies, Competitive Strategies, and Industry Risks |
What are the Key Data Covered in this Projector Screen Market Research and Growth Report?
- CAGR of the Projector Screen industry during the forecast period
- Detailed information on factors that will drive the growth and forecasting between 2025 and 2029
- Precise estimation of the size of the market and its contribution of the industry in focus to the parent market
- Accurate predictions about upcoming growth and trends and changes in consumer behaviour
- Growth of the market across APAC, Europe, North America, South America, and Middle East and Africa
- Thorough analysis of the market's competitive landscape and detailed information about companies
- Comprehensive analysis of factors that will challenge the projector screen market growth of industry companies
We can help! Our analysts can customize this projector screen market research report to meet your requirements.
 RIA -
RIA - 
