Proppants Market Size 2025-2029
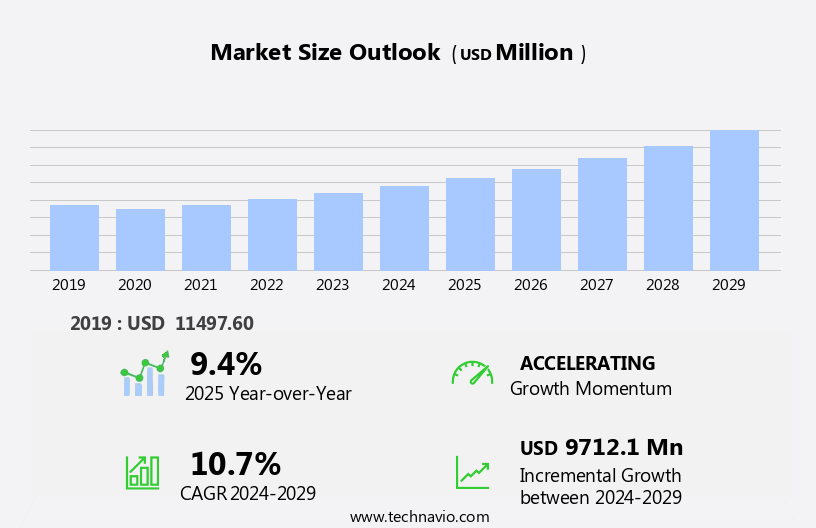
The proppants market size is forecast to increase by USD 9.71 billion at a CAGR of 10.7% between 2024 and 2029.
- The market is experiencing significant growth, driven primarily by the increasing demand for fine mesh raw frac sand in the hydraulic fracturing process. This demand stems from the continued expansion of shale gas and oil exploration and production activities. Technological developments in hydraulic fracturing processes have led to increased efficiency and productivity, further fueling the market's growth. However, regulatory hurdles impact adoption, as stringent environmental regulations necessitate the use of alternative, less environmentally damaging proppants. Additionally, supply chain inconsistencies temper growth potential due to the geographically dispersed nature of sand mines and the logistical challenges associated with transporting large volumes of sand to drilling sites. Proppant innovation trends include well stimulation techniques, such as enhanced oil recovery, and the integration of proppant recycling and carbon capture into operations.
- The market's strategic landscape is further shaped by the increasing dependency on renewable energy sources, which may reduce the demand for proppants in traditional fossil fuel extraction. Companies seeking to capitalize on market opportunities must navigate these challenges effectively, focusing on innovation, sustainability, and operational efficiency.
What will be the Size of the Proppants Market during the forecast period?
- The proppants market is experiencing significant activity and trends as industry players focus on optimizing hydraulic fracturing processes and enhancing energy efficiency. Proppant market research indicates that well productivity and proppant selection criteria are crucial factors in achieving successful well stimulation. Proppant treatment and proppant disposal are also topics of concern, with a growing emphasis on reducing environmental considerations and promoting sustainability. Green energy and renewable resources are influencing the proppant industry, with opportunities for proppant recycling and carbon capture. Proppant industry news highlights advancements in proppant technology, such as proppant additives and proppant modeling software, which aim to improve proppant performance evaluation and fracture modeling.
- The regulatory landscape is evolving, with increased scrutiny on the proppant industry's impact on the environment. Production forecasting and reservoir simulation are essential tools for proppant industry players to navigate market trends and identify opportunities. Proppant innovation trends include well stimulation techniques, such as enhanced oil recovery, and the integration of proppant recycling and carbon capture into operations. Proppant life cycle assessment and energy efficiency are critical considerations for proppant industry players seeking to minimize their environmental footprint and reduce costs. Proppant industry challenges include managing proppant disposal and addressing the regulatory landscape while continuing to optimize hydraulic fracturing processes.
- Overall, the proppant market is dynamic and evolving, with a focus on innovation, sustainability, and regulatory compliance. Proppant market analysis is essential for industry players to stay informed and competitive in this ever-changing landscape.
How is this Proppants Industry segmented?
The proppants industry research report provides comprehensive data (region-wise segment analysis), with forecasts and estimates in "USD million" for the period 2025-2029, as well as historical data from 2019-2023 for the following segments.
- Product Type
- Frac sand
- Ceramic proppants
- Resin coated proppants
- Application
- Shale gas
- Coal bed methane
- Tight gas
- Others
- Form Factor
- Medium mesh
- Fine mesh
- Coarse mesh
- Geography
- North America
- US
- Canada
- Europe
- France
- Germany
- Italy
- UK
- APAC
- China
- India
- Japan
- South Korea
- Rest of World (ROW)
- North America
By Product Type Insights
The frac sand segment is estimated to witness significant growth during the forecast period.
The market encompasses a range of materials used to enhance hydrocarbon recovery from unconventional reservoirs, primarily through hydraulic fracturing. Ceramic proppants, a significant segment, undergo rigorous research for optimization in terms of conductivity, crush resistance, and shape. Proppant manufacturing processes include coating with resins or other materials for improved performance. Proppant testing and analysis are crucial for understanding efficiency and cost-effectiveness. Proppant supply chain intricacies involve transportation, handling, and storage, ensuring timely delivery to well sites. Proppant pricing dynamics are influenced by factors such as production optimization, demand from tight formations, and environmental impact. Sand proppant, a naturally occurring material, holds a substantial market share due to its high hardness and spherical shape, enhancing hydrocarbon flow in hydrocarbon reservoirs.
Proppant technology continues to evolve, with innovation in proppant design, proppant modeling, and proppant simulation. Proppant pack density plays a critical role in production enhancement, with proppant performance directly impacting energy production. Proppant competition is fierce, with various players offering different types and grades to cater to the diverse needs of the industry. In the context of energy production, proppant plays a vital role in well completion and stimulation, enabling the extraction of shale gas and shale oil from unconventional reservoirs. Proppant placement is a crucial aspect of well completion, ensuring efficient proppant distribution within the reservoir. Proppant efficiency, a key performance indicator, is continually assessed to optimize production and reduce costs.
The market is a dynamic and essential component of the hydrocarbon industry, with various entities interconnected in the proppant supply chain. From research and development to manufacturing, transportation, and application, the market is driven by the need to maximize hydrocarbon recovery while minimizing costs and environmental impact.
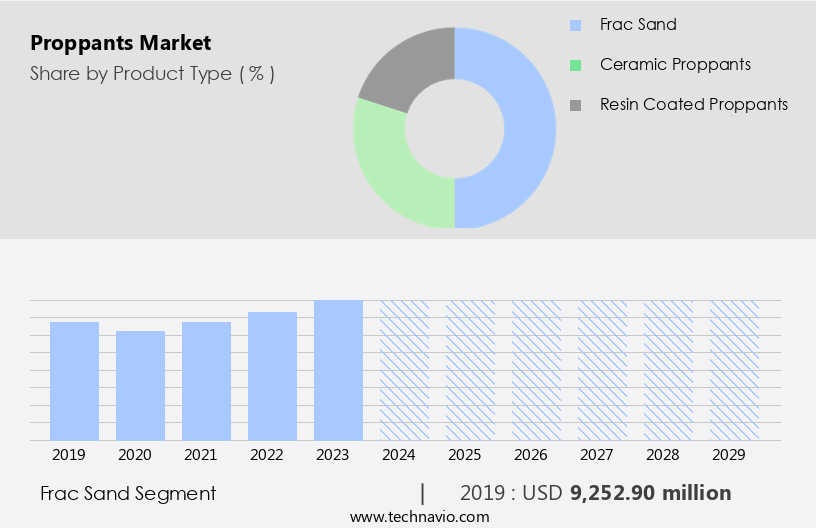
The Frac sand segment was valued at USD 9.25 billion in 2019 and showed a gradual increase during the forecast period.
Regional Analysis
North America is estimated to contribute 67% to the growth of the global market during the forecast period. Technavio's analysts have elaborately explained the regional trends and drivers that shape the market during the forecast period.
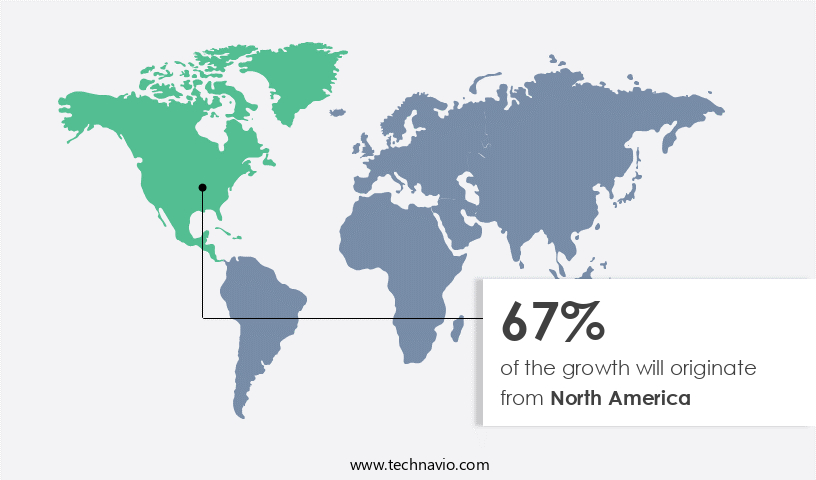
The North American market is experiencing substantial growth due to the region's extensive use of proppants, particularly in unconventional hydrocarbon recovery. Unconventional reservoirs, such as shale formations, are primarily targeted through hydraulic fracturing, a technique that relies on proppants for well completion and production enhancement. The US, as a significant producer of shale gas and oil, holds over 170 billion barrels of technically recoverable shale oil resources and over 1,600 tcf of technically recoverable shale and tight natural gas. The proppant supply chain plays a crucial role in this process, ensuring the availability of various types, including ceramic, sand, and coated proppants.
Proppant research and development continue to focus on improving proppant conductivity, efficiency, and strength for optimal performance in harsh reservoir conditions. Proppant manufacturing, transportation, handling, testing, and blending are essential components of the proppant supply chain. Proppant pricing and competition remain key factors influencing market dynamics, with innovation and technology playing a significant role in proppant design and optimization. Proppant modeling, simulation, and analysis help in understanding the behavior of proppants under various conditions, ensuring production optimization and environmental sustainability. The proppants industry continues to evolve, addressing the unique challenges of unconventional reservoirs and enhancing energy production from tight formations.
Market Dynamics
Our researchers analyzed the data with 2024 as the base year, along with the key drivers, trends, and challenges. A holistic analysis of drivers will help companies refine their marketing strategies to gain a competitive advantage.
What are the Proppants market drivers leading to the rise in the adoption of Industry?
- The increasing demand for fine mesh raw frac sand serves as the primary market driver. The market experiences significant growth due to the increasing utilization of proppants, particularly fine mesh raw frac sand, in hydrocarbon recovery processes. This proppant is economical compared to alternatives like resin-coated sand and ceramics. The market expansion is driven by the rising demand for petroleum products, technological advancements in unconventional reservoir extraction, and the proliferation of shale gas resources, primarily in North America. Proppant research and optimization are essential to enhance proppant conductivity and improve overall efficiency. Proppant supply chain management, including storage, transportation, and testing, plays a crucial role in ensuring the quality and availability of proppants.
- Competition in the proppant industry is intense, with various manufacturers supplying a range of products to meet the diverse needs of customers. Overall, the market is a dynamic and evolving sector that continues to play a vital role in enhancing hydrocarbon recovery.
What are the Proppants market trends shaping the Industry?
- The hydraulic fracturing process is currently undergoing significant technological advancements, making it a prominent trend in the energy market. These innovations aim to enhance efficiency, reduce environmental impact, and lower operational costs. Hydraulic fracturing, a key process in unconventional oil and gas production, is undergoing significant technological advancements. The hydraulic fracturing process now incorporates sensors, software, and real-time pressure data analysis to optimize production and prevent over-fracturing. The integration of IoT for data acquisition and the use of data analytics and machine learning enhance the efficiency of tools used in this process.
- Proppant handling, a crucial aspect of hydraulic fracturing, is also evolving. Coated proppants, such as resin-coated varieties, are gaining popularity due to their improved crush resistance and production enhancement capabilities. Proppant shape and development, along with proppant efficiency analysis, are also subjects of ongoing research to further optimize well completion and maximize output.
How does Proppants market faces challenges during its growth?
- The increasing reliance on renewable energy sources poses a significant challenge to the industry's growth trajectory. This transition necessitates substantial investments in research and development, infrastructure, and policy adjustments to ensure a seamless integration of these sources into existing energy systems. The proppant market is driven by the growing demand for well stimulation in energy production, particularly in shale oil and gas extraction. Proppant placement is a critical process in enhancing the productivity of wells by maintaining the hydraulic fracture and improving reservoir permeability.
- Proppant design and cost are essential factors in the selection process, with sand proppant being the most commonly used due to its high proppant permeability and cost-effectiveness. However, environmental concerns regarding the use of proppant slurry and its potential impact on water resources have gained significant attention. In response, research and development efforts are focused on the design of eco-friendly proppants and the implementation of best practices to minimize environmental impact. Reservoir engineering plays a crucial role in optimizing the use of proppants to maximize energy production while minimizing costs. The proppant market is expected to continue growing due to the increasing demand for energy and the ongoing shift towards sustainable energy sources.
Exclusive Customer Landscape
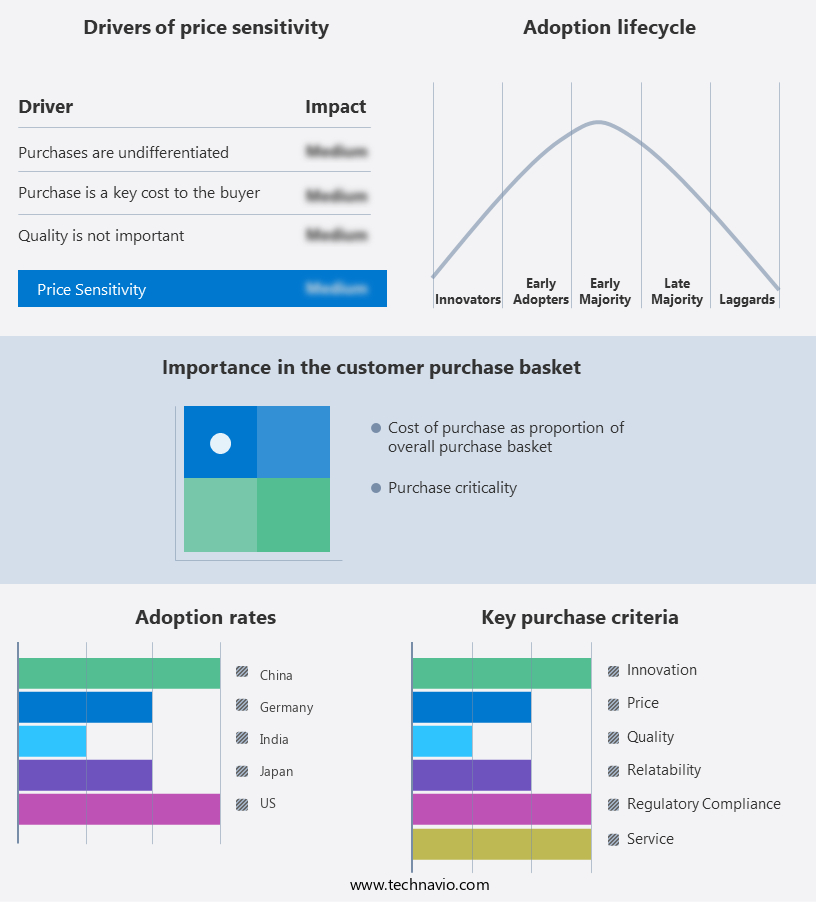
The proppants market forecasting report includes the adoption lifecycle of the market, covering from the innovator's stage to the laggard's stage. It focuses on adoption rates in different regions based on penetration. Furthermore, the proppants market report also includes key purchase criteria and drivers of price sensitivity to help companies evaluate and develop their market growth analysis strategies.
Customer Landscape
Key Companies & Market Insights
Companies are implementing various strategies, such as strategic alliances, proppants market forecast, partnerships, mergers and acquisitions, geographical expansion, and product/service launches, to enhance their presence in the industry.
Atlas Energy Solutions Inc. - The company specializes in providing advanced proppant solutions, featuring high crush resistance and minimal turbidity properties.
The industry research and growth report includes detailed analyses of the competitive landscape of the market and information about key companies, including:
- Atlas Energy Solutions Inc.
- Badger Mining Corp.
- Baker Hughes Co.
- Borovichi Refractories Plant
- CARBO Ceramics Inc.
- ChangQing Proppant Corp.
- Compagnie de Saint Gobain SA
- Covia Holdings LLC
- Curimbaba Group
- Hexion Inc.
- Hi Crush Inc.
- Minerals Technologies Inc.
- Nika PetroTech
- Preferred Proppants LLC
- Rockleigh Industries Inc.
- Schlumberger Ltd.
- SUN Specialty Products
- US Silica Holdings Inc.
- WaterTectonics
- Xinmi Wanli Industry Development Co. Ltd.
Qualitative and quantitative analysis of companies has been conducted to help clients understand the wider business environment as well as the strengths and weaknesses of key industry players. Data is qualitatively analyzed to categorize companies as pure play, category-focused, industry-focused, and diversified; it is quantitatively analyzed to categorize companies as dominant, leading, strong, tentative, and weak.
Recent Development and News in Proppants Market
- In February 2023, Halliburton Company announced the launch of its new proppant, E-Prop, which is engineered to reduce water usage by up to 50% compared to traditional proppants in hydraulic fracturing operations (Halliburton Press Release, 2023). This innovative product development is expected to significantly contribute to the market's sustainability and environmental concerns.
- In May 2024, Schlumberger Limited and National Oilwell Varco formed a strategic partnership to create a joint venture, Proppant Solutions, focusing on the research, development, and production of proppants for the oil and gas industry (Schlumberger Press Release, 2024). This collaboration is expected to strengthen both companies' positions in the market by combining their expertise and resources.
- In October 2024, Carbo Ceramics, a leading proppant manufacturer, secured a USD 150 million investment from Warburg Pincus, a global private equity firm, to support the company's growth initiatives, including the expansion of its production capacity and the development of new proppant technologies (Carbo Ceramics Press Release, 2024). This strategic investment is expected to position Carbo Ceramics as a major player in the market.
Research Analyst Overview
The proppant market continues to evolve, driven by the dynamic nature of hydraulic fracturing and the exploration of unconventional reservoirs for hydrocarbon recovery. Proppant handling and transportation are crucial elements of the proppant supply chain, ensuring the efficient delivery of proppants to well sites. Proppant research and development are ongoing, with a focus on optimizing proppant performance and efficiency in various applications. Coated proppants, such as resin-coated varieties, have gained popularity due to their enhanced crush resistance and improved production optimization. Proppant pricing and cost are significant factors in the market, influencing proppant selection and usage in well completion and production enhancement. This trend is particularly noticeable in the extraction of shale gas and crude oil, where proppants play a crucial role in maximizing production. Technological advancements in the fracking process, such as digital transformation and the use of data analytics, are also contributing to market growth.
Proppant shape, size, and design are also critical considerations for proppant manufacturers, as they impact proppant conductivity, permeability, and pack density. Proppant competition is fierce, with various entities vying for market share. Proppant innovation continues to drive the industry forward, with advancements in proppant technology and modeling enabling more effective proppant placement and well stimulation. Proppant blending and proppant slurry optimization are also areas of focus, as they impact proppant efficiency and overall production. Proppant analysis is essential for reservoir engineering, ensuring the optimal use of proppants in tight formations and shale gas and oil reservoirs. Proppant testing and proppant performance evaluation are ongoing processes, as the industry strives to minimize environmental impact and maximize energy production. The proppant market is a complex and ever-changing landscape, with continuous unfolding of market activities and evolving patterns.
Dive into Technavio's strong research methodology, blending expert interviews, extensive data synthesis, and validated models for unparalleled Proppants Market insights. See full methodology.
|
Market Scope |
|
|
Report Coverage |
Details |
|
Page number |
210 |
|
Base year |
2024 |
|
Historic period |
2019-2023 |
|
Forecast period |
2025-2029 |
|
Growth momentum & CAGR |
Accelerate at a CAGR of 10.7% |
|
Market growth 2025-2029 |
USD 9.71 billion |
|
Market structure |
Fragmented |
|
YoY growth 2024-2025(%) |
9.4 |
|
Key countries |
US, Canada, China, Germany, UK, India, France, Japan, South Korea, and Italy |
|
Competitive landscape |
Leading Companies, Market Positioning of Companies, Competitive Strategies, and Industry Risks |
What are the Key Data Covered in this Proppants Market Research and Growth Report?
- CAGR of the Proppants industry during the forecast period
- Detailed information on factors that will drive the growth and forecasting between 2025 and 2029
- Precise estimation of the size of the market and its contribution of the industry in focus to the parent market
- Accurate predictions about upcoming growth and trends and changes in consumer behaviour
- Growth of the market across North America, Europe, APAC, South America, and Middle East and Africa
- Thorough analysis of the market's competitive landscape and detailed information about companies
- Comprehensive analysis of factors that will challenge the proppants market growth of industry companies
We can help! Our analysts can customize this proppants market research report to meet your requirements.
 RIA -
RIA - 
