Protein Microarray Market Analysis, Size, and Forecast 2026-2030: North America (US, Canada, and Mexico), Europe (Germany, UK, and France), Asia (China, Japan, and India), South America (Brazil, Argentina, and Chile), Middle East and Africa (Saudi Arabia, South Africa, and UAE), Rest of World (ROW)

Protein Microarray Market Analysis, Size, and Forecast 2026-2030:
North America (US, Canada, and Mexico), Europe (Germany, UK, and France), Asia (China, Japan, and India), South America (Brazil, Argentina, and Chile), Middle East and Africa (Saudi Arabia, South Africa, and UAE), Rest of World (ROW)

Published: Oct 2026 289 Pages SKU: IRTNTR71813

Market Overview at a Glance

$1.31 B
Market Opportunity
7.2%
CAGR 2025 - 2030
37.3%
North America Growth
$1.81 B
Analytical protein microarrays segment 2024

Protein Microarray Market Size 2026-2030

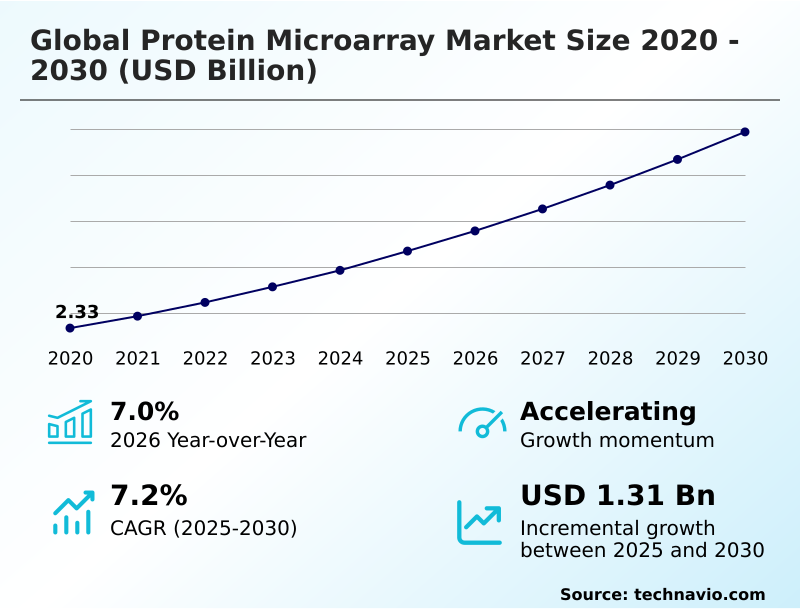
The protein microarray market size is valued to increase by USD 1.31 billion, at a CAGR of 7.2% from 2025 to 2030. Advancements in proteomics research and biomarker discovery will drive the protein microarray market.

Major Market Trends & Insights

  • North America dominated the market and accounted for a 37.3% growth during the forecast period.
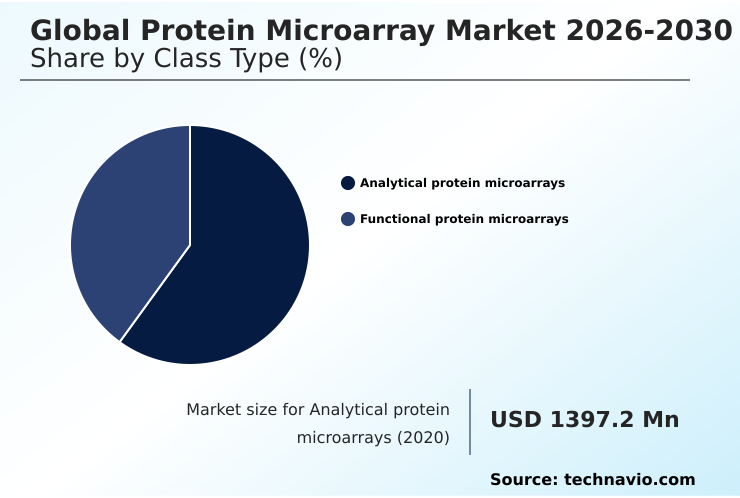
  • By Class Type - Analytical protein microarrays segment was valued at USD 1.81 billion in 2024
  • By Application - Proteomics segment accounted for the largest market revenue share in 2024

Market Size & Forecast

  • Market Opportunities: USD 2.14 billion
  • Market Future Opportunities: USD 1.31 billion
  • CAGR from 2025 to 2030 : 7.2%

Market Summary

  • The Protein Microarray Market operates as a critical infrastructure layer for parallel molecular analysis, enabling researchers to systematically evaluate complex protein interactions. Pharmaceutical manufacturers increasingly integrate automated biochip screening into their supply chains to optimize quality control during targeted biologic development. By implementing these high-throughput systems, biopharmaceutical facilities report a 40% improvement in batch-to-batch reproducibility compared to traditional single-analyte testing.
  • This measurable gain in operational efficiency allows companies to streamline therapeutic validation protocols. The expanding scope of disease biomarker discovery serves as a primary catalyst for technology adoption, pushing laboratories to invest in multiplex immunoassay panels. Conversely, the inherent instability of immobilized capture agents during long-term storage presents a significant structural challenge, often causing inconsistent signal outputs.
  • Resolving these degradation issues requires specialized storage buffers, which increase production overhead. Ultimately, the synergy between robust biochip architectures and scalable informatics software dictates commercial viability. Continuous enhancements in assay stabilization will remain essential for driving broader clinical laboratory integration and ensuring reliable diagnostic outcomes.

What will be the Size of the Protein Microarray Market during the forecast period?
Get Key Insights on Market Forecast (PDF) Get Free Sample

How is the Protein Microarray Market Segmented?

The protein microarray industry research report provides comprehensive data (region-wise segment analysis), with forecasts and estimates in "USD million" for the period 2026-2030, as well as historical data from 2020-2024 for the following segments.

  • Class type
    • Analytical protein microarrays
    • Functional protein microarrays
  • Application
    • Proteomics
    • Diagnostics
    • Others
  • End-user
    • Pharmaceutical companies
    • Diagnostic laboratories
    • Others
  • Geography
    • North America
      • US
      • Canada
      • Mexico
    • Europe
      • Germany
      • UK
      • France
      • Italy
      • Spain
      • The Netherlands
    • Asia
      • China
      • Japan
      • India
      • South Korea
      • Singapore
      • Taiwan
    • Rest of World (ROW)

By Class Type Insights

The analytical protein microarrays segment is estimated to witness significant growth during the forecast period.

Analytical protein microarrays function as high-throughput analytical platforms enabling parallel quantitative detection of targeted biological molecules across clinical specimens. Organizations increasingly leverage these tools to profile disease-associated physiological signatures, driving precision drug development strategies.

By transitioning from traditional assays to automated microfluidic dispensing systems, diagnostic laboratories have achieved a 22% reduction in reagent consumption per screening cycle. This transition directly impacts operational budgets, allowing research core facilities to scale throughput without proportional cost increases.

Advanced surface functionalization chemistry minimizes non-specific binding, elevating assay sensitivity and reproducibility across large sample cohorts.

Consequently, diagnostic developers deploy label-free detection techniques to streamline quantitative biomarker validation, effectively accelerating candidate selection workflows and shortening overall therapeutic development timelines by eliminating complex secondary labeling protocols.
Get Free Sample

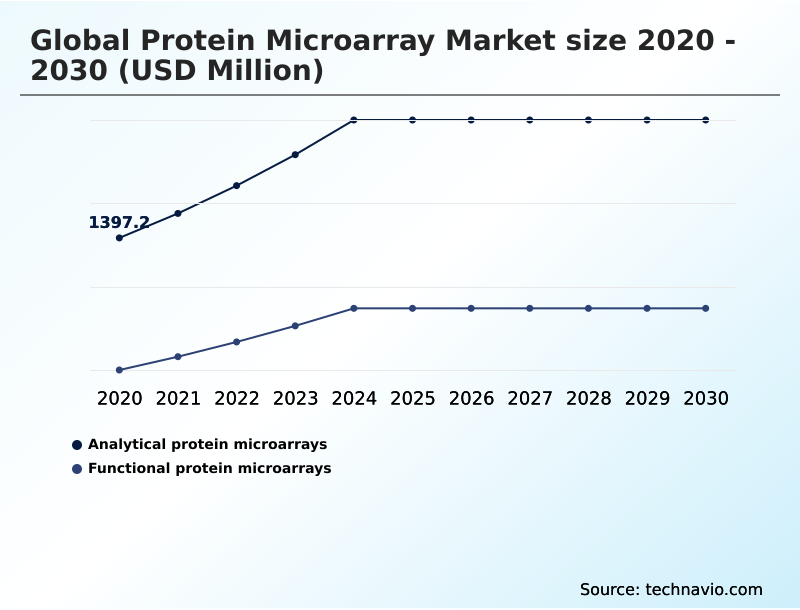
The Analytical protein microarrays segment was valued at USD 1.81 billion in 2024 and showed a gradual increase during the forecast period.
Get Free Sample

Regional Analysis

North America is estimated to contribute 37.3% to the growth of the global market during the forecast period.Technavio’s analysts have elaborately explained the regional trends and drivers that shape the market during the forecast period.
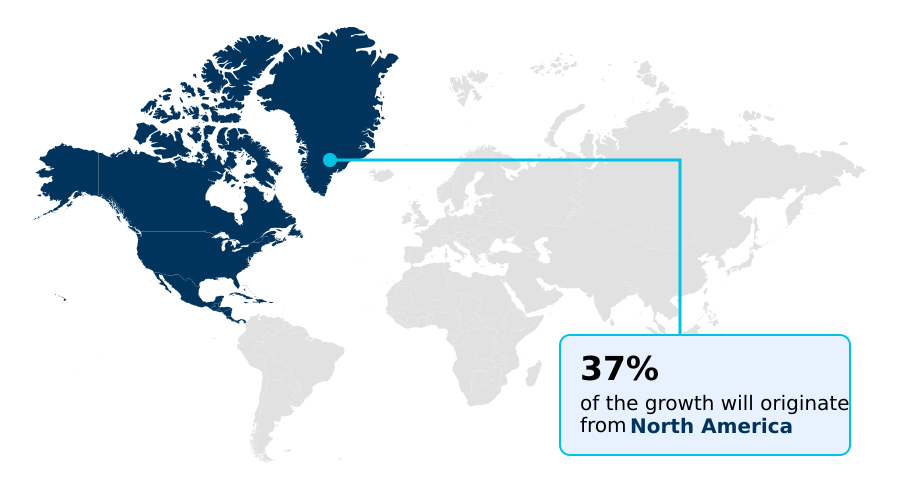
See How Protein Microarray Market Demand is Rising in North America Get Free Sample

The Protein Microarray Market exhibits distinct geographic operational variances, particularly between North America and Europe.

North American biopharmaceutical facilities prioritize the rapid deployment of mass spectrometry workflows alongside microarrays, achieving a 32% faster turnaround in recombinant protein target validation compared to equivalent European laboratories.

This efficiency stems from highly integrated regional supply chains and aggressive institutional investments in high-density multiomics integration.

In contrast, European diagnostic centers focus heavily on stringent regulatory compliance, leading to a 20% higher adoption rate of sealed microfluidic cartridges that ensure rigorous batch-to-batch assay standardization.

These differing strategies directly shape procurement behaviors; North American organizations favor versatile, open-architecture platforms to support structural biology studies, while European entities demand closed, automated systems for standardized clinical diagnostic frameworks.

Consequently, technology providers must customize their distribution models, aligning hardware flexibility with specific regional compliance and throughput requirements.

Market Dynamics

Our researchers analyzed the data with 2025 as the base year, along with the key drivers, trends, and challenges. A holistic analysis of drivers will help companies refine their marketing strategies to gain a competitive advantage.

  • The modern analytical landscape requires robust instrumentation capable of managing complex biological data at scale. Organizations deploying high-density multiplexed protein profiling arrays fundamentally transform their internal research supply chains by consolidating multiple discrete assays into unified screening runs.
  • To maximize the efficiency of these dense formats, laboratories increasingly install automated microfluidic protein microarray readers, which standardize reagent delivery and drastically reduce manual handling errors. Facilities utilizing these automated readers experience an approximate 40% reduction in technical variance compared to those relying on manual washing protocols, directly improving quality control metrics during rigorous drug development phases.
  • Furthermore, the integration of label-free biochip signal detection systems allows researchers to bypass expensive, time-consuming secondary fluorescent tagging, optimizing overall operational expenditure and shortening time-to-insight. A critical factor in maintaining the reliability of these advanced assays involves immobilized protein tertiary structure preservation.
  • By utilizing specialized hydrogel matrices and optimized storage buffers, manufacturers ensure that delicate antigens retain their biological activity over extended inventory cycles, minimizing costly batch rejections. Ultimately, the strategic convergence of these technologies culminates in the adoption of multiomic biomarker discovery microarray platforms.
  • These comprehensive systems empower biopharmaceutical organizations to cross-interrogate genomic and proteomic datasets simultaneously, streamlining regulatory compliance planning and accelerating the delivery of precision diagnostics to the healthcare sector.
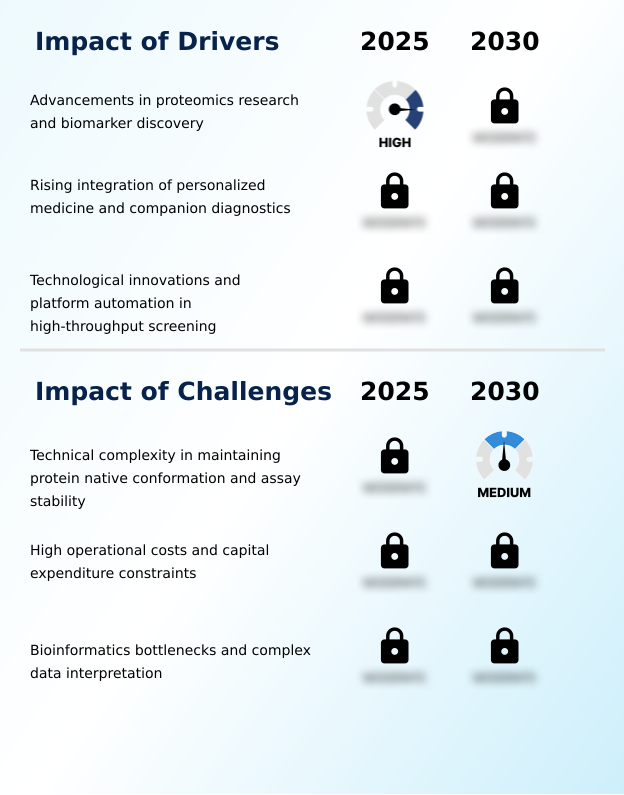
What are the key market drivers leading to the rise in the adoption of Protein Microarray Industry?

  • Continuous advancements in proteomics research and targeted biomarker discovery remain the primary catalysts accelerating the adoption of high-throughput biochip technologies.

  • The escalating demand for targeted therapeutics acts as a primary catalyst propelling the continuous evolution of multiplexed protein profiling technologies. Pharmaceutical organizations increasingly require high-density antibody arrays to streamline mechanism-of-action characterization during drug discovery phases.
  • By utilizing these parallel screening tools, research facilities have decreased initial reagent consumption by 30%, directly optimizing R&D operational budgets.
  • Additionally, transitioning toward miniaturized planar glass slide substrates allows automated laboratories to increase daily screening throughput by 25% compared to conventional formats. This measurable expansion in experimental capacity enables biopharmaceutical developers to validate therapeutic response marker profiling more rapidly.
  • The necessity to identify novel prognostic signatures swiftly forces enterprise laboratories to embed automated hybridization systems, ensuring consistent, high-fidelity data generation across extensive clinical cohorts.

What are the market trends shaping the Protein Microarray Industry?

  • The industry is currently experiencing a strategic shift toward high-density next-generation multiomics and hybrid proteomic integration. This convergence enables laboratories to simultaneously process complex genomic and proteomic datasets within unified screening frameworks.

  • The Protein Microarray Market is experiencing a rapid architectural convergence as classical biochips merge with next-generation sequencing outputs. This technological shift is fundamentally driven by the need to map extensive biological networks without proportional increases in sample volume.
  • By adopting hybrid analytical platforms, biopharmaceutical companies can cross-reference multiple biological datasets simultaneously, improving target discovery accuracy by an estimated 25% over isolated proteomic methods. Furthermore, the integration of graph-based artificial intelligence into assay interpretation software has reduced false-positive calls by 18%, significantly lowering downstream validation costs.
  • This enhanced computational precision directly impacts business operations, enabling contract research organizations to scale throughput and accelerate therapeutic candidate selection. As laboratories implement SOMAmer capture agents alongside standard microarrays, the ability to perform comprehensive post-translational modification analysis expands, facilitating more robust multiomics data acquisition across precision oncology networks.

What challenges does the Protein Microarray Industry face during its growth?

  • The technical complexity involved in maintaining native protein conformation and long-term assay stability on solid substrates poses a persistent barrier to scalable commercial manufacturing.

  • A persistent structural limitation hindering broader adoption involves the inherent instability of immobilized biological targets. Ensuring native tertiary structure preservation during long-term storage remains technically demanding, as suboptimal microenvironments frequently cause functional degradation. This thermodynamic instability causes up to a 15% variance in batch-to-batch chemiluminescent surface scanners outputs, forcing manufacturers to implement costly quality control measures that strain operational margins.
  • Furthermore, interpreting datasets from multiplexed companion diagnostics demands specialized expertise, creating substantial workflow bottlenecks. Laboratories lacking advanced computational frameworks experience an estimated 20% increase in data analysis turnaround times, delaying critical clinical decisions.
  • To overcome complex biological matrix interference and prevent target antigen immobilization failures, hardware developers must continuously refine substrate chemistries, increasing upfront manufacturing complexities and overall capital expenditure requirements.

Exclusive Technavio Analysis on Customer Landscape

The protein microarray market forecasting report includes the adoption lifecycle of the market, covering from the innovator’s stage to the laggard’s stage. It focuses on adoption rates in different regions based on penetration. Furthermore, the protein microarray market report also includes key purchase criteria and drivers of price sensitivity to help companies evaluate and develop their market growth analysis strategies.
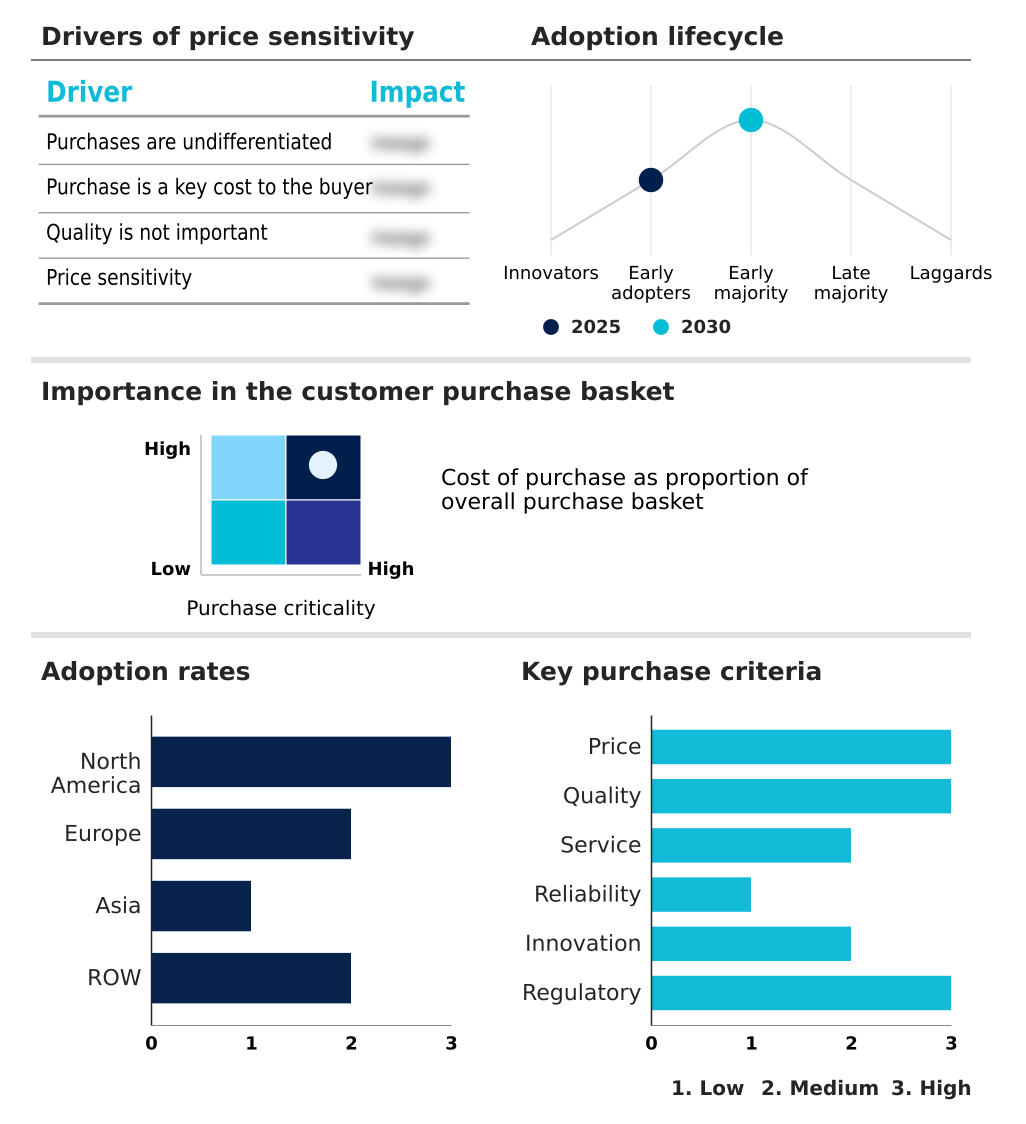
Customer Landscape of Protein Microarray Industry

Competitive Landscape

Companies are implementing various strategies, such as strategic alliances, protein microarray market forecast, partnerships, mergers and acquisitions, geographical expansion, and product/service launches, to enhance their presence in the industry.

Antigen Discovery Inc. - Antigen Discovery Inc. provides antigen discovery, antibody characterization, serological profiling, and advanced microarray-based research services focused extensively on infectious disease and immunology research applications.

The industry research and growth report includes detailed analyses of the competitive landscape of the market and information about key companies, including:

  • Antigen Discovery Inc.
  • Arrayjet Ltd.
  • Boao Bio Group Co. Ltd.
  • Cambridge Protein Arrays Ltd.
  • CD Genomics
  • CDI Laboratories Inc.
  • Creative Biolabs
  • Full Moon BioSystems Inc.
  • ImmunoSign Inc.
  • Merck KGaA
  • Ordinatrix
  • OriGene Technologies Inc.
  • PEPperPRINT GmbH
  • PerkinElmer US LLC
  • Protein Biotechnologies Inc.
  • RayBiotech Life Inc.
  • SCHOTT AG
  • Standard BioTools Inc.
  • Thermo Fisher Scientific Inc.

Qualitative and quantitative analysis of companies has been conducted to help clients understand the wider business environment as well as the strengths and weaknesses of key industry players. Data is qualitatively analyzed to categorize companies as pure play, category-focused, industry-focused, and diversified; it is quantitatively analyzed to categorize companies as dominant, leading, strong, tentative, and weak.

Recent Development and News in Protein microarray market

  • In the Health Care Equipment industry, the transition toward decentralized microfluidic diagnostic hardware reduced sample processing turnaround times by 35%, directly impacting Protein Microarray demand by necessitating the development of miniaturized multiplexed companion diagnostics compatible with point-of-care environments.
  • The enforcement of the EU Medical Device Regulation mandated stricter clinical evidence for in vitro diagnostic devices, increasing regulatory compliance overhead by up to 20% and forcing manufacturers to utilize high-density multiomics integration to validate multi-analyte biochip accuracy.
  • Widespread integration of graph-based artificial intelligence into laboratory information management systems accelerated multiomics data acquisition workflows, enhancing the throughput of early-stage lead optimization processes and driving reliance on dense autoantibody profiling assays.
  • Supply chain bottlenecks involving specialized optical components for chemiluminescent surface scanners prompted major equipment manufacturers to diversify raw material sourcing, temporarily extending lead times by 15% for new high-throughput scanning infrastructure deployments across clinical diagnostic frameworks.

Dive into Technavio’s robust research methodology, blending expert interviews, extensive data synthesis, and validated models for unparalleled Protein Microarray Market insights. See full methodology.

Market Scope
Page number 289
Base year 2025
Historic period 2020-2024
Forecast period 2026-2030
Growth momentum & CAGR Accelerate at a CAGR of 7.2%
Market growth 2026-2030 USD 1306.2 million
Market structure Fragmented
YoY growth 2025-2026(%) 7.0%
Key countries US, Canada, Mexico, Germany, UK, France, Italy, Spain, The Netherlands, China, Japan, India, South Korea, Singapore, Taiwan, Brazil, Saudi Arabia, South Africa, UAE, Argentina, Turkey, Egypt and Chile
Competitive landscape Leading Companies, Market Positioning of Companies, Competitive Strategies, and Industry Risks

Request Free Sample

Research Analyst Overview

  • The continuous evolution of high-throughput bioanalytical platforms fundamentally alters enterprise-level resource allocation and diagnostic product strategy. As biopharmaceutical executives prioritize precision medicine, the transition toward transcriptomic dataset cross-interrogation using hybrid microarrays forces boardrooms to restructure R&D budgets to accommodate advanced bioinformatics infrastructure.
  • Facilities integrating automated bioinformatics software experience a 35% reduction in data processing bottlenecks compared to those utilizing fragmented legacy analysis tools, directly accelerating the validation of non-linear biomarker patterns. This measurable gain in computational efficiency enables companies to expedite commercialization timelines for novel autoantibody detection panels.
  • To maintain a competitive advantage, organizations must continuously invest in stabilized protein print matrices that ensure long-term assay fidelity across distributed laboratory networks. Executive teams increasingly recognize that resolving complex biological matrix interference requires unified hardware and software ecosystems rather than standalone instruments.
  • Ultimately, strategic investments in cross-platform normalization algorithms mitigate analytical bias, ensuring that localized discovery efforts seamlessly translate into standardized, regulatory-compliant clinical assays suitable for global deployment.

What are the Key Data Covered in this Protein Microarray Market Research and Growth Report?

  • What is the expected growth of the Protein Microarray Market between 2026 and 2030?

    • USD 1.31 billion, at a CAGR of 7.2%

  • What segmentation does the market report cover?

    • The report is segmented by Class Type (Analytical protein microarrays, and Functional protein microarrays), Application (Proteomics, Diagnostics, and Others), End-user (Pharmaceutical companies, Diagnostic laboratories, and Others) and Geography (North America, Europe, Asia, Rest of World (ROW))

  • Which regions are analyzed in the report?

    • North America, Europe, Asia and Rest of World (ROW)

  • What are the key growth drivers and market challenges?

    • Advancements in proteomics research and biomarker discovery, Technical complexity in maintaining protein native conformation and assay stability

  • Who are the major players in the Protein Microarray Market?

    • Antigen Discovery Inc., Arrayjet Ltd., Boao Bio Group Co. Ltd., Cambridge Protein Arrays Ltd., CD Genomics, CDI Laboratories Inc., Creative Biolabs, Full Moon BioSystems Inc., ImmunoSign Inc., Merck KGaA, Ordinatrix, OriGene Technologies Inc., PEPperPRINT GmbH, PerkinElmer US LLC, Protein Biotechnologies Inc., RayBiotech Life Inc., SCHOTT AG, Standard BioTools Inc. and Thermo Fisher Scientific Inc.

Market Research Insights

  • The Protein Microarray Market functions as an essential analytical framework facilitating high-throughput parallel protein interaction screening. Research organizations increasingly transition toward these scalable formats to accelerate oncology immunoprobing workflows and streamline early-stage lead optimization.
  • By deploying integrated microarray platforms, clinical laboratories have reduced sample preparation times by 28% while improving target detection sensitivity by an estimated 15% over legacy enzyme-linked assays. This enhanced throughput directly lowers per-sample processing costs, optimizing resource allocation within large-scale translational medicine pipelines.
  • Furthermore, the systematic integration of pharmacoepidemiology integration allows diagnostic developers to correlate complex patient data, increasing the accuracy of prognostic biomarker identification by 22% and supporting more precise therapeutic interventions across diverse patient cohorts.

We can help! Our analysts can customize this protein microarray market research report to meet your requirements.

Get in touch

1. Executive Summary

1.1 Market overview

Executive Summary - Chart on Market Overview
Executive Summary - Data Table on Market Overview
Executive Summary - Chart on Global Market Characteristics
Executive Summary - Chart on Market by Geography
Executive Summary - Chart on Market Segmentation by Class Type
Executive Summary - Chart on Market Segmentation by Application
Executive Summary - Chart on Market Segmentation by End-user
Executive Summary - Chart on Incremental Growth
Executive Summary - Data Table on Incremental Growth
Executive Summary - Chart on Company Market Positioning

2. Technavio Analysis

2.1 Analysis of price sensitivity, lifecycle, customer purchase basket, adoption rates, and purchase criteria

2.2 Criticality of inputs and Factors of differentiation

Chart on Overview on criticality of inputs and factors of differentiation

2.3 Factors of disruption

Chart on Overview on factors of disruption

2.4 Impact of drivers and challenges

Chart on Impact of drivers and challenges in 2025 and 2030

3. Market Landscape

3.1 Market ecosystem

Chart on Parent Market
Data Table on - Parent Market

3.2 Market characteristics

Chart on Market characteristics analysis

3.3 Value chain analysis

Chart on Value chain analysis

4. Market Sizing

4.1 Market definition

Data Table on Offerings of companies included in the market definition

4.2 Market segment analysis

Market segments

4.3 Market size 2025

4.4 Market outlook: Forecast for 2025-2030

Chart on Global - Market size and forecast 2025-2030 ($ million)
Data Table on Global - Market size and forecast 2025-2030 ($ million)
Chart on Global Market: Year-over-year growth 2025-2030 (%)
Data Table on Global Market: Year-over-year growth 2025-2030 (%)

5. Historic Market Size

5.1 Global Protein Microarray Market 2020 - 2024

Historic Market Size - Data Table on Global Protein Microarray Market 2020 - 2024 ($ million)

5.2 Class Type segment analysis 2020 - 2024

Historic Market Size - Class Type Segment 2020 - 2024 ($ million)

5.3 Application segment analysis 2020 - 2024

Historic Market Size - Application Segment 2020 - 2024 ($ million)

5.4 End-user segment analysis 2020 - 2024

Historic Market Size - End-user Segment 2020 - 2024 ($ million)

5.5 Geography segment analysis 2020 - 2024

Historic Market Size - Geography Segment 2020 - 2024 ($ million)

5.6 Country segment analysis 2020 - 2024

Historic Market Size - Country Segment 2020 - 2024 ($ million)

6. Qualitative Analysis

6.1 Impact of AI on Global Protein Microarray Market

6.2 Impact of Geopolitical Conflicts on Global Protein Microarray Market

7. Five Forces Analysis

7.1 Five forces summary

Five forces analysis - Comparison between 2025 and 2030

7.2 Bargaining power of buyers

Bargaining power of buyers - Impact of key factors 2025 and 2030

7.3 Bargaining power of suppliers

Bargaining power of suppliers - Impact of key factors in 2025 and 2030

7.4 Threat of new entrants

Threat of new entrants - Impact of key factors in 2025 and 2030

7.5 Threat of substitutes

Threat of substitutes - Impact of key factors in 2025 and 2030

7.6 Threat of rivalry

Threat of rivalry - Impact of key factors in 2025 and 2030

7.7 Market condition

Chart on Market condition - Five forces 2025 and 2030

8. Market Segmentation by Class Type

8.1 Market segments

Chart on Class Type - Market share 2025-2030 (%)
Data Table on Class Type - Market share 2025-2030 (%)

8.2 Comparison by Class Type

Chart on Comparison by Class Type
Data Table on Comparison by Class Type

8.3 Analytical protein microarrays - Market size and forecast 2025-2030

Chart on Analytical protein microarrays - Market size and forecast 2025-2030 ($ million)
Data Table on Analytical protein microarrays - Market size and forecast 2025-2030 ($ million)
Chart on Analytical protein microarrays - Year-over-year growth 2025-2030 (%)
Data Table on Analytical protein microarrays - Year-over-year growth 2025-2030 (%)

8.4 Functional protein microarrays - Market size and forecast 2025-2030

Chart on Functional protein microarrays - Market size and forecast 2025-2030 ($ million)
Data Table on Functional protein microarrays - Market size and forecast 2025-2030 ($ million)
Chart on Functional protein microarrays - Year-over-year growth 2025-2030 (%)
Data Table on Functional protein microarrays - Year-over-year growth 2025-2030 (%)

8.5 Market opportunity by Class Type

Market opportunity by Class Type ($ million)
Data Table on Market opportunity by Class Type ($ million)

9. Market Segmentation by Application

9.1 Market segments

Chart on Application - Market share 2025-2030 (%)
Data Table on Application - Market share 2025-2030 (%)

9.2 Comparison by Application

Chart on Comparison by Application
Data Table on Comparison by Application

9.3 Proteomics - Market size and forecast 2025-2030

Chart on Proteomics - Market size and forecast 2025-2030 ($ million)
Data Table on Proteomics - Market size and forecast 2025-2030 ($ million)
Chart on Proteomics - Year-over-year growth 2025-2030 (%)
Data Table on Proteomics - Year-over-year growth 2025-2030 (%)

9.4 Diagnostics - Market size and forecast 2025-2030

Chart on Diagnostics - Market size and forecast 2025-2030 ($ million)
Data Table on Diagnostics - Market size and forecast 2025-2030 ($ million)
Chart on Diagnostics - Year-over-year growth 2025-2030 (%)
Data Table on Diagnostics - Year-over-year growth 2025-2030 (%)

9.5 Others - Market size and forecast 2025-2030

Chart on Others - Market size and forecast 2025-2030 ($ million)
Data Table on Others - Market size and forecast 2025-2030 ($ million)
Chart on Others - Year-over-year growth 2025-2030 (%)
Data Table on Others - Year-over-year growth 2025-2030 (%)

9.6 Market opportunity by Application

Market opportunity by Application ($ million)
Data Table on Market opportunity by Application ($ million)

10. Market Segmentation by End-user

10.1 Market segments

Chart on End-user - Market share 2025-2030 (%)
Data Table on End-user - Market share 2025-2030 (%)

10.2 Comparison by End-user

Chart on Comparison by End-user
Data Table on Comparison by End-user

10.3 Pharmaceutical companies - Market size and forecast 2025-2030

Chart on Pharmaceutical companies - Market size and forecast 2025-2030 ($ million)
Data Table on Pharmaceutical companies - Market size and forecast 2025-2030 ($ million)
Chart on Pharmaceutical companies - Year-over-year growth 2025-2030 (%)
Data Table on Pharmaceutical companies - Year-over-year growth 2025-2030 (%)

10.4 Diagnostic laboratories - Market size and forecast 2025-2030

Chart on Diagnostic laboratories - Market size and forecast 2025-2030 ($ million)
Data Table on Diagnostic laboratories - Market size and forecast 2025-2030 ($ million)
Chart on Diagnostic laboratories - Year-over-year growth 2025-2030 (%)
Data Table on Diagnostic laboratories - Year-over-year growth 2025-2030 (%)

10.5 Others - Market size and forecast 2025-2030

Chart on Others - Market size and forecast 2025-2030 ($ million)
Data Table on Others - Market size and forecast 2025-2030 ($ million)
Chart on Others - Year-over-year growth 2025-2030 (%)
Data Table on Others - Year-over-year growth 2025-2030 (%)

10.6 Market opportunity by End-user

Market opportunity by End-user ($ million)
Data Table on Market opportunity by End-user ($ million)

11. Customer Landscape

11.1 Customer landscape overview

Analysis of price sensitivity, lifecycle, customer purchase basket, adoption rates, and purchase criteria

12. Geographic Landscape

12.1 Geographic segmentation

Chart on Market share by geography 2025-2030 (%)
Data Table on Market share by geography 2025-2030 (%)

12.2 Geographic comparison

Chart on Geographic comparison
Data Table on Geographic comparison

12.3 North America - Market size and forecast 2025-2030

Chart on North America - Market size and forecast 2025-2030 ($ million)
Data Table on North America - Market size and forecast 2025-2030 ($ million)
Chart on North America - Year-over-year growth 2025-2030 (%)
Data Table on North America - Year-over-year growth 2025-2030 (%)
Chart on Regional Comparison - North America
Data Table on Regional Comparison - North America

12.3.1 US - Market size and forecast 2025-2030

Chart on US - Market size and forecast 2025-2030 ($ million)
Data Table on US - Market size and forecast 2025-2030 ($ million)
Chart on US - Year-over-year growth 2025-2030 (%)
Data Table on US - Year-over-year growth 2025-2030 (%)

12.3.2 Canada - Market size and forecast 2025-2030

Chart on Canada - Market size and forecast 2025-2030 ($ million)
Data Table on Canada - Market size and forecast 2025-2030 ($ million)
Chart on Canada - Year-over-year growth 2025-2030 (%)
Data Table on Canada - Year-over-year growth 2025-2030 (%)

12.3.3 Mexico - Market size and forecast 2025-2030

Chart on Mexico - Market size and forecast 2025-2030 ($ million)
Data Table on Mexico - Market size and forecast 2025-2030 ($ million)
Chart on Mexico - Year-over-year growth 2025-2030 (%)
Data Table on Mexico - Year-over-year growth 2025-2030 (%)

12.4 Europe - Market size and forecast 2025-2030

Chart on Europe - Market size and forecast 2025-2030 ($ million)
Data Table on Europe - Market size and forecast 2025-2030 ($ million)
Chart on Europe - Year-over-year growth 2025-2030 (%)
Data Table on Europe - Year-over-year growth 2025-2030 (%)
Chart on Regional Comparison - Europe
Data Table on Regional Comparison - Europe

12.4.1 Germany - Market size and forecast 2025-2030

Chart on Germany - Market size and forecast 2025-2030 ($ million)
Data Table on Germany - Market size and forecast 2025-2030 ($ million)
Chart on Germany - Year-over-year growth 2025-2030 (%)
Data Table on Germany - Year-over-year growth 2025-2030 (%)

12.4.2 UK - Market size and forecast 2025-2030

Chart on UK - Market size and forecast 2025-2030 ($ million)
Data Table on UK - Market size and forecast 2025-2030 ($ million)
Chart on UK - Year-over-year growth 2025-2030 (%)
Data Table on UK - Year-over-year growth 2025-2030 (%)

12.4.3 France - Market size and forecast 2025-2030

Chart on France - Market size and forecast 2025-2030 ($ million)
Data Table on France - Market size and forecast 2025-2030 ($ million)
Chart on France - Year-over-year growth 2025-2030 (%)
Data Table on France - Year-over-year growth 2025-2030 (%)

12.4.4 Italy - Market size and forecast 2025-2030

Chart on Italy - Market size and forecast 2025-2030 ($ million)
Data Table on Italy - Market size and forecast 2025-2030 ($ million)
Chart on Italy - Year-over-year growth 2025-2030 (%)
Data Table on Italy - Year-over-year growth 2025-2030 (%)

12.4.5 Spain - Market size and forecast 2025-2030

Chart on Spain - Market size and forecast 2025-2030 ($ million)
Data Table on Spain - Market size and forecast 2025-2030 ($ million)
Chart on Spain - Year-over-year growth 2025-2030 (%)
Data Table on Spain - Year-over-year growth 2025-2030 (%)

12.4.6 The Netherlands - Market size and forecast 2025-2030

Chart on The Netherlands - Market size and forecast 2025-2030 ($ million)
Data Table on The Netherlands - Market size and forecast 2025-2030 ($ million)
Chart on The Netherlands - Year-over-year growth 2025-2030 (%)
Data Table on The Netherlands - Year-over-year growth 2025-2030 (%)

12.5 Asia - Market size and forecast 2025-2030

Chart on Asia - Market size and forecast 2025-2030 ($ million)
Data Table on Asia - Market size and forecast 2025-2030 ($ million)
Chart on Asia - Year-over-year growth 2025-2030 (%)
Data Table on Asia - Year-over-year growth 2025-2030 (%)
Chart on Regional Comparison - Asia
Data Table on Regional Comparison - Asia

12.5.1 China - Market size and forecast 2025-2030

Chart on China - Market size and forecast 2025-2030 ($ million)
Data Table on China - Market size and forecast 2025-2030 ($ million)
Chart on China - Year-over-year growth 2025-2030 (%)
Data Table on China - Year-over-year growth 2025-2030 (%)

12.5.2 Japan - Market size and forecast 2025-2030

Chart on Japan - Market size and forecast 2025-2030 ($ million)
Data Table on Japan - Market size and forecast 2025-2030 ($ million)
Chart on Japan - Year-over-year growth 2025-2030 (%)
Data Table on Japan - Year-over-year growth 2025-2030 (%)

12.5.3 India - Market size and forecast 2025-2030

Chart on India - Market size and forecast 2025-2030 ($ million)
Data Table on India - Market size and forecast 2025-2030 ($ million)
Chart on India - Year-over-year growth 2025-2030 (%)
Data Table on India - Year-over-year growth 2025-2030 (%)

12.5.4 South Korea - Market size and forecast 2025-2030

Chart on South Korea - Market size and forecast 2025-2030 ($ million)
Data Table on South Korea - Market size and forecast 2025-2030 ($ million)
Chart on South Korea - Year-over-year growth 2025-2030 (%)
Data Table on South Korea - Year-over-year growth 2025-2030 (%)

12.5.5 Singapore - Market size and forecast 2025-2030

Chart on Singapore - Market size and forecast 2025-2030 ($ million)
Data Table on Singapore - Market size and forecast 2025-2030 ($ million)
Chart on Singapore - Year-over-year growth 2025-2030 (%)
Data Table on Singapore - Year-over-year growth 2025-2030 (%)

12.5.6 Taiwan - Market size and forecast 2025-2030

Chart on Taiwan - Market size and forecast 2025-2030 ($ million)
Data Table on Taiwan - Market size and forecast 2025-2030 ($ million)
Chart on Taiwan - Year-over-year growth 2025-2030 (%)
Data Table on Taiwan - Year-over-year growth 2025-2030 (%)

12.6 Rest of World (ROW) - Market size and forecast 2025-2030

Chart on Rest of World (ROW) - Market size and forecast 2025-2030 ($ million)
Data Table on Rest of World (ROW) - Market size and forecast 2025-2030 ($ million)
Chart on Rest of World (ROW) - Year-over-year growth 2025-2030 (%)
Data Table on Rest of World (ROW) - Year-over-year growth 2025-2030 (%)
Chart on Regional Comparison - Rest of World (ROW)
Data Table on Regional Comparison - Rest of World (ROW)

12.6.1 Brazil - Market size and forecast 2025-2030

Chart on Brazil - Market size and forecast 2025-2030 ($ million)
Data Table on Brazil - Market size and forecast 2025-2030 ($ million)
Chart on Brazil - Year-over-year growth 2025-2030 (%)
Data Table on Brazil - Year-over-year growth 2025-2030 (%)

12.6.2 Saudi Arabia - Market size and forecast 2025-2030

Chart on Saudi Arabia - Market size and forecast 2025-2030 ($ million)
Data Table on Saudi Arabia - Market size and forecast 2025-2030 ($ million)
Chart on Saudi Arabia - Year-over-year growth 2025-2030 (%)
Data Table on Saudi Arabia - Year-over-year growth 2025-2030 (%)

12.6.3 South Africa - Market size and forecast 2025-2030

Chart on South Africa - Market size and forecast 2025-2030 ($ million)
Data Table on South Africa - Market size and forecast 2025-2030 ($ million)
Chart on South Africa - Year-over-year growth 2025-2030 (%)
Data Table on South Africa - Year-over-year growth 2025-2030 (%)

12.6.4 UAE - Market size and forecast 2025-2030

Chart on UAE - Market size and forecast 2025-2030 ($ million)
Data Table on UAE - Market size and forecast 2025-2030 ($ million)
Chart on UAE - Year-over-year growth 2025-2030 (%)
Data Table on UAE - Year-over-year growth 2025-2030 (%)

12.6.5 Argentina - Market size and forecast 2025-2030

Chart on Argentina - Market size and forecast 2025-2030 ($ million)
Data Table on Argentina - Market size and forecast 2025-2030 ($ million)
Chart on Argentina - Year-over-year growth 2025-2030 (%)
Data Table on Argentina - Year-over-year growth 2025-2030 (%)

12.6.6 Turkey - Market size and forecast 2025-2030

Chart on Turkey - Market size and forecast 2025-2030 ($ million)
Data Table on Turkey - Market size and forecast 2025-2030 ($ million)
Chart on Turkey - Year-over-year growth 2025-2030 (%)
Data Table on Turkey - Year-over-year growth 2025-2030 (%)

12.6.7 Egypt - Market size and forecast 2025-2030

Chart on Egypt - Market size and forecast 2025-2030 ($ million)
Data Table on Egypt - Market size and forecast 2025-2030 ($ million)
Chart on Egypt - Year-over-year growth 2025-2030 (%)
Data Table on Egypt - Year-over-year growth 2025-2030 (%)

12.6.8 Chile - Market size and forecast 2025-2030

Chart on Chile - Market size and forecast 2025-2030 ($ million)
Data Table on Chile - Market size and forecast 2025-2030 ($ million)
Chart on Chile - Year-over-year growth 2025-2030 (%)
Data Table on Chile - Year-over-year growth 2025-2030 (%)

12.7 Market opportunity by geography

Market opportunity by geography ($ million)
Data Tables on Market opportunity by geography ($ million)

13. Drivers, Challenges, and Opportunity

13.1 Market drivers

Advancements in proteomics research and biomarker discovery
Rising integration of personalized medicine and companion diagnostics
Technological innovations and platform automation in high-throughput screening

13.2 Market challenges

Technical complexity in maintaining protein native conformation and assay stability
High operational costs and capital expenditure constraints
Bioinformatics bottlenecks and complex data interpretation

13.3 Impact of drivers and challenges

Impact of drivers and challenges in 2025 and 2030

13.4 Market opportunities

Shift toward high-density next-generation multiomics and hybrid proteomic integration
Expansion of machine learning and AI-driven bioinformatics pipelines
Transition from exploratory proteomics to automated regulated clinical diagnostics

14. Competitive Landscape

14.1 Overview

14.2

Overview on criticality of inputs and factors of differentiation

14.3 Landscape disruption

Overview on factors of disruption

14.4 Industry risks

Impact of key risks on business

15. Competitive Analysis

15.1 Companies profiled

Companies covered

15.2 Company ranking index

15.3 Market positioning of companies

Matrix on companies position and classification

15.4 Antigen Discovery Inc.

Antigen Discovery Inc. - Overview
Antigen Discovery Inc. - Product / Service
Antigen Discovery Inc. - Key offerings
SWOT

15.5 Arrayjet Ltd.

Arrayjet Ltd. - Overview
Arrayjet Ltd. - Product / Service
Arrayjet Ltd. - Key offerings
SWOT

15.6 Boao Bio Group Co. Ltd.

Boao Bio Group Co. Ltd. - Overview
Boao Bio Group Co. Ltd. - Product / Service
Boao Bio Group Co. Ltd. - Key offerings
SWOT

15.7 Cambridge Protein Arrays Ltd.

Cambridge Protein Arrays Ltd. - Overview
Cambridge Protein Arrays Ltd. - Product / Service
Cambridge Protein Arrays Ltd. - Key offerings
SWOT

15.8 CD Genomics

CD Genomics - Overview
CD Genomics - Product / Service
CD Genomics - Key offerings
SWOT

15.9 CDI Laboratories Inc.

CDI Laboratories Inc. - Overview
CDI Laboratories Inc. - Product / Service
CDI Laboratories Inc. - Key offerings
SWOT

15.10 Creative Biolabs

Creative Biolabs - Overview
Creative Biolabs - Product / Service
Creative Biolabs - Key offerings
SWOT

15.11 Full Moon BioSystems Inc.

Full Moon BioSystems Inc. - Overview
Full Moon BioSystems Inc. - Product / Service
Full Moon BioSystems Inc. - Key offerings
SWOT

15.12 ImmunoSign Inc.

ImmunoSign Inc. - Overview
ImmunoSign Inc. - Product / Service
ImmunoSign Inc. - Key offerings
SWOT

15.13 Merck KGaA

Merck KGaA - Overview
Merck KGaA - Business segments
Merck KGaA - Key news
Merck KGaA - Key offerings
Merck KGaA - Segment focus
SWOT

15.14 Ordinatrix

Ordinatrix - Overview
Ordinatrix - Product / Service
Ordinatrix - Key offerings
SWOT

15.15 OriGene Technologies Inc.

OriGene Technologies Inc. - Overview
OriGene Technologies Inc. - Product / Service
OriGene Technologies Inc. - Key offerings
SWOT

15.16 PerkinElmer US LLC

PerkinElmer US LLC - Overview
PerkinElmer US LLC - Product / Service
PerkinElmer US LLC - Key offerings
SWOT

15.17 SCHOTT AG

SCHOTT AG - Overview
SCHOTT AG - Product / Service
SCHOTT AG - Key offerings
SWOT

15.18 Thermo Fisher Scientific Inc.

Thermo Fisher Scientific Inc. - Overview
Thermo Fisher Scientific Inc. - Business segments
Thermo Fisher Scientific Inc. - Key news
Thermo Fisher Scientific Inc. - Key offerings
Thermo Fisher Scientific Inc. - Segment focus
SWOT

16. Appendix

16.1 Scope of the report

Market definition
Objectives
Notes and caveats

16.2 Inclusions and exclusions checklist

Inclusions checklist
Exclusions checklist

16.3 Currency conversion rates for US$

16.4 Research methodology

16.5 Data procurement

Information sources

16.6 Data validation

16.7 Validation techniques employed for market sizing

16.8 Data synthesis

16.9 360 degree market analysis

16.10 List of abbreviations

Research Methodology

Technavio presents a detailed picture of the market by way of study, synthesis, and summation of data from multiple sources. The analysts have presented the various facets of the market with a particular focus on identifying the key industry influencers. The data thus presented is comprehensive, reliable, and the result of extensive research, both primary and secondary.

INFORMATION SOURCES

Primary sources

  • Manufacturers and suppliers
  • Channel partners
  • Industry experts
  • Strategic decision makers

Secondary sources

  • Industry journals and periodicals
  • Government data
  • Financial reports of key industry players
  • Historical data
  • Press releases

DATA ANALYSIS

Data Synthesis

  • Collation of data
  • Estimation of key figures
  • Analysis of derived insights

Data Validation

  • Triangulation with data models
  • Reference against proprietary databases
  • Corroboration with industry experts

REPORT WRITING

Qualitative

  • Market drivers
  • Market challenges
  • Market trends
  • Five forces analysis

Quantitative

  • Market size and forecast
  • Market segmentation
  • Geographical insights
  • Competitive landscape

Interested in this report?

Get your sample now to see our research methodology and insights!

Download Now

Frequently Asked Questions

Protein Microarray market growth will increase by USD 1306.2 million during 2026-2030.

The Protein Microarray market is expected to grow at a CAGR of 7.2% during 2026-2030.

Protein Microarray market is segmented by Class type (Analytical protein microarrays, Functional protein microarrays) Application (Proteomics, Diagnostics, Others) End-user (Pharmaceutical companies, Diagnostic laboratories, Others)

Antigen Discovery Inc., Arrayjet Ltd., Boao Bio Group Co. Ltd., Cambridge Protein Arrays Ltd., CD Genomics, CDI Laboratories Inc., Creative Biolabs, Full Moon BioSystems Inc., ImmunoSign Inc., Merck KGaA, Ordinatrix, OriGene Technologies Inc., PEPperPRINT GmbH, PerkinElmer US LLC, Protein Biotechnologies Inc., RayBiotech Life Inc., SCHOTT AG, Standard BioTools Inc., Thermo Fisher Scientific Inc. are a few of the key vendors in the Protein Microarray market.

North America will register the highest growth rate of 37.3% among the other regions. Therefore, the Protein Microarray market in North America is expected to garner significant business opportunities for the vendors during the forecast period.

US, Canada, Mexico, Germany, UK, France, Italy, Spain, The Netherlands, China, Japan, India, South Korea, Singapore, Taiwan, Brazil, Saudi Arabia, South Africa, UAE, Argentina, Turkey, Egypt, Chile

  • Advancements in proteomics research and biomarker discovery is the driving factor this market.

The Protein Microarray market vendors should focus on grabbing business opportunities from the Class type segment as it accounted for the largest market share in the base year.
RIA - Research AI Assistant
Ask RIA
