Quartz Glass Market Analysis, Size, and Forecast 2025-2029: APAC (China, Japan, and South Korea), North America (US, Canada, and Mexico), Europe (Germany, France, and UK), Middle East and Africa (Saudi Arabia, UAE, and South Africa), South America (Brazil, Argentina, and Colombia), and Rest of World (ROW)

Quartz Glass Market Analysis, Size, and Forecast 2025-2029:
APAC (China, Japan, and South Korea), North America (US, Canada, and Mexico), Europe (Germany, France, and UK), Middle East and Africa (Saudi Arabia, UAE, and South Africa), South America (Brazil, Argentina, and Colombia), and Rest of World (ROW)

Published: Dec 2025 316 Pages SKU: IRTNTR81151

Market Overview at a Glance

$1.52 B
Market Opportunity
6.8%
CAGR 2024 - 2029
49.5%
APAC Growth
$1.30 B
Fused quartz glass segment 2023

Quartz Glass Market Size 2025-2029

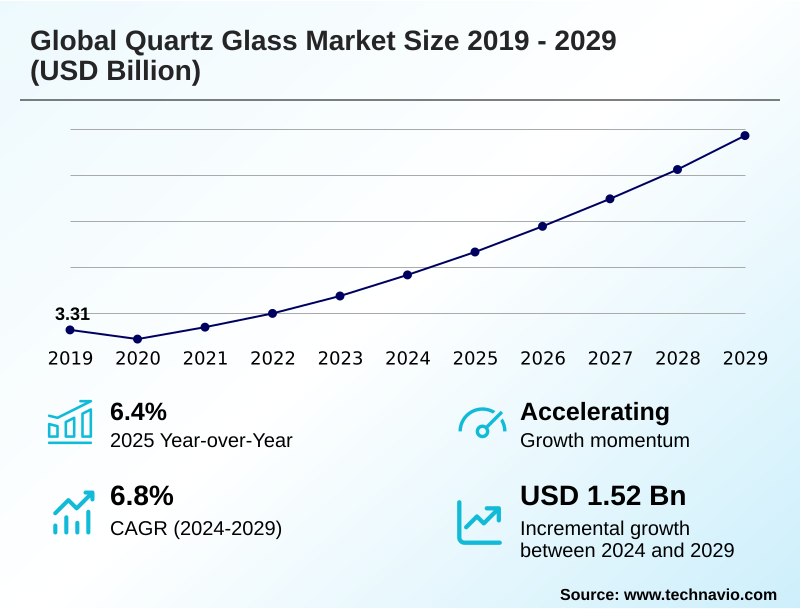
The quartz glass market size is valued to increase by USD 1.52 billion, at a CAGR of 6.8% from 2024 to 2029. Growth in semiconductor industry will drive the quartz glass market.

Major Market Trends & Insights

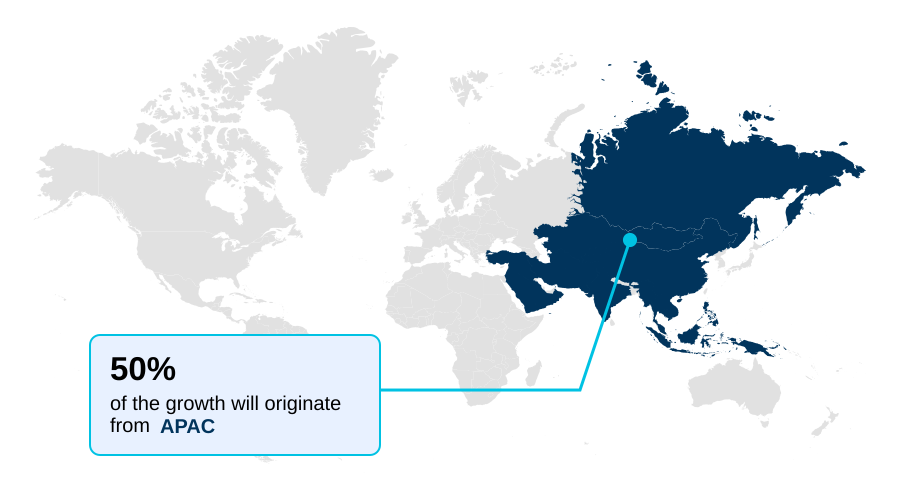
  • APAC dominated the market and accounted for a 49.5% growth during the forecast period.
  • By Product Type - Fused quartz glass segment was valued at USD 1.30 billion in 2023
  • By Application - Semiconductors and electronics segment accounted for the largest market revenue share in 2023

Market Size & Forecast

  • Market Opportunities: USD 2.12 billion
  • Market Future Opportunities: USD 1.52 billion
  • CAGR from 2024 to 2029 : 6.8%

Market Summary

  • The quartz glass market is sustained by its indispensable role in high-technology sectors, where materials with exceptional purity and performance are paramount. Its unique properties, including low thermal expansion and superior chemical inertness, make it a critical enabler for industries pushing the boundaries of innovation.
  • A key driver is the relentless advancement in semiconductor manufacturing, where fused quartz glass is used in high-temperature wafer processing. As chip designs become more complex, the demand for flawless materials intensifies, pushing manufacturers to refine production. For instance, in a typical fabrication plant, optimizing quartz component quality can reduce wafer contamination incidents by over 20%, directly improving production yields.
  • Beyond electronics, the expansion of global fiber optic networks and the growth in solar energy depend on high-purity quartz. However, the industry grapples with high production costs and supply chain vulnerabilities tied to scarce, high-purity raw materials. This dynamic creates a competitive environment where technological innovation and process efficiency are crucial for maintaining market leadership.

What will be the Size of the Quartz Glass Market during the forecast period?

Get Key Insights on Market Forecast (PDF) Request Free Sample

How is the Quartz Glass Market Segmented?

The quartz glass industry research report provides comprehensive data (region-wise segment analysis), with forecasts and estimates in "USD million" for the period 2025-2029, as well as historical data from 2019-2023 for the following segments.
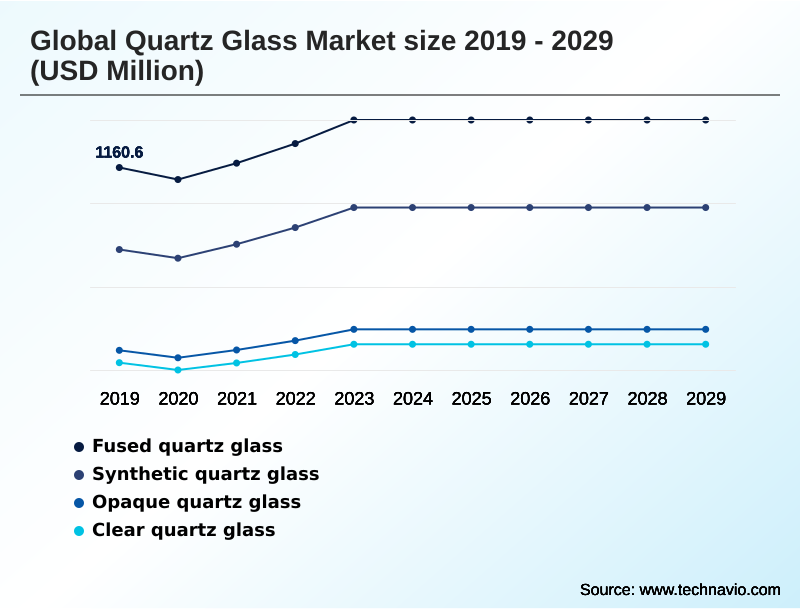
  • Product type
    • Fused quartz glass
    • Synthetic quartz glass
    • Opaque quartz glass
    • Clear quartz glass
  • Application
    • Semiconductors and electronics
    • Photovoltaics and solar energy
    • Optical and telecommunication components
    • Lighting and lamp manufacturing
    • Others
  • Distribution channel
    • Direct supply to OEMs
    • Authorised distributors
    • Online industrial portals
    • Speciality materials retailers
  • Geography
    • APAC
      • China
      • Japan
      • South Korea
    • North America
      • US
      • Canada
      • Mexico
    • Europe
      • Germany
      • France
      • UK
    • Middle East and Africa
      • Saudi Arabia
      • UAE
      • South Africa
    • South America
      • Brazil
      • Argentina
      • Colombia
    • Rest of World (ROW)

By Product Type Insights

The fused quartz glass segment is estimated to witness significant growth during the forecast period.

The global quartz glass market 2025-2029 is segmented by product, application, and geography, reflecting diverse industrial requirements. The fused quartz glass segment is defined by its production from natural silica sand, offering robust physical properties for broad use.

Its excellent thermal shock resistance and high-temperature stability make it vital for components like quartz furnace tubes and industrial furnace liners where cost-effectiveness is prioritized. This material's low thermal expansion ensures dimensional integrity in demanding thermal cycling.

In photovoltaics, it is used for high-purity quartz crucibles essential for photovoltaic silicon production.

While less pure than synthetic variants, manufacturing advancements have improved its quality, expanding its use into areas such as halogen lamp envelopes, where it delivers 95% transmission efficiency in the visible spectrum.

Other segments include semiconductor etch chambers and aerospace optical windows.

Request Free Sample

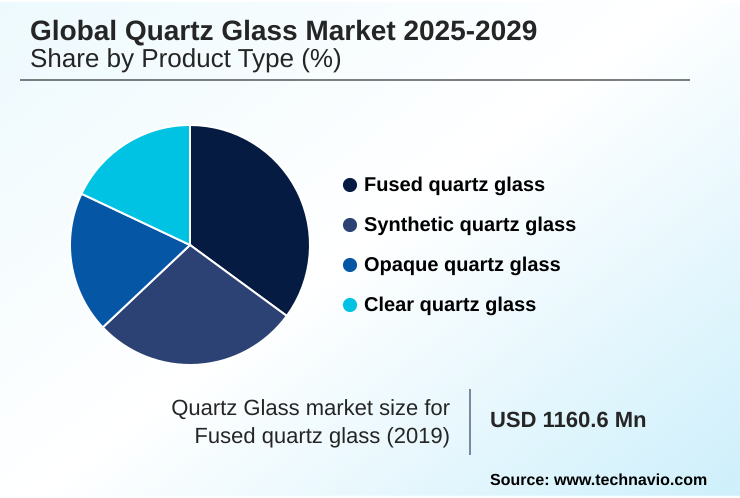
The Fused quartz glass segment was valued at USD 1.30 billion in 2023 and showed a gradual increase during the forecast period.

Request Free Sample

Regional Analysis

APAC is estimated to contribute 49.5% to the growth of the global market during the forecast period.Technavio’s analysts have elaborately explained the regional trends and drivers that shape the market during the forecast period.

See How Quartz Glass Market Demand is Rising in APAC Request Free Sample

The geographic landscape is dominated by the APAC region, which accounts for nearly 50% of the market's incremental growth, driven by its heavy concentration of semiconductor and electronics manufacturing.

These industries require a steady supply of synthetic quartz glass and amorphous silicon dioxide for advanced applications like deep ultraviolet lithography. North America follows, with its robust research and aerospace sectors demanding radiation resistant glass and materials for laser optics.

Europe’s market is mature, focusing on specialized industrial and medical applications using materials with high UV transparency. The region's focus on custom-machined fused quartz labware contributes to its stability.

In comparison, the market share in South America is less than 5%, reflecting a more nascent industrial base.

Market Dynamics

Our researchers analyzed the data with 2024 as the base year, along with the key drivers, trends, and challenges. A holistic analysis of drivers will help companies refine their marketing strategies to gain a competitive advantage.

  • Strategic decision-making in the quartz glass for semiconductor manufacturing sector is increasingly complex, balancing cost against the stringent requirements for purity and performance. The adoption of synthetic quartz in EUV lithography is a necessity for next-generation chip fabrication, influencing capital expenditure on production equipment.
  • Simultaneously, the expansion of global connectivity relies on fused silica for optical fiber networks, where material consistency is paramount for minimizing signal loss. For renewable energy initiatives, the efficiency of high-purity quartz in solar cell production directly impacts project viability, with improved crucible quality leading to a nearly 10% increase in solar cell efficiency compared to standard materials.
  • The use of opaque quartz for industrial furnaces offers a clear operational advantage in thermal management, while the selection of clear quartz in UV disinfection lamps is driven by public health standards. Understanding low thermal expansion quartz applications and the chemical inertness of quartz in reactors is critical for both product development and operational planning.
  • The market for large-diameter quartz tubes for solar and custom-machined fused quartz labware is also expanding. From quartz glass for high-power lasers to translucent fused quartz for medical devices, material specification dictates success. The use of high-density opaque quartz in plasma etching and crystal-clear synthetic quartz ingots highlights the diverse material science involved.
  • Finally, applications from quartz glass for precision metrology and fabricating fused quartz for spectroscopy cells to fused silica rods for diffusion tubes, synthetic quartz blanks for camera lenses, high-purity silica for wafer boats, and fused quartz cylinders for industrial furnaces all underscore the material's critical role.

What are the key market drivers leading to the rise in the adoption of Quartz Glass Industry?

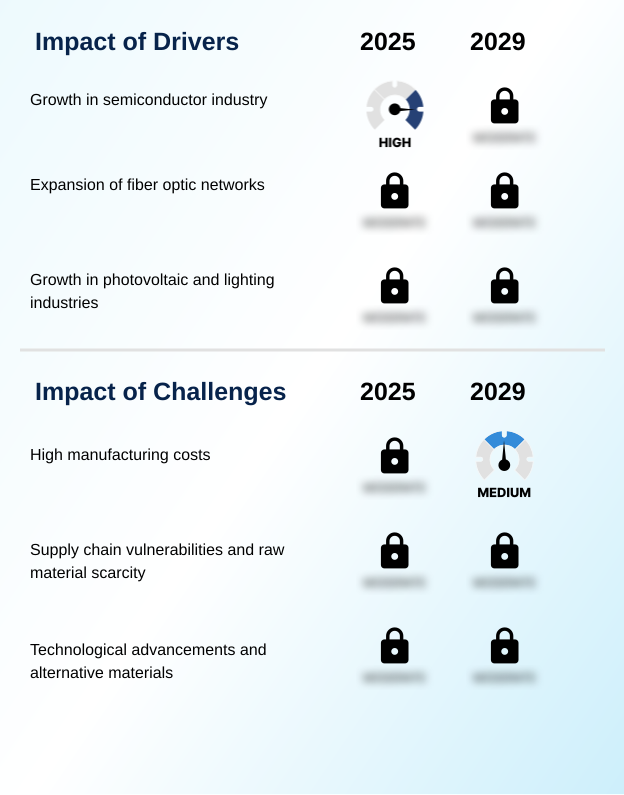
  • The burgeoning growth of the global semiconductor industry, which relies on quartz glass for nearly every stage of manufacturing, stands as the primary driver for the market.

  • The primary market driver is the sustained growth of the global semiconductor industry, which consumes a vast amount of quartz glass.
  • As demand for advanced electronics escalates, so does the need for high-performance components like fused quartz glass with exceptional optical homogeneity. This directly translates to increased production, with some fabs increasing their quartz component consumption by 15% year-over-year.
  • Another significant driver is the expansion of fiber optic networks, fueled by the global surge in data consumption. High-temperature stability is crucial for manufacturing optical fiber preforms. The growth of the photovoltaic and specialized lighting industries also propels demand.
  • In the solar sector, high-purity quartz crucibles are essential for producing efficient solar cells. Meanwhile, the lighting industry's reliance on quartz for high-intensity and UV lamps, which can achieve operational lifespans 50% longer than alternatives, continues to fuel the market.

What are the market trends shaping the Quartz Glass Industry?

  • A paramount trend shaping the market is the escalating demand for ultra-high purity quartz. This is driven primarily by advancements in the semiconductor industry toward smaller manufacturing nodes.

  • The market is witnessing a significant trend toward materials with exceptional purity and advanced fabrication. Demand for ultra-high purity quartz is escalating, driven by semiconductor manufacturing processes that require minimal contaminants to achieve high chip yields, with some applications measuring impurities in parts per trillion. This shift has led to process improvements that reduce metallic contaminants by over 40%.
  • Concurrently, technological advancements in fabrication, including laser processing and automated machining of components for monocrystalline silicon growth, enable the production of complex geometries with tighter tolerances. These innovations, applied to quartz for quantum computing, have resulted in a 25% reduction in lead times for custom prototypes.
  • Sustainability is also a key influencer, with manufacturers investing in energy-efficient furnaces to reduce the carbon footprint associated with producing materials with reduced hydroxyl content.

What challenges does the Quartz Glass Industry face during its growth?

  • The inherently high manufacturing cost, driven by energy-intensive processes and expensive raw materials, remains a primary challenge confronting the global market.

  • A primary challenge facing the market is the high manufacturing cost, driven by energy-intensive processes and expensive raw materials like synthetic quartz glass. These costs can limit adoption in price-sensitive applications, where alternative materials, despite offering 20% lower performance, might be chosen. Supply chain vulnerabilities present another significant hurdle.
  • The industry relies on a few sources for the purest raw materials needed for applications like spectroscopy cells and aerospace optical windows, making it susceptible to geopolitical risks and price volatility. This has led to lead times increasing by up to 30% in some cases.
  • Additionally, the threat of alternative materials, such as advanced ceramics for industrial furnace liners or composites for plasma etching parts, forces continuous innovation in quartz glass to maintain its competitive advantage.

Exclusive Technavio Analysis on Customer Landscape

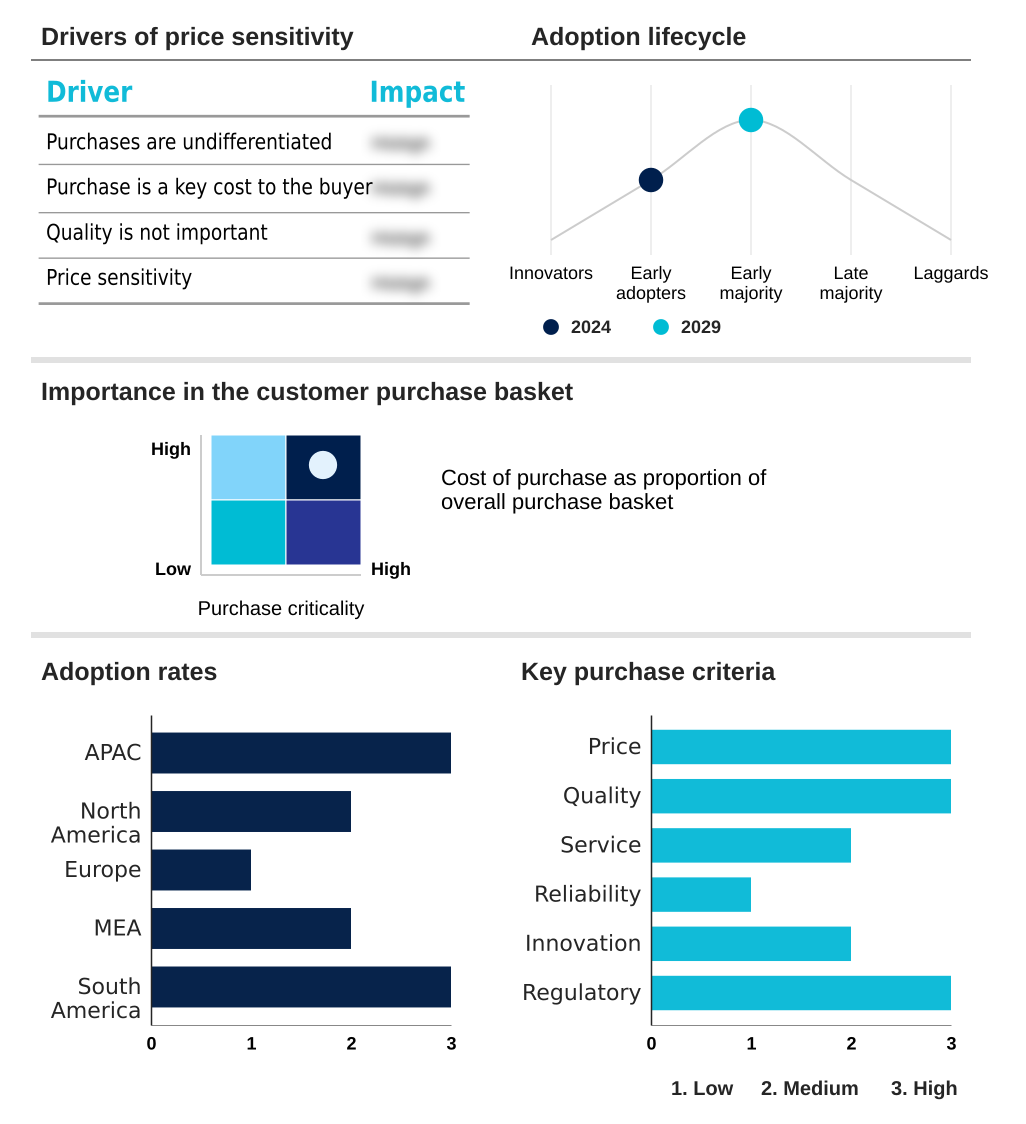
The quartz glass market forecasting report includes the adoption lifecycle of the market, covering from the innovator’s stage to the laggard’s stage. It focuses on adoption rates in different regions based on penetration. Furthermore, the quartz glass market report also includes key purchase criteria and drivers of price sensitivity to help companies evaluate and develop their market growth analysis strategies.

Customer Landscape of Quartz Glass Industry

Competitive Landscape

Companies are implementing various strategies, such as strategic alliances, quartz glass market forecast, partnerships, mergers and acquisitions, geographical expansion, and product/service launches, to enhance their presence in the industry.

AGC Inc. - Delivering high-purity synthetic fused silica and custom-fabricated quartz components for advanced semiconductor, optical, and telecommunication applications.

The industry research and growth report includes detailed analyses of the competitive landscape of the market and information about key companies, including:

  • AGC Inc.
  • CoorsTek Inc.
  • Corning Inc.
  • Feilihua Quartz Glass Ltd.
  • Helios Quartz Group
  • Heraeus Covantics
  • HOYA CORP.
  • Insanco Inc.
  • Jiurui Quartz Products Co. Ltd.
  • MARUWA CO. LTD.
  • Momentive Technologies Inc.
  • Ohara Corp.
  • Pacific Quartz Inc.
  • Pegasus Glass
  • QSIL SE
  • Raesch Quarz GmbH
  • S and S Optical Inc.
  • Shengfan Quartz Co. Ltd.
  • Shin-Etsu Quartz Co. Ltd.
  • Technical Glass Products Inc.
  • Tosoh Quartz Inc.
  • Zhong Cheng Quartz Glass Ltd.

Qualitative and quantitative analysis of companies has been conducted to help clients understand the wider business environment as well as the strengths and weaknesses of key industry players. Data is qualitatively analyzed to categorize companies as pure play, category-focused, industry-focused, and diversified; it is quantitatively analyzed to categorize companies as dominant, leading, strong, tentative, and weak.

Recent Development and News in Quartz glass market

  • In May 2025, QSIL SE announced a significant investment in energy-efficient melting technologies to upgrade its production facilities and reduce carbon emissions associated with its manufacturing processes.
  • In April 2025, Shin-Etsu Quartz Co. Ltd. announced an expansion of its ultra-high purity synthetic quartz glass production capacity to meet rising demand from leading-edge semiconductor manufacturers for EUV lithography materials.
  • In March 2025, Heraeus Quarzglas unveiled a new generation of automated fabrication lines for custom-designed quartz components, focusing on enhanced precision and reduced lead times for the quantum computing and advanced photonics sectors.
  • In February 2025, Verizon Communications Inc. detailed its accelerated plans for expanding its fiber optic network footprint across major US metropolitan areas, directly bolstering demand for quartz glass as a core material for optical fibers.

Dive into Technavio’s robust research methodology, blending expert interviews, extensive data synthesis, and validated models for unparalleled Quartz Glass Market insights. See full methodology.

Market Scope
Page number 316
Base year 2024
Historic period 2019-2023
Forecast period 2025-2029
Growth momentum & CAGR Accelerate at a CAGR of 6.8%
Market growth 2025-2029 USD 1516.7 million
Market structure Fragmented
YoY growth 2024-2025(%) 6.4%
Key countries China, Japan, South Korea, India, Australia, Indonesia, US, Canada, Mexico, Germany, France, UK, Italy, Spain, The Netherlands, Saudi Arabia, UAE, South Africa, Israel, Turkey, Brazil, Argentina and Colombia
Competitive landscape Leading Companies, Market Positioning of Companies, Competitive Strategies, and Industry Risks

Request Free Sample

Research Analyst Overview

  • The global quartz glass market 2025-2029 is fundamentally driven by its critical role as an enabling material in high-tech industries. Its value is defined by properties like ultra-high purity quartz, exceptional thermal shock resistance, and a low thermal expansion coefficient. The semiconductor sector's demand for flawless photomask substrates, semiconductor etch chambers, and EUV lithography components underpins market stability.
  • Components such as quartz furnace tubes and high-purity quartz crucibles are integral to wafer processing equipment. Boardroom decisions are increasingly influenced by the need to secure a stable supply of these materials, as a disruption in the availability of high-purity optical fiber preforms can delay infrastructure projects by months.
  • The material's chemical inertness, UV transparency, and high-temperature stability are non-negotiable for advanced applications. Innovations in processing the core silicon dioxide matrix, achieving hydroxyl content reduction, and ensuring superior optical homogeneity in clear quartz glass, synthetic quartz glass, and fused quartz glass are key differentiators.
  • The development of specialized opaque quartz glass and radiation resistant glass for niche applications further expands its utility, with advanced fabrication techniques enabling a 30% reduction in component defects for deep ultraviolet lithography systems.

What are the Key Data Covered in this Quartz Glass Market Research and Growth Report?

  • What is the expected growth of the Quartz Glass Market between 2025 and 2029?

    • USD 1.52 billion, at a CAGR of 6.8%

  • What segmentation does the market report cover?

    • The report is segmented by Product Type (Fused quartz glass, Synthetic quartz glass, Opaque quartz glass, and Clear quartz glass), Application (Semiconductors and electronics, Photovoltaics and solar energy, Optical and telecommunication components, Lighting and lamp manufacturing, and Others), Distribution Channel (Direct supply to OEMs, Authorised distributors, Online industrial portals, and Speciality materials retailers) and Geography (APAC, North America, Europe, Middle East and Africa, South America)

  • Which regions are analyzed in the report?

    • APAC, North America, Europe, Middle East and Africa and South America

  • What are the key growth drivers and market challenges?

    • Growth in semiconductor industry, High manufacturing costs

  • Who are the major players in the Quartz Glass Market?

    • AGC Inc., CoorsTek Inc., Corning Inc., Feilihua Quartz Glass Ltd., Helios Quartz Group, Heraeus Covantics, HOYA CORP., Insanco Inc., Jiurui Quartz Products Co. Ltd., MARUWA CO. LTD., Momentive Technologies Inc., Ohara Corp., Pacific Quartz Inc., Pegasus Glass, QSIL SE, Raesch Quarz GmbH, S and S Optical Inc., Shengfan Quartz Co. Ltd., Shin-Etsu Quartz Co. Ltd., Technical Glass Products Inc., Tosoh Quartz Inc. and Zhong Cheng Quartz Glass Ltd.

Market Research Insights

  • The market's dynamics are shaped by intense technological demands, where material performance directly impacts end-product viability. The shift toward precision metrology tools and advanced photonics components necessitates materials with unparalleled quality, driving innovation in custom fabricated quartz.
  • In semiconductor applications, the use of superior quartz in plasma etching parts has been shown to improve process uniformity by up to 15%, a critical factor for chip yield. Similarly, the development of high-efficiency germicidal UV lamps relies on quartz with specific transmission properties, where a 5% improvement in UV throughput can significantly enhance sterilization efficacy.
  • This focus on performance is also evident in photovoltaic silicon production, where crucible purity is essential. These factors, combined with supply chain pressures for molten metal handling materials and components for UV curing systems, create a landscape where technical superiority and operational efficiency define competitive advantage.

We can help! Our analysts can customize this quartz glass market research report to meet your requirements.

Get in touch

1. Executive Summary

1.1 Market overview

Executive Summary - Chart on Market Overview
Executive Summary - Data Table on Market Overview
Executive Summary - Chart on Global Market Characteristics
Executive Summary - Chart on Market by Geography
Executive Summary - Chart on Market Segmentation by Product Type
Executive Summary - Chart on Market Segmentation by Application
Executive Summary - Chart on Market Segmentation by Distribution Channel
Executive Summary - Chart on Incremental Growth
Executive Summary - Data Table on Incremental Growth
Executive Summary - Chart on Company Market Positioning

2. Technavio Analysis

2.1 Analysis of price sensitivity, lifecycle, customer purchase basket, adoption rates, and purchase criteria

2.2 Criticality of inputs and Factors of differentiation

Chart on Overview on criticality of inputs and factors of differentiation

2.3 Factors of disruption

Chart on Overview on factors of disruption

2.4 Impact of drivers and challenges

Chart on Impact of drivers and challenges in 2024 and 2029

3. Market Landscape

3.1 Market ecosystem

Chart on Parent Market
Data Table on - Parent Market

3.2 Market characteristics

Chart on Market characteristics analysis

3.3 Value chain analysis

Chart on Value chain analysis

4. Market Sizing

4.1 Market definition

Data Table on Offerings of companies included in the market definition

4.2 Market segment analysis

Market segments

4.3 Market size 2024

4.4 Market outlook: Forecast for 2024-2029

Chart on Global - Market size and forecast 2024-2029 ($ million)
Data Table on Global - Market size and forecast 2024-2029 ($ million)
Chart on Global Market: Year-over-year growth 2024-2029 (%)
Data Table on Global Market: Year-over-year growth 2024-2029 (%)

5. Historic Market Size

5.1 Global Quartz Glass Market 2019 - 2023

Historic Market Size - Data Table on Global Quartz Glass Market 2019 - 2023 ($ million)

5.2 Product Type segment analysis 2019 - 2023

Historic Market Size - Product Type Segment 2019 - 2023 ($ million)

5.3 Application segment analysis 2019 - 2023

Historic Market Size - Application Segment 2019 - 2023 ($ million)

5.4 Distribution Channel segment analysis 2019 - 2023

Historic Market Size - Distribution Channel Segment 2019 - 2023 ($ million)

5.5 Geography segment analysis 2019 - 2023

Historic Market Size - Geography Segment 2019 - 2023 ($ million)

5.6 Country segment analysis 2019 - 2023

Historic Market Size - Country Segment 2019 - 2023 ($ million)

6. Qualitative Analysis

6.1 Impact of AI on global quartz glass market

7. Five Forces Analysis

7.1 Five forces summary

Five forces analysis - Comparison between 2024 and 2029

7.2 Bargaining power of buyers

Bargaining power of buyers - Impact of key factors 2024 and 2029

7.3 Bargaining power of suppliers

Bargaining power of suppliers - Impact of key factors in 2024 and 2029

7.4 Threat of new entrants

Threat of new entrants - Impact of key factors in 2024 and 2029

7.5 Threat of substitutes

Threat of substitutes - Impact of key factors in 2024 and 2029

7.6 Threat of rivalry

Threat of rivalry - Impact of key factors in 2024 and 2029

7.7 Market condition

Chart on Market condition - Five forces 2024 and 2029

8. Market Segmentation by Product Type

8.1 Market segments

Chart on Product Type - Market share 2024-2029 (%)
Data Table on Product Type - Market share 2024-2029 (%)

8.2 Comparison by Product Type

Chart on Comparison by Product Type
Data Table on Comparison by Product Type

8.3 Fused quartz glass - Market size and forecast 2024-2029

Chart on Fused quartz glass - Market size and forecast 2024-2029 ($ million)
Data Table on Fused quartz glass - Market size and forecast 2024-2029 ($ million)
Chart on Fused quartz glass - Year-over-year growth 2024-2029 (%)
Data Table on Fused quartz glass - Year-over-year growth 2024-2029 (%)

8.4 Synthetic quartz glass - Market size and forecast 2024-2029

Chart on Synthetic quartz glass - Market size and forecast 2024-2029 ($ million)
Data Table on Synthetic quartz glass - Market size and forecast 2024-2029 ($ million)
Chart on Synthetic quartz glass - Year-over-year growth 2024-2029 (%)
Data Table on Synthetic quartz glass - Year-over-year growth 2024-2029 (%)

8.5 Opaque quartz glass - Market size and forecast 2024-2029

Chart on Opaque quartz glass - Market size and forecast 2024-2029 ($ million)
Data Table on Opaque quartz glass - Market size and forecast 2024-2029 ($ million)
Chart on Opaque quartz glass - Year-over-year growth 2024-2029 (%)
Data Table on Opaque quartz glass - Year-over-year growth 2024-2029 (%)

8.6 Clear quartz glass - Market size and forecast 2024-2029

Chart on Clear quartz glass - Market size and forecast 2024-2029 ($ million)
Data Table on Clear quartz glass - Market size and forecast 2024-2029 ($ million)
Chart on Clear quartz glass - Year-over-year growth 2024-2029 (%)
Data Table on Clear quartz glass - Year-over-year growth 2024-2029 (%)

8.7 Market opportunity by Product Type

Market opportunity by Product Type ($ million)
Data Table on Market opportunity by Product Type ($ million)

9. Market Segmentation by Application

9.1 Market segments

Chart on Application - Market share 2024-2029 (%)
Data Table on Application - Market share 2024-2029 (%)

9.2 Comparison by Application

Chart on Comparison by Application
Data Table on Comparison by Application

9.3 Semiconductors and electronics - Market size and forecast 2024-2029

Chart on Semiconductors and electronics - Market size and forecast 2024-2029 ($ million)
Data Table on Semiconductors and electronics - Market size and forecast 2024-2029 ($ million)
Chart on Semiconductors and electronics - Year-over-year growth 2024-2029 (%)
Data Table on Semiconductors and electronics - Year-over-year growth 2024-2029 (%)

9.4 Photovoltaics and solar energy - Market size and forecast 2024-2029

Chart on Photovoltaics and solar energy - Market size and forecast 2024-2029 ($ million)
Data Table on Photovoltaics and solar energy - Market size and forecast 2024-2029 ($ million)
Chart on Photovoltaics and solar energy - Year-over-year growth 2024-2029 (%)
Data Table on Photovoltaics and solar energy - Year-over-year growth 2024-2029 (%)

9.5 Optical and telecommunication components - Market size and forecast 2024-2029

Chart on Optical and telecommunication components - Market size and forecast 2024-2029 ($ million)
Data Table on Optical and telecommunication components - Market size and forecast 2024-2029 ($ million)
Chart on Optical and telecommunication components - Year-over-year growth 2024-2029 (%)
Data Table on Optical and telecommunication components - Year-over-year growth 2024-2029 (%)

9.6 Lighting and lamp manufacturing - Market size and forecast 2024-2029

Chart on Lighting and lamp manufacturing - Market size and forecast 2024-2029 ($ million)
Data Table on Lighting and lamp manufacturing - Market size and forecast 2024-2029 ($ million)
Chart on Lighting and lamp manufacturing - Year-over-year growth 2024-2029 (%)
Data Table on Lighting and lamp manufacturing - Year-over-year growth 2024-2029 (%)

9.7 Others - Market size and forecast 2024-2029

Chart on Others - Market size and forecast 2024-2029 ($ million)
Data Table on Others - Market size and forecast 2024-2029 ($ million)
Chart on Others - Year-over-year growth 2024-2029 (%)
Data Table on Others - Year-over-year growth 2024-2029 (%)

9.8 Market opportunity by Application

Market opportunity by Application ($ million)
Data Table on Market opportunity by Application ($ million)

10. Market Segmentation by Distribution Channel

10.1 Market segments

Chart on Distribution Channel - Market share 2024-2029 (%)
Data Table on Distribution Channel - Market share 2024-2029 (%)

10.2 Comparison by Distribution Channel

Chart on Comparison by Distribution Channel
Data Table on Comparison by Distribution Channel

10.3 Direct supply to OEMs - Market size and forecast 2024-2029

Chart on Direct supply to OEMs - Market size and forecast 2024-2029 ($ million)
Data Table on Direct supply to OEMs - Market size and forecast 2024-2029 ($ million)
Chart on Direct supply to OEMs - Year-over-year growth 2024-2029 (%)
Data Table on Direct supply to OEMs - Year-over-year growth 2024-2029 (%)

10.4 Authorised distributors - Market size and forecast 2024-2029

Chart on Authorised distributors - Market size and forecast 2024-2029 ($ million)
Data Table on Authorised distributors - Market size and forecast 2024-2029 ($ million)
Chart on Authorised distributors - Year-over-year growth 2024-2029 (%)
Data Table on Authorised distributors - Year-over-year growth 2024-2029 (%)

10.5 Online industrial portals - Market size and forecast 2024-2029

Chart on Online industrial portals - Market size and forecast 2024-2029 ($ million)
Data Table on Online industrial portals - Market size and forecast 2024-2029 ($ million)
Chart on Online industrial portals - Year-over-year growth 2024-2029 (%)
Data Table on Online industrial portals - Year-over-year growth 2024-2029 (%)

10.6 Speciality materials retailers - Market size and forecast 2024-2029

Chart on Speciality materials retailers - Market size and forecast 2024-2029 ($ million)
Data Table on Speciality materials retailers - Market size and forecast 2024-2029 ($ million)
Chart on Speciality materials retailers - Year-over-year growth 2024-2029 (%)
Data Table on Speciality materials retailers - Year-over-year growth 2024-2029 (%)

10.7 Market opportunity by Distribution Channel

Market opportunity by Distribution Channel ($ million)
Data Table on Market opportunity by Distribution Channel ($ million)

11. Customer Landscape

11.1 Customer landscape overview

Analysis of price sensitivity, lifecycle, customer purchase basket, adoption rates, and purchase criteria

12. Geographic Landscape

12.1 Geographic segmentation

Chart on Market share by geography 2024-2029 (%)
Data Table on Market share by geography 2024-2029 (%)

12.2 Geographic comparison

Chart on Geographic comparison
Data Table on Geographic comparison

12.3 APAC - Market size and forecast 2024-2029

Chart on APAC - Market size and forecast 2024-2029 ($ million)
Data Table on APAC - Market size and forecast 2024-2029 ($ million)
Chart on APAC - Year-over-year growth 2024-2029 (%)
Data Table on APAC - Year-over-year growth 2024-2029 (%)
Chart on Regional Comparison - APAC
Data Table on Regional Comparison - APAC

12.3.1 China - Market size and forecast 2024-2029

Chart on China - Market size and forecast 2024-2029 ($ million)
Data Table on China - Market size and forecast 2024-2029 ($ million)
Chart on China - Year-over-year growth 2024-2029 (%)
Data Table on China - Year-over-year growth 2024-2029 (%)

12.3.2 Japan - Market size and forecast 2024-2029

Chart on Japan - Market size and forecast 2024-2029 ($ million)
Data Table on Japan - Market size and forecast 2024-2029 ($ million)
Chart on Japan - Year-over-year growth 2024-2029 (%)
Data Table on Japan - Year-over-year growth 2024-2029 (%)

12.3.3 South Korea - Market size and forecast 2024-2029

Chart on South Korea - Market size and forecast 2024-2029 ($ million)
Data Table on South Korea - Market size and forecast 2024-2029 ($ million)
Chart on South Korea - Year-over-year growth 2024-2029 (%)
Data Table on South Korea - Year-over-year growth 2024-2029 (%)

12.3.4 India - Market size and forecast 2024-2029

Chart on India - Market size and forecast 2024-2029 ($ million)
Data Table on India - Market size and forecast 2024-2029 ($ million)
Chart on India - Year-over-year growth 2024-2029 (%)
Data Table on India - Year-over-year growth 2024-2029 (%)

12.3.5 Australia - Market size and forecast 2024-2029

Chart on Australia - Market size and forecast 2024-2029 ($ million)
Data Table on Australia - Market size and forecast 2024-2029 ($ million)
Chart on Australia - Year-over-year growth 2024-2029 (%)
Data Table on Australia - Year-over-year growth 2024-2029 (%)

12.3.6 Indonesia - Market size and forecast 2024-2029

Chart on Indonesia - Market size and forecast 2024-2029 ($ million)
Data Table on Indonesia - Market size and forecast 2024-2029 ($ million)
Chart on Indonesia - Year-over-year growth 2024-2029 (%)
Data Table on Indonesia - Year-over-year growth 2024-2029 (%)

12.4 North America - Market size and forecast 2024-2029

Chart on North America - Market size and forecast 2024-2029 ($ million)
Data Table on North America - Market size and forecast 2024-2029 ($ million)
Chart on North America - Year-over-year growth 2024-2029 (%)
Data Table on North America - Year-over-year growth 2024-2029 (%)
Chart on Regional Comparison - North America
Data Table on Regional Comparison - North America

12.4.1 US - Market size and forecast 2024-2029

Chart on US - Market size and forecast 2024-2029 ($ million)
Data Table on US - Market size and forecast 2024-2029 ($ million)
Chart on US - Year-over-year growth 2024-2029 (%)
Data Table on US - Year-over-year growth 2024-2029 (%)

12.4.2 Canada - Market size and forecast 2024-2029

Chart on Canada - Market size and forecast 2024-2029 ($ million)
Data Table on Canada - Market size and forecast 2024-2029 ($ million)
Chart on Canada - Year-over-year growth 2024-2029 (%)
Data Table on Canada - Year-over-year growth 2024-2029 (%)

12.4.3 Mexico - Market size and forecast 2024-2029

Chart on Mexico - Market size and forecast 2024-2029 ($ million)
Data Table on Mexico - Market size and forecast 2024-2029 ($ million)
Chart on Mexico - Year-over-year growth 2024-2029 (%)
Data Table on Mexico - Year-over-year growth 2024-2029 (%)

12.5 Europe - Market size and forecast 2024-2029

Chart on Europe - Market size and forecast 2024-2029 ($ million)
Data Table on Europe - Market size and forecast 2024-2029 ($ million)
Chart on Europe - Year-over-year growth 2024-2029 (%)
Data Table on Europe - Year-over-year growth 2024-2029 (%)
Chart on Regional Comparison - Europe
Data Table on Regional Comparison - Europe

12.5.1 Germany - Market size and forecast 2024-2029

Chart on Germany - Market size and forecast 2024-2029 ($ million)
Data Table on Germany - Market size and forecast 2024-2029 ($ million)
Chart on Germany - Year-over-year growth 2024-2029 (%)
Data Table on Germany - Year-over-year growth 2024-2029 (%)

12.5.2 France - Market size and forecast 2024-2029

Chart on France - Market size and forecast 2024-2029 ($ million)
Data Table on France - Market size and forecast 2024-2029 ($ million)
Chart on France - Year-over-year growth 2024-2029 (%)
Data Table on France - Year-over-year growth 2024-2029 (%)

12.5.3 UK - Market size and forecast 2024-2029

Chart on UK - Market size and forecast 2024-2029 ($ million)
Data Table on UK - Market size and forecast 2024-2029 ($ million)
Chart on UK - Year-over-year growth 2024-2029 (%)
Data Table on UK - Year-over-year growth 2024-2029 (%)

12.5.4 Italy - Market size and forecast 2024-2029

Chart on Italy - Market size and forecast 2024-2029 ($ million)
Data Table on Italy - Market size and forecast 2024-2029 ($ million)
Chart on Italy - Year-over-year growth 2024-2029 (%)
Data Table on Italy - Year-over-year growth 2024-2029 (%)

12.5.5 Spain - Market size and forecast 2024-2029

Chart on Spain - Market size and forecast 2024-2029 ($ million)
Data Table on Spain - Market size and forecast 2024-2029 ($ million)
Chart on Spain - Year-over-year growth 2024-2029 (%)
Data Table on Spain - Year-over-year growth 2024-2029 (%)

12.5.6 The Netherlands - Market size and forecast 2024-2029

Chart on The Netherlands - Market size and forecast 2024-2029 ($ million)
Data Table on The Netherlands - Market size and forecast 2024-2029 ($ million)
Chart on The Netherlands - Year-over-year growth 2024-2029 (%)
Data Table on The Netherlands - Year-over-year growth 2024-2029 (%)

12.6 Middle East and Africa - Market size and forecast 2024-2029

Chart on Middle East and Africa - Market size and forecast 2024-2029 ($ million)
Data Table on Middle East and Africa - Market size and forecast 2024-2029 ($ million)
Chart on Middle East and Africa - Year-over-year growth 2024-2029 (%)
Data Table on Middle East and Africa - Year-over-year growth 2024-2029 (%)
Chart on Regional Comparison - Middle East and Africa
Data Table on Regional Comparison - Middle East and Africa

12.6.1 Saudi Arabia - Market size and forecast 2024-2029

Chart on Saudi Arabia - Market size and forecast 2024-2029 ($ million)
Data Table on Saudi Arabia - Market size and forecast 2024-2029 ($ million)
Chart on Saudi Arabia - Year-over-year growth 2024-2029 (%)
Data Table on Saudi Arabia - Year-over-year growth 2024-2029 (%)

12.6.2 UAE - Market size and forecast 2024-2029

Chart on UAE - Market size and forecast 2024-2029 ($ million)
Data Table on UAE - Market size and forecast 2024-2029 ($ million)
Chart on UAE - Year-over-year growth 2024-2029 (%)
Data Table on UAE - Year-over-year growth 2024-2029 (%)

12.6.3 South Africa - Market size and forecast 2024-2029

Chart on South Africa - Market size and forecast 2024-2029 ($ million)
Data Table on South Africa - Market size and forecast 2024-2029 ($ million)
Chart on South Africa - Year-over-year growth 2024-2029 (%)
Data Table on South Africa - Year-over-year growth 2024-2029 (%)

12.6.4 Israel - Market size and forecast 2024-2029

Chart on Israel - Market size and forecast 2024-2029 ($ million)
Data Table on Israel - Market size and forecast 2024-2029 ($ million)
Chart on Israel - Year-over-year growth 2024-2029 (%)
Data Table on Israel - Year-over-year growth 2024-2029 (%)

12.6.5 Turkey - Market size and forecast 2024-2029

Chart on Turkey - Market size and forecast 2024-2029 ($ million)
Data Table on Turkey - Market size and forecast 2024-2029 ($ million)
Chart on Turkey - Year-over-year growth 2024-2029 (%)
Data Table on Turkey - Year-over-year growth 2024-2029 (%)

12.7 South America - Market size and forecast 2024-2029

Chart on South America - Market size and forecast 2024-2029 ($ million)
Data Table on South America - Market size and forecast 2024-2029 ($ million)
Chart on South America - Year-over-year growth 2024-2029 (%)
Data Table on South America - Year-over-year growth 2024-2029 (%)
Chart on Regional Comparison - South America
Data Table on Regional Comparison - South America

12.7.1 Brazil - Market size and forecast 2024-2029

Chart on Brazil - Market size and forecast 2024-2029 ($ million)
Data Table on Brazil - Market size and forecast 2024-2029 ($ million)
Chart on Brazil - Year-over-year growth 2024-2029 (%)
Data Table on Brazil - Year-over-year growth 2024-2029 (%)

12.7.2 Argentina - Market size and forecast 2024-2029

Chart on Argentina - Market size and forecast 2024-2029 ($ million)
Data Table on Argentina - Market size and forecast 2024-2029 ($ million)
Chart on Argentina - Year-over-year growth 2024-2029 (%)
Data Table on Argentina - Year-over-year growth 2024-2029 (%)

12.7.3 Colombia - Market size and forecast 2024-2029

Chart on Colombia - Market size and forecast 2024-2029 ($ million)
Data Table on Colombia - Market size and forecast 2024-2029 ($ million)
Chart on Colombia - Year-over-year growth 2024-2029 (%)
Data Table on Colombia - Year-over-year growth 2024-2029 (%)

12.8 Market opportunity by geography

Market opportunity by geography ($ million)
Data Tables on Market opportunity by geography ($ million)

13. Drivers, Challenges, and Opportunity

13.1 Market drivers

Growth in semiconductor industry
Expansion of fiber optic networks
Growth in photovoltaic and lighting industries

13.2 Market challenges

High manufacturing costs
Supply chain vulnerabilities and raw material scarcity
Technological advancements and alternative materials

13.3 Impact of drivers and challenges

Impact of drivers and challenges in 2024 and 2029

13.4 Market opportunities

Increasing Demand for Ultra-High Purity Quartz
Technological Advancements in Fabrication
Sustainability and Energy Efficiency Initiatives

14. Competitive Landscape

14.1 Overview

14.2

Overview on criticality of inputs and factors of differentiation

14.3 Landscape disruption

Overview on factors of disruption

14.4 Industry risks

Impact of key risks on business

15. Competitive Analysis

15.1 Companies profiled

Companies covered

15.2 Company ranking index

15.3 Market positioning of companies

Matrix on companies position and classification

15.4 AGC Inc.

AGC Inc. - Overview
AGC Inc. - Business segments
AGC Inc. - Key news
AGC Inc. - Key offerings
AGC Inc. - Segment focus
SWOT

15.5 CoorsTek Inc.

CoorsTek Inc. - Overview
CoorsTek Inc. - Product / Service
CoorsTek Inc. - Key offerings
SWOT

15.6 Corning Inc.

Corning Inc. - Overview
Corning Inc. - Business segments
Corning Inc. - Key offerings
Corning Inc. - Segment focus
SWOT

15.7 Feilihua Quartz Glass Ltd.

Feilihua Quartz Glass Ltd. - Overview
Feilihua Quartz Glass Ltd. - Product / Service
Feilihua Quartz Glass Ltd. - Key offerings
SWOT

15.8 Helios Quartz Group

Helios Quartz Group - Overview
Helios Quartz Group - Product / Service
Helios Quartz Group - Key offerings
SWOT

15.9 Heraeus Covantics

Heraeus Covantics - Overview
Heraeus Covantics - Product / Service
Heraeus Covantics - Key offerings
SWOT

15.10 HOYA CORP.

HOYA CORP. - Overview
HOYA CORP. - Business segments
HOYA CORP. - Key offerings
HOYA CORP. - Segment focus
SWOT

15.11 MARUWA CO. LTD.

MARUWA CO. LTD. - Overview
MARUWA CO. LTD. - Product / Service
MARUWA CO. LTD. - Key offerings
SWOT

15.12 Momentive Technologies Inc.

Momentive Technologies Inc. - Overview
Momentive Technologies Inc. - Product / Service
Momentive Technologies Inc. - Key offerings
SWOT

15.13 Ohara Corp.

Ohara Corp. - Overview
Ohara Corp. - Product / Service
Ohara Corp. - Key offerings
SWOT

15.14 Pacific Quartz Inc.

Pacific Quartz Inc. - Overview
Pacific Quartz Inc. - Product / Service
Pacific Quartz Inc. - Key offerings
SWOT

15.15 QSIL SE

QSIL SE - Overview
QSIL SE - Product / Service
QSIL SE - Key offerings
SWOT

15.16 Shin-Etsu Quartz Co. Ltd.

Shin-Etsu Quartz Co. Ltd. - Overview
Shin-Etsu Quartz Co. Ltd. - Product / Service
Shin-Etsu Quartz Co. Ltd. - Key offerings
SWOT

15.17 Technical Glass Products Inc.

Technical Glass Products Inc. - Overview
Technical Glass Products Inc. - Product / Service
Technical Glass Products Inc. - Key offerings
SWOT

15.18 Tosoh Quartz Inc.

Tosoh Quartz Inc. - Overview
Tosoh Quartz Inc. - Product / Service
Tosoh Quartz Inc. - Key offerings
SWOT

16. Appendix

16.1 Scope of the report

Market definition
Objectives
Notes and caveats

16.2 Inclusions and exclusions checklist

Inclusions checklist
Exclusions checklist

16.3 Currency conversion rates for US$

16.4 Research methodology

16.5 Data procurement

Information sources

16.6 Data validation

16.7 Validation techniques employed for market sizing

16.8 Data synthesis

16.9 360 degree market analysis

16.10 List of abbreviations

Research Methodology

Technavio presents a detailed picture of the market by way of study, synthesis, and summation of data from multiple sources. The analysts have presented the various facets of the market with a particular focus on identifying the key industry influencers. The data thus presented is comprehensive, reliable, and the result of extensive research, both primary and secondary.

INFORMATION SOURCES

Primary sources

  • Manufacturers and suppliers
  • Channel partners
  • Industry experts
  • Strategic decision makers

Secondary sources

  • Industry journals and periodicals
  • Government data
  • Financial reports of key industry players
  • Historical data
  • Press releases

DATA ANALYSIS

Data Synthesis

  • Collation of data
  • Estimation of key figures
  • Analysis of derived insights

Data Validation

  • Triangulation with data models
  • Reference against proprietary databases
  • Corroboration with industry experts

REPORT WRITING

Qualitative

  • Market drivers
  • Market challenges
  • Market trends
  • Five forces analysis

Quantitative

  • Market size and forecast
  • Market segmentation
  • Geographical insights
  • Competitive landscape

Interested in this report?

Get your sample now to see our research methodology and insights!

Download Now

Frequently Asked Questions

Quartz Glass market growth will increase by USD 1516.7 million during 2025-2029.

The Quartz Glass market is expected to grow at a CAGR of 6.8% during 2025-2029.

Quartz Glass market is segmented by Product type (Fused quartz glass, Synthetic quartz glass, Opaque quartz glass, Clear quartz glass) Application (Semiconductors and electronics, Photovoltaics and solar energy, Optical and telecommunication components, Lighting and lamp manufacturing, Others) Distribution channel (Direct supply to OEMs, Authorised distributors, Online industrial portals, Speciality materials retailers)

AGC Inc., CoorsTek Inc., Corning Inc., Feilihua Quartz Glass Ltd., Helios Quartz Group, Heraeus Covantics, HOYA CORP., Insanco Inc., Jiurui Quartz Products Co. Ltd., MARUWA CO. LTD., Momentive Technologies Inc., Ohara Corp., Pacific Quartz Inc., Pegasus Glass, QSIL SE, Raesch Quarz GmbH, S and S Optical Inc., Shengfan Quartz Co. Ltd., Shin-Etsu Quartz Co. Ltd., Technical Glass Products Inc., Tosoh Quartz Inc., Zhong Cheng Quartz Glass Ltd. are a few of the key vendors in the Quartz Glass market.

APAC will register the highest growth rate of 49.5% among the other regions. Therefore, the Quartz Glass market in APAC is expected to garner significant business opportunities for the vendors during the forecast period.

China, Japan, South Korea, India, Australia, Indonesia, US, Canada, Mexico, Germany, France, UK, Italy, Spain, The Netherlands, Saudi Arabia, UAE, South Africa, Israel, Turkey, Brazil, Argentina, Colombia

  • Growth in semiconductor industry is the driving factor this market.

The Quartz Glass market vendors should focus on grabbing business opportunities from the Product type segment as it accounted for the largest market share in the base year.