Raw Sugar Market Analysis, Size, and Forecast 2026-2030: APAC (India, China, and Australia), South America (Brazil and Argentina), Europe (France, Germany, and UK), North America (US, Mexico, and Canada), Middle East and Africa (South Africa, Turkey, and Israel), and Rest of World (ROW)

Raw Sugar Market Analysis, Size, and Forecast 2026-2030:
APAC (India, China, and Australia), South America (Brazil and Argentina), Europe (France, Germany, and UK), North America (US, Mexico, and Canada), Middle East and Africa (South Africa, Turkey, and Israel), and Rest of World (ROW)

Published: Mar 2026 290 Pages SKU: IRTNTR75289

Market Overview at a Glance

$156.4 Mn
Market Opportunity
2.3%
CAGR 2025 - 2030
40.7%
APAC Growth
$773.4 Mn
Liquid sugar segment 2024

Raw Sugar Market Size 2026-2030

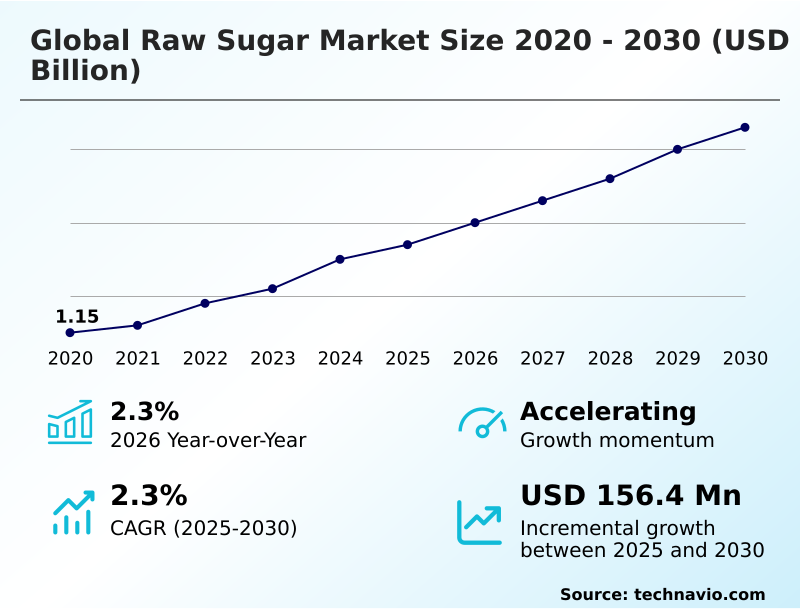
The raw sugar market size is valued to increase by USD 156.4 million, at a CAGR of 2.3% from 2025 to 2030. Global production surpluses and industrialization of stock recovery will drive the raw sugar market.

Major Market Trends & Insights

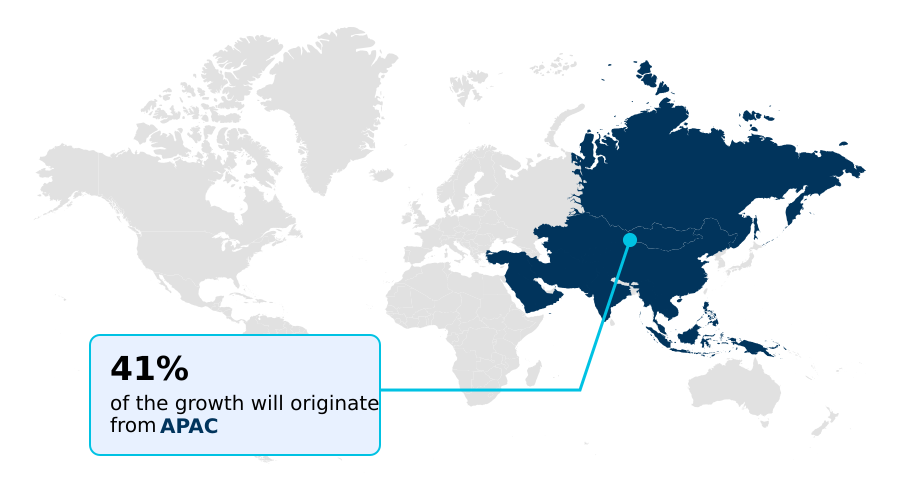
  • APAC dominated the market and accounted for a 40.7% growth during the forecast period.
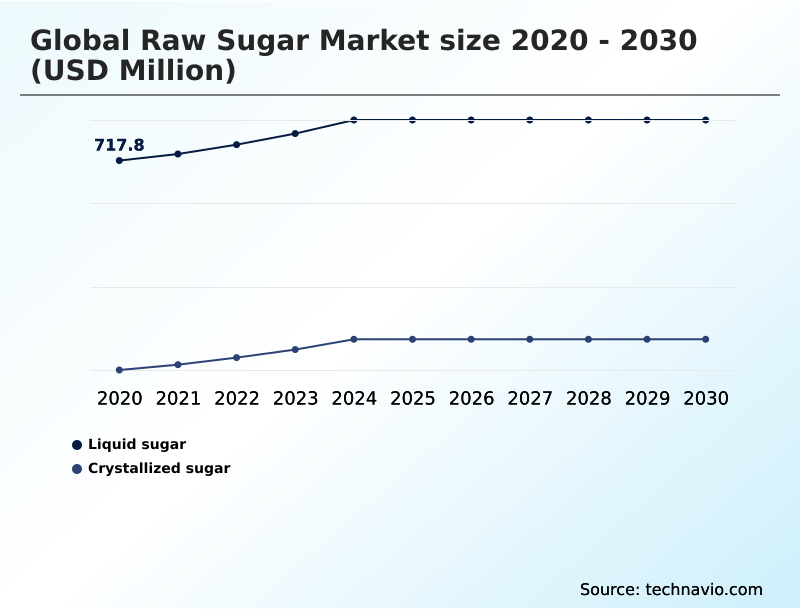
  • By Product - Liquid sugar segment was valued at USD 773.4 million in 2024
  • By Type - Conventional segment accounted for the largest market revenue share in 2024

Market Size & Forecast

  • Market Opportunities: USD 282.3 million
  • Market Future Opportunities: USD 156.4 million
  • CAGR from 2025 to 2030 : 2.3%

Market Summary

  • The raw sugar market is undergoing a fundamental shift, moving from supply tightness to a period of structural surplus, which is reshaping price dynamics and competitive strategies. This transition is driven by favorable agricultural yields in key production zones and the strategic flexibility of mills to divert sugarcane between sugar and ethanol production.
  • A key trend transforming the sector is the integration of digital technologies, such as AI-driven precision agriculture, which enhances cane-to-mill logistics and improves extraction efficiency. Concurrently, the industry is navigating significant challenges, including downward price pressure from oversupply and escalating regulatory scrutiny aimed at curbing sugar consumption.
  • For instance, a global beverage manufacturer must now leverage advanced supply chain analytics to source traceable, sustainably certified sugar to comply with new ESG mandates, mitigating risks from both climate volatility and shifting consumer health preferences. This environment favors producers who can master cost optimization, embrace regenerative agriculture, and innovate toward value-added specialty sugars to maintain profitability.

What will be the Size of the Raw Sugar Market during the forecast period?

Get Key Insights on Market Forecast (PDF) Request Free Sample

How is the Raw Sugar Market Segmented?

The raw sugar industry research report provides comprehensive data (region-wise segment analysis), with forecasts and estimates in "USD million" for the period 2026-2030, as well as historical data from 2020-2024 for the following segments.

  • Product
    • Liquid sugar
    • Crystallized sugar
  • Type
    • Conventional
    • Organic
  • Application
    • Beverages
    • Confectionery and bakery
    • Dairy products
    • Others
  • Geography
    • APAC
      • India
      • China
      • Australia
    • South America
      • Brazil
      • Argentina
    • Europe
      • France
      • Germany
      • UK
    • North America
      • US
      • Mexico
      • Canada
    • Middle East and Africa
      • South Africa
      • Turkey
      • Israel
    • Rest of World (ROW)

By Product Insights

The liquid sugar segment is estimated to witness significant growth during the forecast period.

The liquid sugar segment caters to industrial users requiring rapid solubility and precise blending, particularly in beverage and pharmaceutical applications.

This segment, including liquid sucrose and invert sugar syrups, streamlines manufacturing by eliminating the energy-intensive dissolution phase associated with crystallized sugar. Adoption is driven by operational efficiencies, such as improving blending precision by up to 15% in automated facilities.

Enhanced food safety protocols, due to enclosed handling systems, and the demand for high-clarity syrups for clear beverages also fuel growth.

While specialized transport adds complexity, the logistical benefits of automated dosing in modern smart factories provide a compelling economic case for this high-growth category, which uses high-intensity sweeteners and is subject to feedstock flexibility.

Request Free Sample

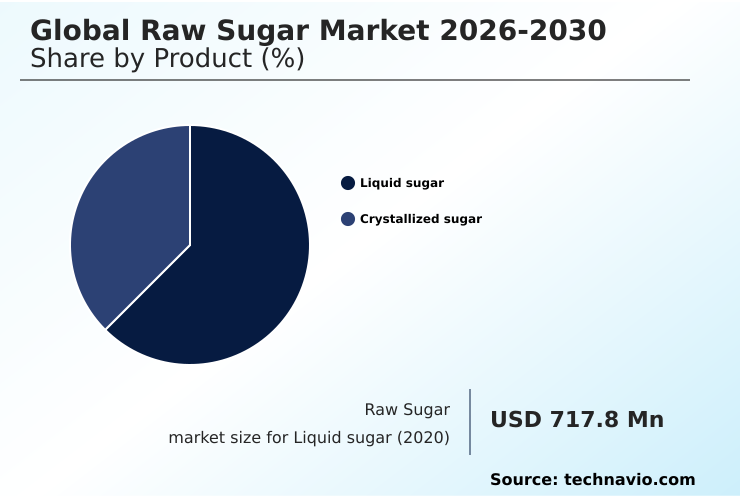
The Liquid sugar segment was valued at USD 773.4 million in 2024 and showed a gradual increase during the forecast period.

Request Free Sample

Regional Analysis

APAC is estimated to contribute 40.7% to the growth of the global market during the forecast period.Technavio’s analysts have elaborately explained the regional trends and drivers that shape the market during the forecast period.

See How Raw Sugar Market Demand is Rising in APAC Request Free Sample

The geographic landscape is dominated by distinct regional dynamics. APAC is the primary center for consumption growth, accounting for over 40% of the market's incremental growth, driven by industrial demand in China and India.

South America, led by Brazil, acts as the global balancing supplier, with its unique mill flexibility influencing global price benchmarks. The regional market is also seeing increased use of commodity trading software.

In contrast, Europe's market is defined by a mature beet sugar industry facing a 5% decline in production, increasing its reliance on raw cane sugar imports that meet stringent sustainability standards.

North America operates under a managed quota system, balancing domestic production with strategic imports. These regional distinctions, including different approaches to sugarcane-to-ethanol flexibility, shape global trade flows and investment priorities for market participants.

Market Dynamics

Our researchers analyzed the data with 2025 as the base year, along with the key drivers, trends, and challenges. A holistic analysis of drivers will help companies refine their marketing strategies to gain a competitive advantage.

  • Strategic decision-making in the raw sugar market now centers on navigating a complex web of agricultural and economic factors. Optimizing the sugarcane crush mix for ethanol production requires sophisticated analysis of energy market parity against sugar futures.
  • Furthermore, the adoption of regenerative agriculture and soil carbon sequestration is no longer a niche practice but a core component of securing premium contracts with global food brands. As part of this, managing ratoon crop degradation through advanced soil health techniques is essential for long-term yield stability.
  • Companies are also investing in the sugarcane bagasse valorization into bioplastics, creating new revenue streams from what was once waste. The ability to produce low-glycemic index (GI) cane sugars and other differentiated specialty sugar ingredients allows producers to capture value in health-conscious markets.
  • Implementing satellite-based precision harvesting in sugarcane farming has become critical, with integrated systems improving logistical efficiency by over 15% compared to traditional methods. Simultaneously, addressing the impact of GLP-1 medications on sugar demand requires a strategic pivot toward industrial applications and emerging economies.
  • Effective feedstock utilization strategies for raw sugar and the management of government import quotas in Asia are fundamental to maintaining market share in this evolving landscape.

What are the key market drivers leading to the rise in the adoption of Raw Sugar Industry?

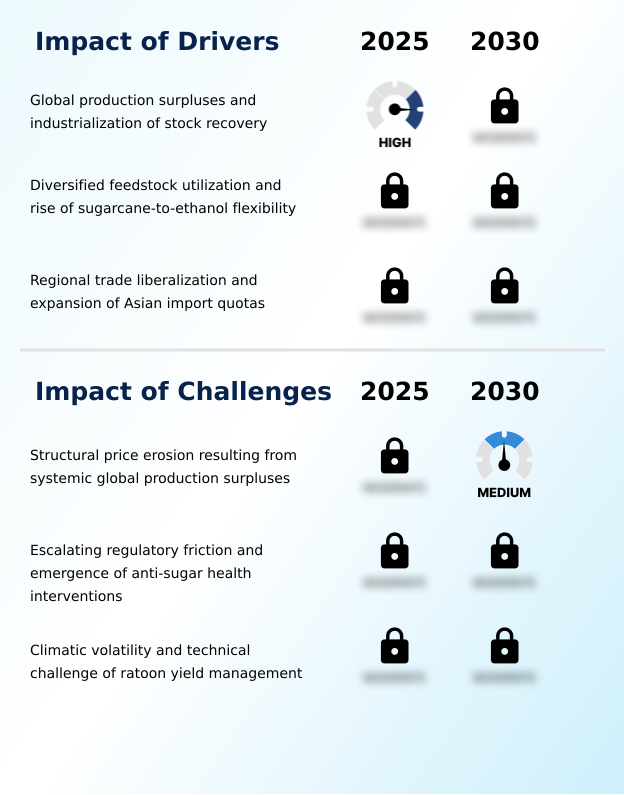
  • A key market driver is the emergence of global production surpluses, which facilitates the industrialization of stock recovery and reshapes supply-side dynamics.

  • Market growth is significantly influenced by a structural shift toward a global production surplus, which is stabilizing raw material costs for industrial users after years of supply tightness.
  • This surplus, estimated at over 10 million metric tons, is a direct result of favorable yields in major producing regions.
  • Another powerful driver is the enhanced feedstock utilization strategies, particularly the ability of mills in Brazil and India to pivot between raw sugar and ethanol based on energy market parity.
  • This flexibility allows producers to hedge against price declines, with Brazilian mills recently increasing their sugar mix to over 50%.
  • Furthermore, regional trade liberalization, such as the management of Asian import quotas, provides critical outlets for excess production and maintains fluidity in the seaborne trade.

What are the market trends shaping the Raw Sugar Industry?

  • The integration of AI and satellite-based precision harvesting is emerging as a key trend. This technology optimizes the cane-to-mill logistics chain and maximizes juice extraction efficiency.

  • Key trends are reshaping the market's competitive landscape. The integration of AI and remote sensing is optimizing the entire cane-to-mill logistics chain, with predictive models improving yield forecasts by over 20% and ensuring peak juice extraction efficiency. This digital transformation is reducing operational waste.
  • Another significant trend is the expansion of regenerative agriculture, where practices like cover cropping and the use of bio-organic fertilizers are helping rebuild soil health. Leading producers adopting these methods report a 5% annual increase in soil carbon, which is crucial for meeting corporate ESG goals.
  • The market is also diversifying with the emergence of differentiated specialty sugars and other functional ingredients, including non-gmo specialty sugars, driven by consumer demand for clean-label and healthier alternatives.

What challenges does the Raw Sugar Industry face during its growth?

  • Structural price erosion, stemming from systemic global production surpluses, presents a significant challenge to industry growth and profitability.

  • The market confronts several significant challenges, led by structural price erosion from a persistent global production surplus. This oversupply has caused raw sugar futures to decline by as much as 35% from the prior year, severely impacting the profitability of producers, especially those with higher operational costs.
  • Another major headwind is the escalating regulatory friction, with governments worldwide implementing sugar taxes and front-of-package warning labels. Compounding this, climatic volatility and the technical difficulty of ratoon yield management present ongoing agricultural risks.
  • Erratic weather patterns can reduce sugar recovery rates by up to 10% in a single season, making long-term production planning exceptionally difficult and threatening supply chain stability and commodity price stabilization.

Exclusive Technavio Analysis on Customer Landscape

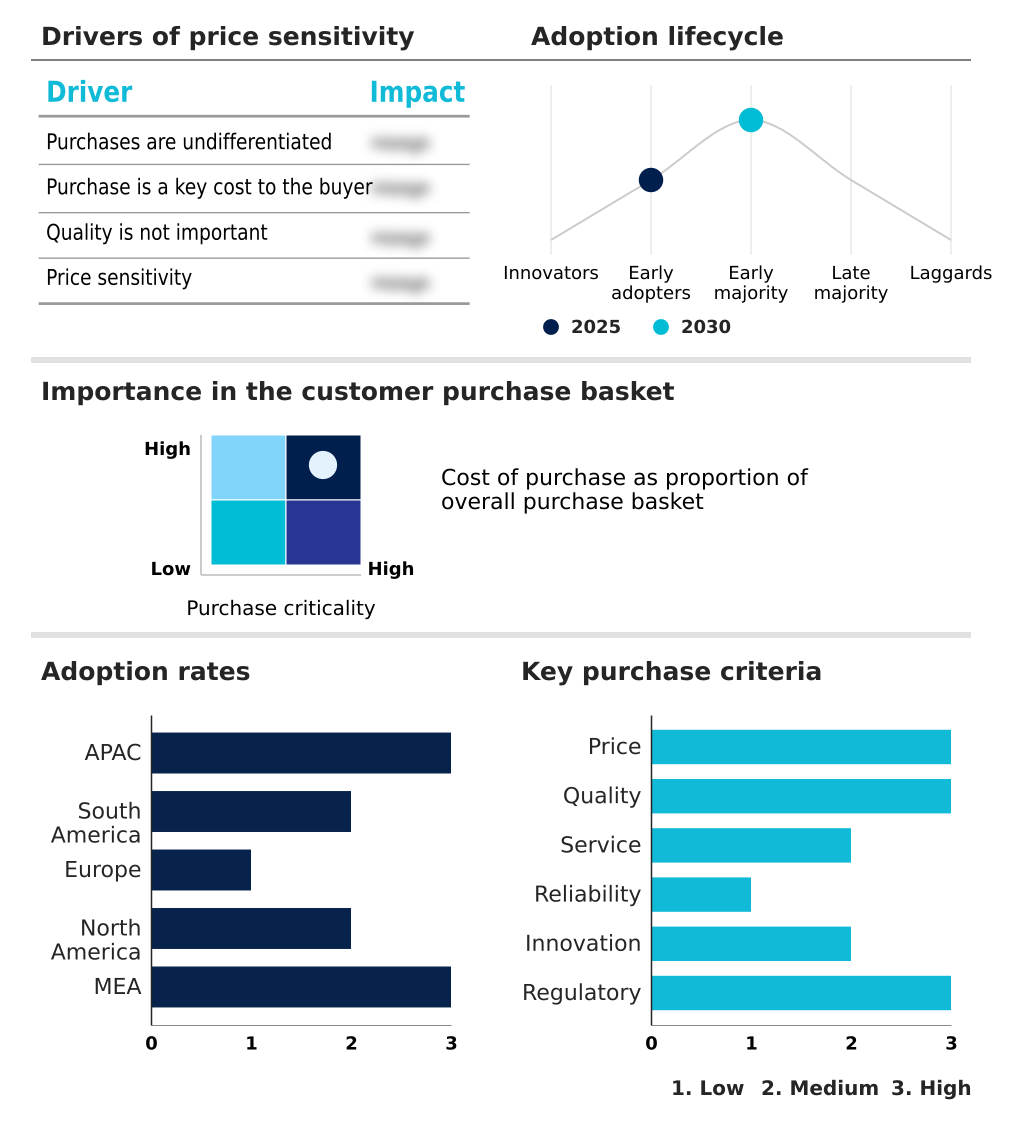
The raw sugar market forecasting report includes the adoption lifecycle of the market, covering from the innovator’s stage to the laggard’s stage. It focuses on adoption rates in different regions based on penetration. Furthermore, the raw sugar market report also includes key purchase criteria and drivers of price sensitivity to help companies evaluate and develop their market growth analysis strategies.

Customer Landscape of Raw Sugar Industry

Competitive Landscape

Companies are implementing various strategies, such as strategic alliances, raw sugar market forecast, partnerships, mergers and acquisitions, geographical expansion, and product/service launches, to enhance their presence in the industry.

Adecoagro SA - Offerings include sustainably produced cane sugar integrated with renewable energy and ethanol operations, focusing on vertically integrated supply chain efficiency and commodity-grade feedstock.

The industry research and growth report includes detailed analyses of the competitive landscape of the market and information about key companies, including:

  • Adecoagro SA
  • Balrampur Chini Mills Ltd.
  • Central Romana Corp.
  • Dalmia Bharat Sugar Ltd
  • Dhampur Bio Organics Ltd.
  • EID Parry India Ltd.
  • Florida Crystals Corp.
  • Illovo Sugar
  • Ingenio Magdalena
  • Mackay Sugar
  • Mitr Phol Group
  • Pantaleon
  • Shree Renuka Sugars Ltd.
  • Sudzucker AG
  • Tereos Participations
  • Thai Roong Ruang Group
  • Triveni Industries Ltd.
  • Wilmar International Ltd.

Qualitative and quantitative analysis of companies has been conducted to help clients understand the wider business environment as well as the strengths and weaknesses of key industry players. Data is qualitatively analyzed to categorize companies as pure play, category-focused, industry-focused, and diversified; it is quantitatively analyzed to categorize companies as dominant, leading, strong, tentative, and weak.

Recent Development and News in Raw sugar market

  • In September 2024, a leading South American producer announced the full-scale deployment of an AI-powered satellite monitoring system across its plantations to optimize harvest timing, projecting a 10% increase in total recoverable sugar.
  • In November 2024, a major European refiner entered a strategic partnership with a technology firm to implement a blockchain-based traceability platform, ensuring end-to-end verification of its fair-trade and non-GMO sugar supply chains.
  • In February 2025, an APAC-based agricultural conglomerate acquired a portfolio of organic sugar brands to expand its presence in the high-value specialty ingredients market, catering to rising clean-label demand in North America and Europe.
  • In April 2025, a global commodity trader announced it had secured USD 500 million in green financing to upgrade its milling facilities, focusing on sugarcane bagasse valorization projects to produce bioplastics and bio-composites.

Dive into Technavio’s robust research methodology, blending expert interviews, extensive data synthesis, and validated models for unparalleled Raw Sugar Market insights. See full methodology.

Market Scope
Page number 290
Base year 2025
Historic period 2020-2024
Forecast period 2026-2030
Growth momentum & CAGR Accelerate at a CAGR of 2.3%
Market growth 2026-2030 USD 156.4 million
Market structure Fragmented
YoY growth 2025-2026(%) 2.3%
Key countries India, China, Australia, Indonesia, Japan, South Korea, Brazil, Argentina, Chile, France, Germany, UK, The Netherlands, Spain, Italy, US, Mexico, Canada, South Africa, Turkey, Israel, UAE and Saudi Arabia
Competitive landscape Leading Companies, Market Positioning of Companies, Competitive Strategies, and Industry Risks

Request Free Sample

Research Analyst Overview

  • The raw sugar market is being reshaped by the convergence of digital innovation and sustainability mandates. Core operational processes like vacuum-pan crystallization and centrifugal separation are now augmented by advanced analytics to maximize sucrose content and ensure consistent sucrose polarization.
  • This technological shift, which can improve total recoverable sugar by up to 8%, is a critical boardroom focus, influencing capital expenditure on refinery modernization. The industry is moving beyond traditional commodity production, with a focus on high-polarity sugar and specialty products.
  • Producers are leveraging techniques from precision agriculture, including soil moisture monitoring and drip irrigation, to manage crop health and mitigate the effects of climatic volatility. This pivot is essential for maintaining a competitive edge in a market where factors like ratoon crop management and the development of organic raw sugar define profitability.
  • The institutionalization of these high-tech systems is creating a more resilient supply chain, capable of navigating both economic shifts and agricultural challenges while meeting demands for industrial sugar and consumer goods.

What are the Key Data Covered in this Raw Sugar Market Research and Growth Report?

  • What is the expected growth of the Raw Sugar Market between 2026 and 2030?

    • USD 156.4 million, at a CAGR of 2.3%

  • What segmentation does the market report cover?

    • The report is segmented by Product (Liquid sugar, and Crystallized sugar), Type (Conventional, and Organic), Application (Beverages, Confectionery and bakery, Dairy products, and Others) and Geography (APAC, South America, Europe, North America, Middle East and Africa)

  • Which regions are analyzed in the report?

    • APAC, South America, Europe, North America and Middle East and Africa

  • What are the key growth drivers and market challenges?

    • Global production surpluses and industrialization of stock recovery, Structural price erosion resulting from systemic global production surpluses

  • Who are the major players in the Raw Sugar Market?

    • Adecoagro SA, Balrampur Chini Mills Ltd., Central Romana Corp., Dalmia Bharat Sugar Ltd, Dhampur Bio Organics Ltd., EID Parry India Ltd., Florida Crystals Corp., Illovo Sugar, Ingenio Magdalena, Mackay Sugar, Mitr Phol Group, Pantaleon, Shree Renuka Sugars Ltd., Sudzucker AG, Tereos Participations, Thai Roong Ruang Group, Triveni Industries Ltd. and Wilmar International Ltd.

Market Research Insights

  • Market dynamics are increasingly shaped by the dual pressures of commodity price fluctuation and the need for greater supply chain resilience. Producers are adopting flexible production models, with the ability to shift between sugar and biofuel energy mix outputs improving financial returns by over 20% during periods of oil price volatility.
  • The pivot toward sustainable agri-input and fair-trade certification is creating new value streams, as premium products command higher margins. Investment in sugar beet logistics and refinery energy consumption optimization is critical, as operational efficiency gains can reduce costs by 12%.
  • Advanced agricultural practices, including the use of drone surveillance and onboard harvester sensors, are becoming standard for managing crop health and ensuring consistent industrial-grade sweeteners for the global market.

We can help! Our analysts can customize this raw sugar market research report to meet your requirements.

Get in touch

1. Executive Summary

1.1 Market overview

Executive Summary - Chart on Market Overview
Executive Summary - Data Table on Market Overview
Executive Summary - Chart on Global Market Characteristics
Executive Summary - Chart on Market by Geography
Executive Summary - Chart on Market Segmentation by Product
Executive Summary - Chart on Market Segmentation by Type
Executive Summary - Chart on Market Segmentation by Application
Executive Summary - Chart on Incremental Growth
Executive Summary - Data Table on Incremental Growth
Executive Summary - Chart on Company Market Positioning

2. Technavio Analysis

2.1 Analysis of price sensitivity, lifecycle, customer purchase basket, adoption rates, and purchase criteria

2.2 Criticality of inputs and Factors of differentiation

Chart on Overview on criticality of inputs and factors of differentiation

2.3 Factors of disruption

Chart on Overview on factors of disruption

2.4 Impact of drivers and challenges

Chart on Impact of drivers and challenges in 2025 and 2030

3. Market Landscape

3.1 Market ecosystem

Chart on Parent Market
Data Table on - Parent Market

3.2 Market characteristics

Chart on Market characteristics analysis

3.3 Value chain analysis

Chart on Value chain analysis

4. Market Sizing

4.1 Market definition

Data Table on Offerings of companies included in the market definition

4.2 Market segment analysis

Market segments

4.3 Market size 2025

4.4 Market outlook: Forecast for 2025-2030

Chart on Global - Market size and forecast 2025-2030 ($ million)
Data Table on Global - Market size and forecast 2025-2030 ($ million)
Chart on Global Market: Year-over-year growth 2025-2030 (%)
Data Table on Global Market: Year-over-year growth 2025-2030 (%)

5. Historic Market Size

5.1 Global Raw Sugar Market 2020 - 2024

Historic Market Size - Data Table on Global Raw Sugar Market 2020 - 2024 ($ million)

5.2 Product segment analysis 2020 - 2024

Historic Market Size - Product Segment 2020 - 2024 ($ million)

5.3 Type segment analysis 2020 - 2024

Historic Market Size - Type Segment 2020 - 2024 ($ million)

5.4 Application segment analysis 2020 - 2024

Historic Market Size - Application Segment 2020 - 2024 ($ million)

5.5 Geography segment analysis 2020 - 2024

Historic Market Size - Geography Segment 2020 - 2024 ($ million)

5.6 Country segment analysis 2020 - 2024

Historic Market Size - Country Segment 2020 - 2024 ($ million)

6. Qualitative Analysis

6.1 Impact of AI in global raw sugar market

7. Five Forces Analysis

7.1 Five forces summary

Five forces analysis - Comparison between 2025 and 2030

7.2 Bargaining power of buyers

Bargaining power of buyers - Impact of key factors 2025 and 2030

7.3 Bargaining power of suppliers

Bargaining power of suppliers - Impact of key factors in 2025 and 2030

7.4 Threat of new entrants

Threat of new entrants - Impact of key factors in 2025 and 2030

7.5 Threat of substitutes

Threat of substitutes - Impact of key factors in 2025 and 2030

7.6 Threat of rivalry

Threat of rivalry - Impact of key factors in 2025 and 2030

7.7 Market condition

Chart on Market condition - Five forces 2025 and 2030

8. Market Segmentation by Product

8.1 Market segments

Chart on Product - Market share 2025-2030 (%)
Data Table on Product - Market share 2025-2030 (%)

8.2 Comparison by Product

Chart on Comparison by Product
Data Table on Comparison by Product

8.3 Liquid sugar - Market size and forecast 2025-2030

Chart on Liquid sugar - Market size and forecast 2025-2030 ($ million)
Data Table on Liquid sugar - Market size and forecast 2025-2030 ($ million)
Chart on Liquid sugar - Year-over-year growth 2025-2030 (%)
Data Table on Liquid sugar - Year-over-year growth 2025-2030 (%)

8.4 Crystallized sugar - Market size and forecast 2025-2030

Chart on Crystallized sugar - Market size and forecast 2025-2030 ($ million)
Data Table on Crystallized sugar - Market size and forecast 2025-2030 ($ million)
Chart on Crystallized sugar - Year-over-year growth 2025-2030 (%)
Data Table on Crystallized sugar - Year-over-year growth 2025-2030 (%)

8.5 Market opportunity by Product

Market opportunity by Product ($ million)
Data Table on Market opportunity by Product ($ million)

9. Market Segmentation by Type

9.1 Market segments

Chart on Type - Market share 2025-2030 (%)
Data Table on Type - Market share 2025-2030 (%)

9.2 Comparison by Type

Chart on Comparison by Type
Data Table on Comparison by Type

9.3 Conventional - Market size and forecast 2025-2030

Chart on Conventional - Market size and forecast 2025-2030 ($ million)
Data Table on Conventional - Market size and forecast 2025-2030 ($ million)
Chart on Conventional - Year-over-year growth 2025-2030 (%)
Data Table on Conventional - Year-over-year growth 2025-2030 (%)

9.4 Organic - Market size and forecast 2025-2030

Chart on Organic - Market size and forecast 2025-2030 ($ million)
Data Table on Organic - Market size and forecast 2025-2030 ($ million)
Chart on Organic - Year-over-year growth 2025-2030 (%)
Data Table on Organic - Year-over-year growth 2025-2030 (%)

9.5 Market opportunity by Type

Market opportunity by Type ($ million)
Data Table on Market opportunity by Type ($ million)

10. Market Segmentation by Application

10.1 Market segments

Chart on Application - Market share 2025-2030 (%)
Data Table on Application - Market share 2025-2030 (%)

10.2 Comparison by Application

Chart on Comparison by Application
Data Table on Comparison by Application

10.3 Beverages - Market size and forecast 2025-2030

Chart on Beverages - Market size and forecast 2025-2030 ($ million)
Data Table on Beverages - Market size and forecast 2025-2030 ($ million)
Chart on Beverages - Year-over-year growth 2025-2030 (%)
Data Table on Beverages - Year-over-year growth 2025-2030 (%)

10.4 Confectionery and bakery - Market size and forecast 2025-2030

Chart on Confectionery and bakery - Market size and forecast 2025-2030 ($ million)
Data Table on Confectionery and bakery - Market size and forecast 2025-2030 ($ million)
Chart on Confectionery and bakery - Year-over-year growth 2025-2030 (%)
Data Table on Confectionery and bakery - Year-over-year growth 2025-2030 (%)

10.5 Dairy products - Market size and forecast 2025-2030

Chart on Dairy products - Market size and forecast 2025-2030 ($ million)
Data Table on Dairy products - Market size and forecast 2025-2030 ($ million)
Chart on Dairy products - Year-over-year growth 2025-2030 (%)
Data Table on Dairy products - Year-over-year growth 2025-2030 (%)

10.6 Others - Market size and forecast 2025-2030

Chart on Others - Market size and forecast 2025-2030 ($ million)
Data Table on Others - Market size and forecast 2025-2030 ($ million)
Chart on Others - Year-over-year growth 2025-2030 (%)
Data Table on Others - Year-over-year growth 2025-2030 (%)

10.7 Market opportunity by Application

Market opportunity by Application ($ million)
Data Table on Market opportunity by Application ($ million)

11. Customer Landscape

11.1 Customer landscape overview

Analysis of price sensitivity, lifecycle, customer purchase basket, adoption rates, and purchase criteria

12. Geographic Landscape

12.1 Geographic segmentation

Chart on Market share by geography 2025-2030 (%)
Data Table on Market share by geography 2025-2030 (%)

12.2 Geographic comparison

Chart on Geographic comparison
Data Table on Geographic comparison

12.3 APAC - Market size and forecast 2025-2030

Chart on APAC - Market size and forecast 2025-2030 ($ million)
Data Table on APAC - Market size and forecast 2025-2030 ($ million)
Chart on APAC - Year-over-year growth 2025-2030 (%)
Data Table on APAC - Year-over-year growth 2025-2030 (%)
Chart on Regional Comparison - APAC
Data Table on Regional Comparison - APAC

12.3.1 India - Market size and forecast 2025-2030

Chart on India - Market size and forecast 2025-2030 ($ million)
Data Table on India - Market size and forecast 2025-2030 ($ million)
Chart on India - Year-over-year growth 2025-2030 (%)
Data Table on India - Year-over-year growth 2025-2030 (%)

12.3.2 China - Market size and forecast 2025-2030

Chart on China - Market size and forecast 2025-2030 ($ million)
Data Table on China - Market size and forecast 2025-2030 ($ million)
Chart on China - Year-over-year growth 2025-2030 (%)
Data Table on China - Year-over-year growth 2025-2030 (%)

12.3.3 Australia - Market size and forecast 2025-2030

Chart on Australia - Market size and forecast 2025-2030 ($ million)
Data Table on Australia - Market size and forecast 2025-2030 ($ million)
Chart on Australia - Year-over-year growth 2025-2030 (%)
Data Table on Australia - Year-over-year growth 2025-2030 (%)

12.3.4 Indonesia - Market size and forecast 2025-2030

Chart on Indonesia - Market size and forecast 2025-2030 ($ million)
Data Table on Indonesia - Market size and forecast 2025-2030 ($ million)
Chart on Indonesia - Year-over-year growth 2025-2030 (%)
Data Table on Indonesia - Year-over-year growth 2025-2030 (%)

12.3.5 Japan - Market size and forecast 2025-2030

Chart on Japan - Market size and forecast 2025-2030 ($ million)
Data Table on Japan - Market size and forecast 2025-2030 ($ million)
Chart on Japan - Year-over-year growth 2025-2030 (%)
Data Table on Japan - Year-over-year growth 2025-2030 (%)

12.3.6 South Korea - Market size and forecast 2025-2030

Chart on South Korea - Market size and forecast 2025-2030 ($ million)
Data Table on South Korea - Market size and forecast 2025-2030 ($ million)
Chart on South Korea - Year-over-year growth 2025-2030 (%)
Data Table on South Korea - Year-over-year growth 2025-2030 (%)

12.4 South America - Market size and forecast 2025-2030

Chart on South America - Market size and forecast 2025-2030 ($ million)
Data Table on South America - Market size and forecast 2025-2030 ($ million)
Chart on South America - Year-over-year growth 2025-2030 (%)
Data Table on South America - Year-over-year growth 2025-2030 (%)
Chart on Regional Comparison - South America
Data Table on Regional Comparison - South America

12.4.1 Brazil - Market size and forecast 2025-2030

Chart on Brazil - Market size and forecast 2025-2030 ($ million)
Data Table on Brazil - Market size and forecast 2025-2030 ($ million)
Chart on Brazil - Year-over-year growth 2025-2030 (%)
Data Table on Brazil - Year-over-year growth 2025-2030 (%)

12.4.2 Argentina - Market size and forecast 2025-2030

Chart on Argentina - Market size and forecast 2025-2030 ($ million)
Data Table on Argentina - Market size and forecast 2025-2030 ($ million)
Chart on Argentina - Year-over-year growth 2025-2030 (%)
Data Table on Argentina - Year-over-year growth 2025-2030 (%)

12.4.3 Chile - Market size and forecast 2025-2030

Chart on Chile - Market size and forecast 2025-2030 ($ million)
Data Table on Chile - Market size and forecast 2025-2030 ($ million)
Chart on Chile - Year-over-year growth 2025-2030 (%)
Data Table on Chile - Year-over-year growth 2025-2030 (%)

12.5 Europe - Market size and forecast 2025-2030

Chart on Europe - Market size and forecast 2025-2030 ($ million)
Data Table on Europe - Market size and forecast 2025-2030 ($ million)
Chart on Europe - Year-over-year growth 2025-2030 (%)
Data Table on Europe - Year-over-year growth 2025-2030 (%)
Chart on Regional Comparison - Europe
Data Table on Regional Comparison - Europe

12.5.1 France - Market size and forecast 2025-2030

Chart on France - Market size and forecast 2025-2030 ($ million)
Data Table on France - Market size and forecast 2025-2030 ($ million)
Chart on France - Year-over-year growth 2025-2030 (%)
Data Table on France - Year-over-year growth 2025-2030 (%)

12.5.2 Germany - Market size and forecast 2025-2030

Chart on Germany - Market size and forecast 2025-2030 ($ million)
Data Table on Germany - Market size and forecast 2025-2030 ($ million)
Chart on Germany - Year-over-year growth 2025-2030 (%)
Data Table on Germany - Year-over-year growth 2025-2030 (%)

12.5.3 UK - Market size and forecast 2025-2030

Chart on UK - Market size and forecast 2025-2030 ($ million)
Data Table on UK - Market size and forecast 2025-2030 ($ million)
Chart on UK - Year-over-year growth 2025-2030 (%)
Data Table on UK - Year-over-year growth 2025-2030 (%)

12.5.4 The Netherlands - Market size and forecast 2025-2030

Chart on The Netherlands - Market size and forecast 2025-2030 ($ million)
Data Table on The Netherlands - Market size and forecast 2025-2030 ($ million)
Chart on The Netherlands - Year-over-year growth 2025-2030 (%)
Data Table on The Netherlands - Year-over-year growth 2025-2030 (%)

12.5.5 Spain - Market size and forecast 2025-2030

Chart on Spain - Market size and forecast 2025-2030 ($ million)
Data Table on Spain - Market size and forecast 2025-2030 ($ million)
Chart on Spain - Year-over-year growth 2025-2030 (%)
Data Table on Spain - Year-over-year growth 2025-2030 (%)

12.5.6 Italy - Market size and forecast 2025-2030

Chart on Italy - Market size and forecast 2025-2030 ($ million)
Data Table on Italy - Market size and forecast 2025-2030 ($ million)
Chart on Italy - Year-over-year growth 2025-2030 (%)
Data Table on Italy - Year-over-year growth 2025-2030 (%)

12.6 North America - Market size and forecast 2025-2030

Chart on North America - Market size and forecast 2025-2030 ($ million)
Data Table on North America - Market size and forecast 2025-2030 ($ million)
Chart on North America - Year-over-year growth 2025-2030 (%)
Data Table on North America - Year-over-year growth 2025-2030 (%)
Chart on Regional Comparison - North America
Data Table on Regional Comparison - North America

12.6.1 US - Market size and forecast 2025-2030

Chart on US - Market size and forecast 2025-2030 ($ million)
Data Table on US - Market size and forecast 2025-2030 ($ million)
Chart on US - Year-over-year growth 2025-2030 (%)
Data Table on US - Year-over-year growth 2025-2030 (%)

12.6.2 Mexico - Market size and forecast 2025-2030

Chart on Mexico - Market size and forecast 2025-2030 ($ million)
Data Table on Mexico - Market size and forecast 2025-2030 ($ million)
Chart on Mexico - Year-over-year growth 2025-2030 (%)
Data Table on Mexico - Year-over-year growth 2025-2030 (%)

12.6.3 Canada - Market size and forecast 2025-2030

Chart on Canada - Market size and forecast 2025-2030 ($ million)
Data Table on Canada - Market size and forecast 2025-2030 ($ million)
Chart on Canada - Year-over-year growth 2025-2030 (%)
Data Table on Canada - Year-over-year growth 2025-2030 (%)

12.7 Middle East and Africa - Market size and forecast 2025-2030

Chart on Middle East and Africa - Market size and forecast 2025-2030 ($ million)
Data Table on Middle East and Africa - Market size and forecast 2025-2030 ($ million)
Chart on Middle East and Africa - Year-over-year growth 2025-2030 (%)
Data Table on Middle East and Africa - Year-over-year growth 2025-2030 (%)
Chart on Regional Comparison - Middle East and Africa
Data Table on Regional Comparison - Middle East and Africa

12.7.1 South Africa - Market size and forecast 2025-2030

Chart on South Africa - Market size and forecast 2025-2030 ($ million)
Data Table on South Africa - Market size and forecast 2025-2030 ($ million)
Chart on South Africa - Year-over-year growth 2025-2030 (%)
Data Table on South Africa - Year-over-year growth 2025-2030 (%)

12.7.2 Turkey - Market size and forecast 2025-2030

Chart on Turkey - Market size and forecast 2025-2030 ($ million)
Data Table on Turkey - Market size and forecast 2025-2030 ($ million)
Chart on Turkey - Year-over-year growth 2025-2030 (%)
Data Table on Turkey - Year-over-year growth 2025-2030 (%)

12.7.3 Israel - Market size and forecast 2025-2030

Chart on Israel - Market size and forecast 2025-2030 ($ million)
Data Table on Israel - Market size and forecast 2025-2030 ($ million)
Chart on Israel - Year-over-year growth 2025-2030 (%)
Data Table on Israel - Year-over-year growth 2025-2030 (%)

12.7.4 UAE - Market size and forecast 2025-2030

Chart on UAE - Market size and forecast 2025-2030 ($ million)
Data Table on UAE - Market size and forecast 2025-2030 ($ million)
Chart on UAE - Year-over-year growth 2025-2030 (%)
Data Table on UAE - Year-over-year growth 2025-2030 (%)

12.7.5 Saudi Arabia - Market size and forecast 2025-2030

Chart on Saudi Arabia - Market size and forecast 2025-2030 ($ million)
Data Table on Saudi Arabia - Market size and forecast 2025-2030 ($ million)
Chart on Saudi Arabia - Year-over-year growth 2025-2030 (%)
Data Table on Saudi Arabia - Year-over-year growth 2025-2030 (%)

12.8 Market opportunity by geography

Market opportunity by geography ($ million)
Data Tables on Market opportunity by geography ($ million)

13. Drivers, Challenges, and Opportunity

13.1 Market drivers

Global production surpluses and industrialization of stock recovery
Diversified feedstock utilization and rise of sugarcane-to-ethanol flexibility
Regional trade liberalization and expansion of Asian import quotas

13.2 Market challenges

Structural price erosion resulting from systemic global production surpluses
Escalating regulatory friction and emergence of anti-sugar health interventions
Climatic volatility and technical challenge of ratoon yield management

13.3 Impact of drivers and challenges

Impact of drivers and challenges in 2025 and 2030

13.4 Market opportunities

Integration of AI and satellite-based precision harvesting
Regenerative agriculture and soil carbon sequestration frameworks
Emergence of differentiated specialty sugars and functional ingredient diversification

14. Competitive Landscape

14.1 Overview

14.2

Overview on criticality of inputs and factors of differentiation

14.3 Landscape disruption

Overview on factors of disruption

14.4 Industry risks

Impact of key risks on business

15. Competitive Analysis

15.1 Companies profiled

Companies covered

15.2 Company ranking index

15.3 Market positioning of companies

Matrix on companies position and classification

15.4 Adecoagro SA

Adecoagro SA - Overview
Adecoagro SA - Product / Service
Adecoagro SA - Key offerings
SWOT

15.5 Balrampur Chini Mills Ltd.

Balrampur Chini Mills Ltd. - Overview
Balrampur Chini Mills Ltd. - Product / Service
Balrampur Chini Mills Ltd. - Key offerings
SWOT

15.6 Central Romana Corp.

Central Romana Corp. - Overview
Central Romana Corp. - Product / Service
Central Romana Corp. - Key offerings
SWOT

15.7 Dalmia Bharat Sugar Ltd

Dalmia Bharat Sugar Ltd - Overview
Dalmia Bharat Sugar Ltd - Product / Service
Dalmia Bharat Sugar Ltd - Key offerings
SWOT

15.8 Dhampur Bio Organics Ltd.

Dhampur Bio Organics Ltd. - Overview
Dhampur Bio Organics Ltd. - Product / Service
Dhampur Bio Organics Ltd. - Key offerings
SWOT

15.9 EID Parry India Ltd.

EID Parry India Ltd. - Overview
EID Parry India Ltd. - Business segments
EID Parry India Ltd. - Key offerings
EID Parry India Ltd. - Segment focus
SWOT

15.10 Florida Crystals Corp.

Florida Crystals Corp. - Overview
Florida Crystals Corp. - Product / Service
Florida Crystals Corp. - Key offerings
SWOT

15.11 Illovo Sugar

Illovo Sugar - Overview
Illovo Sugar - Product / Service
Illovo Sugar - Key offerings
SWOT

15.12 Mackay Sugar

Mackay Sugar - Overview
Mackay Sugar - Product / Service
Mackay Sugar - Key offerings
SWOT

15.13 Mitr Phol Group

Mitr Phol Group - Overview
Mitr Phol Group - Product / Service
Mitr Phol Group - Key offerings
SWOT

15.14 Pantaleon

Pantaleon - Overview
Pantaleon - Product / Service
Pantaleon - Key offerings
SWOT

15.15 Sudzucker AG

Sudzucker AG - Overview
Sudzucker AG - Business segments
Sudzucker AG - Key offerings
Sudzucker AG - Segment focus
SWOT

15.16 Tereos Participations

Tereos Participations - Overview
Tereos Participations - Product / Service
Tereos Participations - Key offerings
SWOT

15.17 Triveni Industries Ltd.

Triveni Industries Ltd. - Overview
Triveni Industries Ltd. - Business segments
Triveni Industries Ltd. - Key offerings
Triveni Industries Ltd. - Segment focus
SWOT

15.18 Wilmar International Ltd.

Wilmar International Ltd. - Overview
Wilmar International Ltd. - Business segments
Wilmar International Ltd. - Key offerings
Wilmar International Ltd. - Segment focus
SWOT

16. Appendix

16.1 Scope of the report

Market definition
Objectives
Notes and caveats

16.2 Inclusions and exclusions checklist

Inclusions checklist
Exclusions checklist

16.3 Currency conversion rates for US$

16.4 Research methodology

16.5 Data procurement

Information sources

16.6 Data validation

16.7 Validation techniques employed for market sizing

16.8 Data synthesis

16.9 360 degree market analysis

16.10 List of abbreviations

Research Methodology

Technavio presents a detailed picture of the market by way of study, synthesis, and summation of data from multiple sources. The analysts have presented the various facets of the market with a particular focus on identifying the key industry influencers. The data thus presented is comprehensive, reliable, and the result of extensive research, both primary and secondary.

INFORMATION SOURCES

Primary sources

  • Manufacturers and suppliers
  • Channel partners
  • Industry experts
  • Strategic decision makers

Secondary sources

  • Industry journals and periodicals
  • Government data
  • Financial reports of key industry players
  • Historical data
  • Press releases

DATA ANALYSIS

Data Synthesis

  • Collation of data
  • Estimation of key figures
  • Analysis of derived insights

Data Validation

  • Triangulation with data models
  • Reference against proprietary databases
  • Corroboration with industry experts

REPORT WRITING

Qualitative

  • Market drivers
  • Market challenges
  • Market trends
  • Five forces analysis

Quantitative

  • Market size and forecast
  • Market segmentation
  • Geographical insights
  • Competitive landscape

Interested in this report?

Get your sample now to see our research methodology and insights!

Download Now

Frequently Asked Questions

Raw Sugar market growth will increase by USD 156.4 million during 2026-2030.

The Raw Sugar market is expected to grow at a CAGR of 2.3% during 2026-2030.

Raw Sugar market is segmented by Product (Liquid sugar, Crystallized sugar) Type (Conventional, Organic) Application (Beverages, Confectionery and bakery, Dairy products, Others)

Adecoagro SA, Balrampur Chini Mills Ltd., Central Romana Corp., Dalmia Bharat Sugar Ltd, Dhampur Bio Organics Ltd., EID Parry India Ltd., Florida Crystals Corp., Illovo Sugar, Ingenio Magdalena, Mackay Sugar, Mitr Phol Group, Pantaleon, Shree Renuka Sugars Ltd., Sudzucker AG, Tereos Participations, Thai Roong Ruang Group, Triveni Industries Ltd., Wilmar International Ltd. are a few of the key vendors in the Raw Sugar market.

APAC will register the highest growth rate of 40.7% among the other regions. Therefore, the Raw Sugar market in APAC is expected to garner significant business opportunities for the vendors during the forecast period.

India, China, Australia, Indonesia, Japan, South Korea, Brazil, Argentina, Chile, France, Germany, UK, The Netherlands, Spain, Italy, US, Mexico, Canada, South Africa, Turkey, Israel, UAE, Saudi Arabia

  • Global production surpluses and industrialization of stock recovery is the driving factor this market.

The Raw Sugar market vendors should focus on grabbing business opportunities from the Product segment as it accounted for the largest market share in the base year.
RIA - Research AI Assistant
Ask RIA