Soft Drinks Market Analysis, Size, and Forecast 2026-2030: APAC (China, India, and Japan), North America (US, Canada, and Mexico), Europe (Germany, UK, and France), South America (Brazil, Argentina, and Colombia), Middle East and Africa (UAE, Saudi Arabia, and South Africa), and Rest of World (ROW)

Soft Drinks Market Analysis, Size, and Forecast 2026-2030:
APAC (China, India, and Japan), North America (US, Canada, and Mexico), Europe (Germany, UK, and France), South America (Brazil, Argentina, and Colombia), Middle East and Africa (UAE, Saudi Arabia, and South Africa), and Rest of World (ROW)

Published: Apr 2026 307 Pages SKU: IRTNTR44622

Market Overview at a Glance

$1101 B
Market Opportunity
12.8%
CAGR 2025 - 2030
37.4%
APAC Growth
$347.5 B
Carbonated soft drinks segment 2024

Soft Drinks Market Size 2026-2030

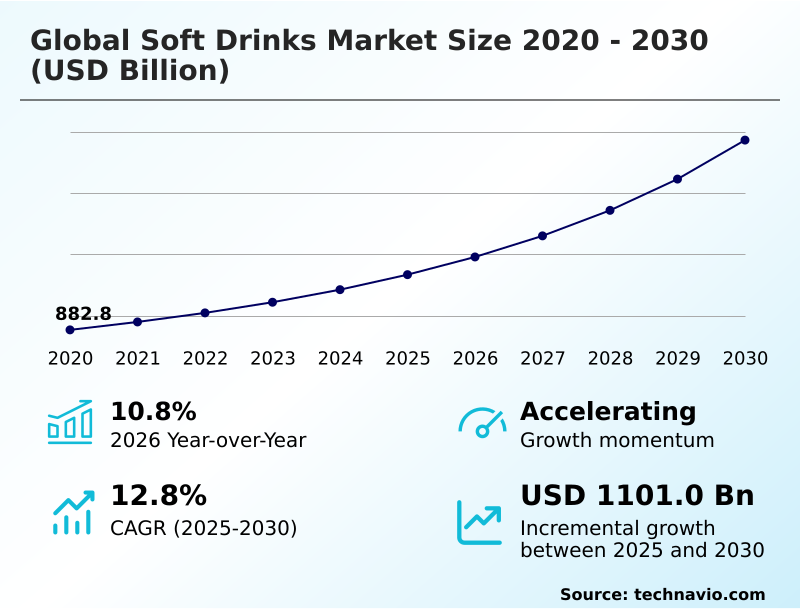
The soft drinks market size is valued to increase by USD 1101 billion, at a CAGR of 12.8% from 2025 to 2030. Escalating consumer demand for functional and health-conscious beverages will drive the soft drinks market.

Major Market Trends & Insights

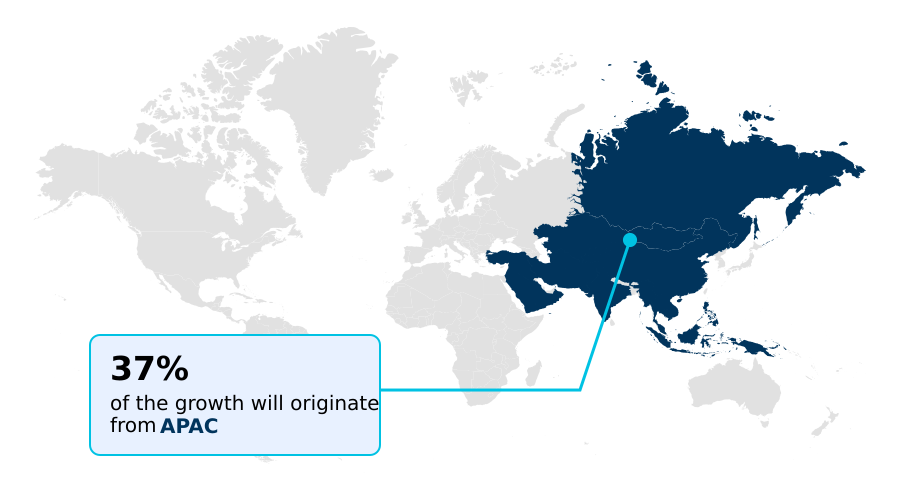
  • APAC dominated the market and accounted for a 37.4% growth during the forecast period.
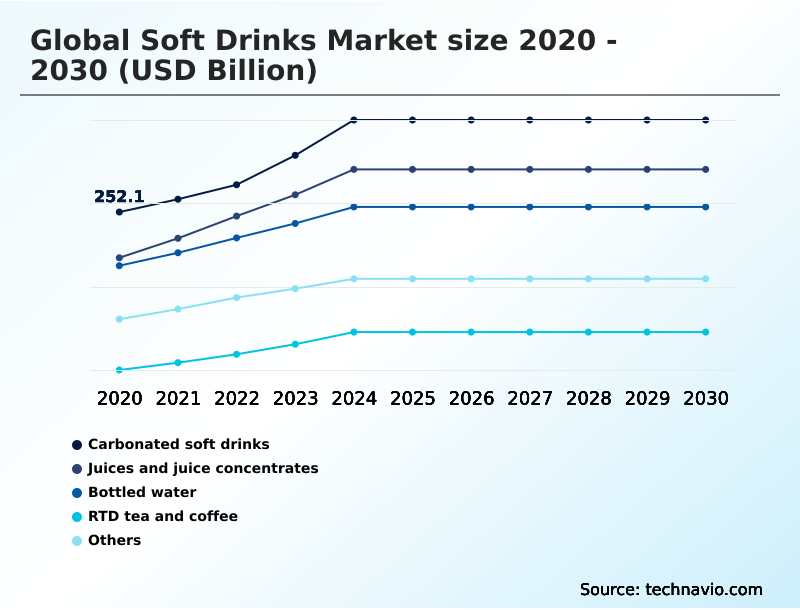
  • By Product - Carbonated soft drinks segment was valued at USD 347.5 billion in 2024
  • By Distribution Channel - Offline segment accounted for the largest market revenue share in 2024

Market Size & Forecast

  • Market Opportunities: USD 1552.8 billion
  • Market Future Opportunities: USD 1101 billion
  • CAGR from 2025 to 2030 : 12.8%

Market Summary

  • The soft drinks market is undergoing a profound transformation, driven by a convergence of consumer, technological, and regulatory forces. A primary dynamic is the shift in consumer preference toward health and wellness, which compels manufacturers to innovate beyond traditional formulations. This involves the integration of functional food ingredients, the development of zero-sugar formulations, and a commitment to ingredient transparency.
  • In response, companies are leveraging data-driven formulation and advanced analytics to create products that align with these new expectations. For instance, a beverage company might utilize consumer preference data to optimize its supply chain for a new line of probiotic-fortified drinks, ensuring efficient distribution to targeted health-conscious demographics while minimizing waste.
  • Concurrently, sustainability has become a central pillar of corporate strategy, with a focus on adopting circular economy principles and sustainable packaging solutions like recycled PET (rPET). This pivot is further complicated by evolving beverage industry regulations, which mandate stricter labeling and place limits on marketing.
  • The industry's future resilience depends on its ability to balance innovation, health-consciousness, and sustainability while navigating a complex global supply chain. The adoption of smart manufacturing and cold chain logistics is becoming critical for maintaining quality and profitability in this competitive environment.

What will be the Size of the Soft Drinks Market during the forecast period?

Get Key Insights on Market Forecast (PDF) Request Free Sample

How is the Soft Drinks Market Segmented?

The soft drinks industry research report provides comprehensive data (region-wise segment analysis), with forecasts and estimates in "USD billion" for the period 2026-2030, as well as historical data from 2020-2024 for the following segments.

  • Product
    • Carbonated soft drinks
    • Juices and juice concentrates
    • Bottled water
    • RTD tea and coffee
    • Others
  • Distribution channel
    • Offline
    • Online
  • Packaging
    • Bottles
    • Cans
    • Cartons and tetra packs
    • Others
  • Geography
    • APAC
      • China
      • India
      • Japan
    • North America
      • US
      • Canada
      • Mexico
    • Europe
      • Germany
      • UK
      • France
    • South America
      • Brazil
      • Argentina
      • Colombia
    • Middle East and Africa
      • UAE
      • Saudi Arabia
      • South Africa
    • Rest of World (ROW)

By Product Insights

The carbonated soft drinks segment is estimated to witness significant growth during the forecast period.

The global soft drinks market is segmented by product, distribution channel, and geography. The carbonated soft drinks segment is undergoing significant transformation, moving beyond traditional sugary sodas to embrace zero-sugar formulations and low-calorie soft drinks.

This pivot is driven by consumer demand for health and wellness beverages and the premiumization trend, which favors natural sweeteners and botanical extracts. Innovation in beverage carbonation process and flavor profile analysis is crucial for retaining market share.

As companies adopt data-driven formulation techniques, they are reformulating classic products to meet modern health standards, with successful reformulations leading to a 15% increase in consumer retention for new diet variants.

This evolution highlights a strategic shift toward clean-label ingredients and functional beverages.

Request Free Sample

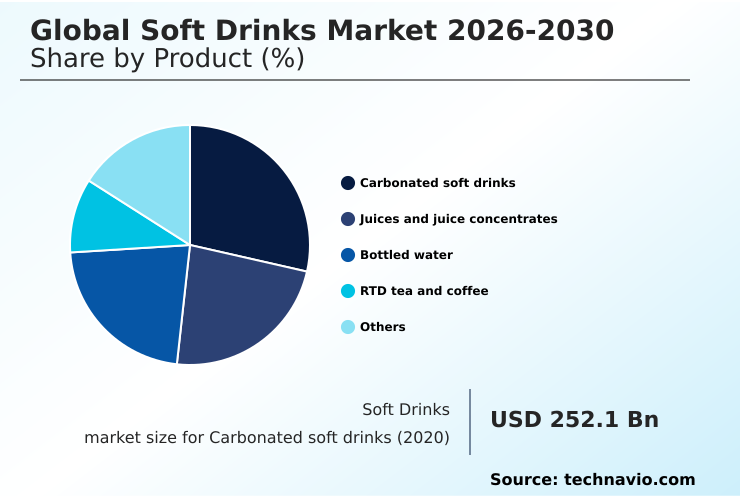
The Carbonated soft drinks segment was valued at USD 347.5 billion in 2024 and showed a gradual increase during the forecast period.

Request Free Sample

Regional Analysis

APAC is estimated to contribute 37.4% to the growth of the global market during the forecast period.Technavio’s analysts have elaborately explained the regional trends and drivers that shape the market during the forecast period.

See How Soft Drinks Market Demand is Rising in APAC Request Free Sample

The geographic landscape of the global soft drinks market 2026-2030 is diversifying, with distinct regional dynamics shaping growth.

APAC is projected to contribute over 37% of the market's incremental growth, fueled by rapid urbanization and rising disposable incomes in China and India. In this region, success depends on flavor profile analysis and localizing products.

In contrast, North America, which represents nearly 28% of the market opportunity, is driven by the premiumization trend and demand for functional beverages.

Companies in this mature market are achieving a 15% reduction in production waste by implementing smart manufacturing and water stewardship programs.

Europe focuses heavily on beverage industry sustainability and regulatory compliance for food additives, pushing for circular economy principles and clean-label ingredients across the board.

Market Dynamics

Our researchers analyzed the data with 2025 as the base year, along with the key drivers, trends, and challenges. A holistic analysis of drivers will help companies refine their marketing strategies to gain a competitive advantage.

  • Strategic decision-making in the global soft drinks market 2026-2030 is increasingly shaped by external pressures and internal innovations. The widespread impact of sugar tax on beverage reformulation has accelerated the consumer shift toward functional soft drinks, forcing companies to rethink their portfolios.
  • In response, the role of AI in soft drink flavor creation has become pivotal, enabling rapid development of palatable products that incorporate advancements in zero-calorie sweetener technology. This technological shift complements new business strategies, fundamentally changing how direct-to-consumer models affect soft drink sales by providing valuable first-party data.
  • Firms leveraging DTC platforms report customer acquisition costs up to 25% lower than those relying on traditional retail channels. However, operators face significant challenges in soft drink supply chain logistics, including managing raw material cost inflation in beverages, which requires sophisticated forecasting.
  • On the sustainability front, navigating sustainability in soft drink packaging materials and implementing strategies for reducing plastic in beverage bottles are now critical for maintaining brand reputation. This is especially true as the growth of plant-based soft drink alternatives and innovations in ready-to-drink coffee and tea gain momentum.
  • The importance of clean-label ingredients in soft drinks cannot be overstated, as it directly addresses consumer preference for natural vs artificial flavors and aligns with the market dynamics of premium artisanal sodas, which continue to capture niche market share.
  • The entire ecosystem is adapting to the impact of digital transformation on beverage retail, forcing a re-evaluation of everything from cold chain integrity for perishable soft drinks to navigating advertising restrictions for sugary drinks, all while meeting the demand for probiotic and gut-health beverages.

What are the key market drivers leading to the rise in the adoption of Soft Drinks Industry?

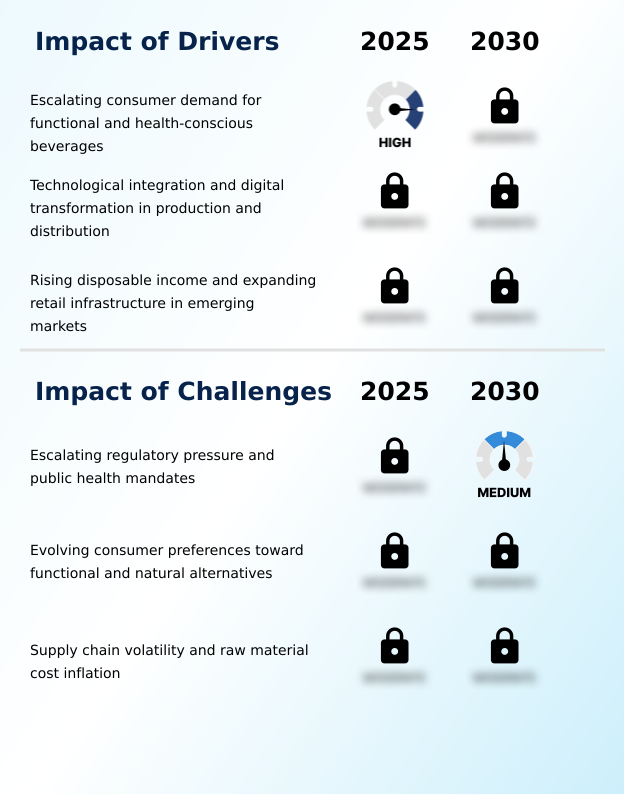
  • Escalating consumer demand for functional and health-conscious beverages serves as the key driver propelling market growth.

  • The growth of the global soft drinks market 2026-2030 is primarily driven by shifting consumer values toward health and technological advancements.
  • Escalating consumer health awareness has propelled a market diversification, with low-calorie soft drinks gaining a 30% market share in key urban centers. This demand for healthier options necessitates ingredient transparency and the use of natural flavor development.
  • Furthermore, the integration of AI in beverage manufacturing has enhanced supply chain visibility, improving operational efficiency by up to 18% by reducing stockouts and optimizing inventory.
  • The expansion of modern retail infrastructure, coupled with effective retail shelf placement strategy, ensures wider accessibility of these innovative products to consumers.

What are the market trends shaping the Soft Drinks Industry?

  • The market is increasingly shaped by the rising popularity of functional beverages. This shift reflects a broader consumer movement toward wellness-driven innovation in product formulation.

  • Key trends reshaping the global soft drinks market 2026-2030 center on functionality, sustainability, and personalization. The movement toward health and wellness beverages has spurred innovation in beverage formulation, with a focus on functional food ingredients and adaptogenic herbs. This has resulted in a 40% increase in new product SKUs featuring such components.
  • Simultaneously, beverage industry sustainability is a dominant theme, driving a 25% rise in the adoption of eco-friendly packaging materials and lightweighting technology. Some leading brands now achieve over 90% recyclability for their packaging. Digital transformation facilitates consumer-centric product design and personalized nutrition drinks, creating new avenues for growth and brand loyalty.

What challenges does the Soft Drinks Industry face during its growth?

  • Escalating regulatory pressure and public health mandates present a key challenge affecting the industry's growth trajectory.

  • The global soft drinks market 2026-2030 faces significant challenges from regulatory pressures and supply chain disruptions. Increasingly stringent regulatory compliance for food additives has extended product development timelines by an average of 15% for new beverage launches. This is compounded by the challenge of managing consumer perceptions around artificial ingredients, pushing for cleaner labels.
  • On the operational front, supply chain volatility has contributed to a 20% increase in the costs of key raw materials like aluminum and sugar, directly impacting profit margins. This economic pressure forces companies to balance competitive pricing with the high cost of ethical sourcing in beverages and implementing sustainable production methods.

Exclusive Technavio Analysis on Customer Landscape

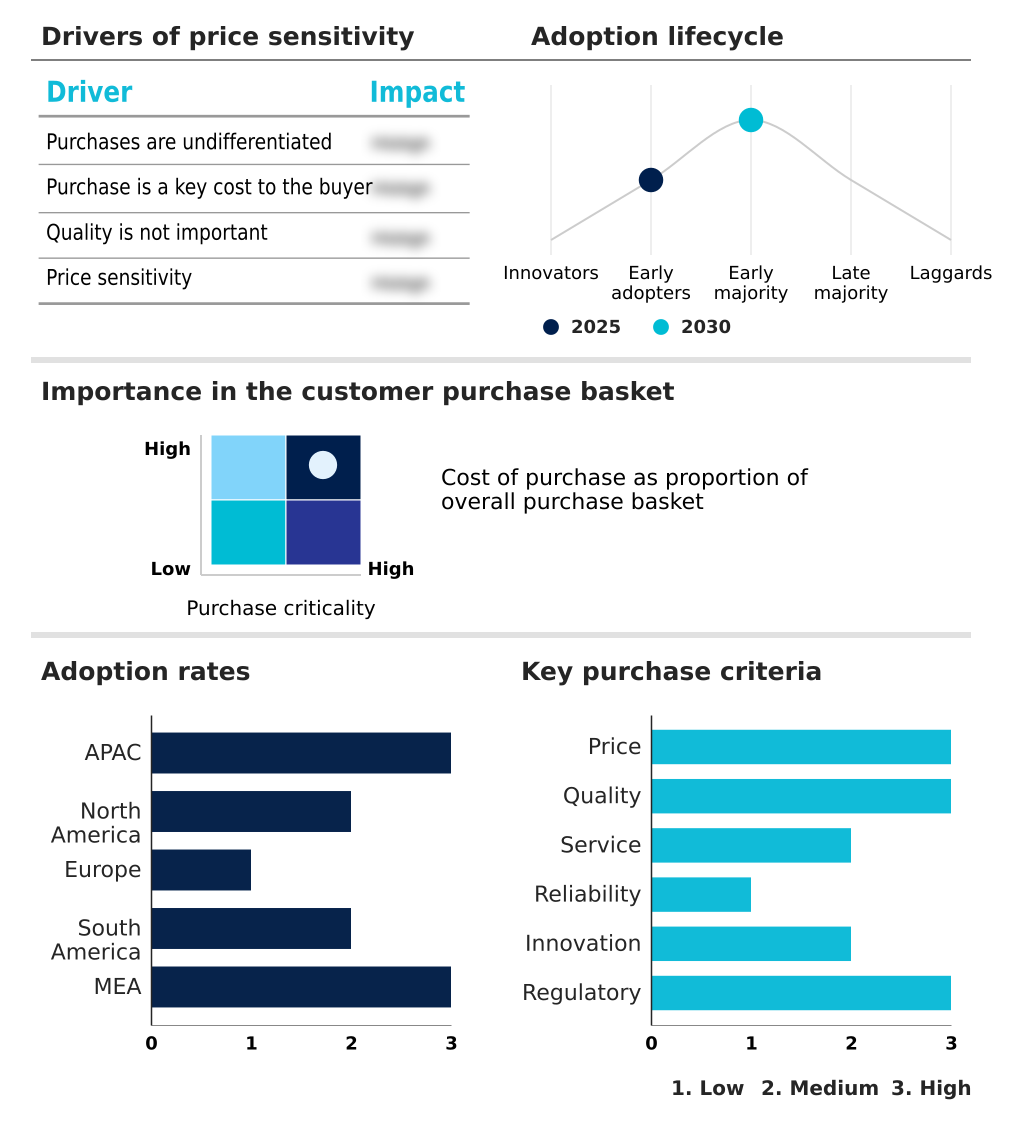
The soft drinks market forecasting report includes the adoption lifecycle of the market, covering from the innovator’s stage to the laggard’s stage. It focuses on adoption rates in different regions based on penetration. Furthermore, the soft drinks market report also includes key purchase criteria and drivers of price sensitivity to help companies evaluate and develop their market growth analysis strategies.

Customer Landscape of Soft Drinks Industry

Competitive Landscape

Companies are implementing various strategies, such as strategic alliances, soft drinks market forecast, partnerships, mergers and acquisitions, geographical expansion, and product/service launches, to enhance their presence in the industry.

Asahi Group Holdings Ltd. - The vendor landscape features global leaders offering a diverse portfolio of carbonated and non-alcoholic beverages, focused on brand revitalization and flavor innovation to meet evolving consumer health demands.

The industry research and growth report includes detailed analyses of the competitive landscape of the market and information about key companies, including:

  • Asahi Group Holdings Ltd.
  • Danone SA
  • Del Monte Pacific Ltd.
  • Keurig Dr Pepper Inc.
  • Kirin Holdings Co. Ltd.
  • Mondelez International Inc.
  • Monster Beverage Corp.
  • National Beverage Corp.
  • Nestle SA
  • Otsuka Holdings Co. Ltd.
  • Parle Agro Pvt Ltd.
  • PepsiCo Inc.
  • Postobon SA
  • Purity Soft Drinks Ltd.
  • Red Bull GmbH
  • Refresco Group BV
  • Starbucks Corp.
  • Suntory Beverage and Food Ltd.
  • Tata Consumer Products Ltd.
  • The Coca Cola Co.

Qualitative and quantitative analysis of companies has been conducted to help clients understand the wider business environment as well as the strengths and weaknesses of key industry players. Data is qualitatively analyzed to categorize companies as pure play, category-focused, industry-focused, and diversified; it is quantitatively analyzed to categorize companies as dominant, leading, strong, tentative, and weak.

Recent Development and News in Soft drinks market

  • In November 2024, Nom Ag launched a new line of functional beverages, including collagen-infused cappuccinos and beauty waters with vitamin C and zinc, targeting the growing 'beauty-from-within' consumer trend.
  • In January 2025, beverage manufacturers at the Gulfood industry event showcased significant innovations in biodegradable and refillable packaging systems, signaling a strong industry commitment toward achieving zero-waste consumption models.
  • In February 2025, Keurig Dr Pepper Inc. expanded its product portfolio with the launch of a new blackberry-flavored carbonated beverage in the United States, demonstrating a strategy centered on flavor innovation to engage diverse consumer segments.
  • In March 2025, The Coca-Cola Co. and PepsiCo Inc. launched zero-sugar and no-sugar variants of key brands in India at a highly accessible price point, aiming to increase penetration of health-aligned options in emerging markets.

Dive into Technavio’s robust research methodology, blending expert interviews, extensive data synthesis, and validated models for unparalleled Soft Drinks Market insights. See full methodology.

Market Scope
Page number 307
Base year 2025
Historic period 2020-2024
Forecast period 2026-2030
Growth momentum & CAGR Accelerate at a CAGR of 12.8%
Market growth 2026-2030 USD 1101.0 billion
Market structure Fragmented
YoY growth 2025-2026(%) 10.8%
Key countries China, India, Japan, South Korea, Australia, Indonesia, US, Canada, Mexico, Germany, UK, France, Italy, Spain, The Netherlands, Brazil, Argentina, Colombia, UAE, Saudi Arabia, South Africa, Israel and Turkey
Competitive landscape Leading Companies, Market Positioning of Companies, Competitive Strategies, and Industry Risks

Request Free Sample

Research Analyst Overview

  • The global soft drinks market 2026-2030 is navigating a complex transition defined by health-centric consumerism and technological integration. Boardroom decisions are increasingly focused on portfolio diversification toward functional beverages, zero-sugar formulations, and plant-based beverages, driven by a demand for ingredient transparency.
  • The adoption of smart manufacturing and advanced analytics facilitates this shift, allowing for data-driven formulation and precise flavor profile analysis. Concurrently, sustainability mandates are reshaping operations, with circular economy principles and water stewardship programs becoming standard.
  • Innovations in packaging, including lightweighting technology and the use of recycled PET (rPET), are critical for compliance and brand image, with some firms achieving a 10% reduction in shipping costs.
  • The supply chain is also evolving, with direct-to-consumer (DTC) models and automated dispensing systems altering distribution dynamics, while cold chain logistics ensure the integrity of products like cold-pressed juices and probiotic-fortified drinks. The market’s evolution from simple carbonated soft drinks to nutrient-dense beverages with natural sweeteners, botanical extracts, and even nootropic-infused drinks underscores a strategic pivot toward high-value, clean-label ingredients.
  • This competitive environment requires continuous innovation in everything from aseptic packaging to high-impact graphics printing to capture consumer attention.

What are the Key Data Covered in this Soft Drinks Market Research and Growth Report?

  • What is the expected growth of the Soft Drinks Market between 2026 and 2030?

    • USD 1101 billion, at a CAGR of 12.8%

  • What segmentation does the market report cover?

    • The report is segmented by Product (Carbonated soft drinks, Juices and juice concentrates, Bottled water, RTD tea and coffee, and Others), Distribution Channel (Offline, and Online), Packaging (Bottles, Cans, Cartons and tetra packs, and Others) and Geography (APAC, North America, Europe, South America, Middle East and Africa)

  • Which regions are analyzed in the report?

    • APAC, North America, Europe, South America and Middle East and Africa

  • What are the key growth drivers and market challenges?

    • Escalating consumer demand for functional and health-conscious beverages, Escalating regulatory pressure and public health mandates

  • Who are the major players in the Soft Drinks Market?

    • Asahi Group Holdings Ltd., Danone SA, Del Monte Pacific Ltd., Keurig Dr Pepper Inc., Kirin Holdings Co. Ltd., Mondelez International Inc., Monster Beverage Corp., National Beverage Corp., Nestle SA, Otsuka Holdings Co. Ltd., Parle Agro Pvt Ltd., PepsiCo Inc., Postobon SA, Purity Soft Drinks Ltd., Red Bull GmbH, Refresco Group BV, Starbucks Corp., Suntory Beverage and Food Ltd., Tata Consumer Products Ltd. and The Coca Cola Co.

Market Research Insights

  • The global soft drinks market 2026-2030 is defined by a strategic pivot toward consumer-centric product design, where health and wellness beverages are central. The adoption of AI in beverage manufacturing has enabled a 20% improvement in demand forecasting accuracy, minimizing waste.
  • Concurrently, a focus on beverage industry sustainability has driven a 35% increase in the use of eco-friendly packaging materials across new product launches. Brands that successfully integrate personalized nutrition drinks into their portfolio report a 15% higher consumer retention rate compared to those focused on traditional offerings.
  • This dynamic landscape rewards companies that master innovative beverage formulation and digital marketing for beverages to meet evolving demands for transparency and functionality.

We can help! Our analysts can customize this soft drinks market research report to meet your requirements.

Get in touch

1. Executive Summary

1.1 Market overview

Executive Summary - Chart on Market Overview
Executive Summary - Data Table on Market Overview
Executive Summary - Chart on Global Market Characteristics
Executive Summary - Chart on Market by Geography
Executive Summary - Chart on Market Segmentation by Product
Executive Summary - Chart on Market Segmentation by Distribution Channel
Executive Summary - Chart on Market Segmentation by Packaging
Executive Summary - Chart on Incremental Growth
Executive Summary - Data Table on Incremental Growth
Executive Summary - Chart on Company Market Positioning

2. Technavio Analysis

2.1 Analysis of price sensitivity, lifecycle, customer purchase basket, adoption rates, and purchase criteria

2.2 Criticality of inputs and Factors of differentiation

Chart on Overview on criticality of inputs and factors of differentiation

2.3 Factors of disruption

Chart on Overview on factors of disruption

2.4 Impact of drivers and challenges

Chart on Impact of drivers and challenges in 2025 and 2030

3. Market Landscape

3.1 Market ecosystem

Chart on Parent Market
Data Table on - Parent Market

3.2 Market characteristics

Chart on Market characteristics analysis

3.3 Value chain analysis

Chart on Value chain analysis

4. Market Sizing

4.1 Market definition

Data Table on Offerings of companies included in the market definition

4.2 Market segment analysis

Market segments

4.3 Market size 2025

4.4 Market outlook: Forecast for 2025-2030

Chart on Global - Market size and forecast 2025-2030 ($ billion)
Data Table on Global - Market size and forecast 2025-2030 ($ billion)
Chart on Global Market: Year-over-year growth 2025-2030 (%)
Data Table on Global Market: Year-over-year growth 2025-2030 (%)

5. Historic Market Size

5.1 Global Soft Drinks Market 2020 - 2024

Historic Market Size - Data Table on Global Soft Drinks Market 2020 - 2024 ($ billion)

5.2 Product segment analysis 2020 - 2024

Historic Market Size - Product Segment 2020 - 2024 ($ billion)

5.3 Distribution Channel segment analysis 2020 - 2024

Historic Market Size - Distribution Channel Segment 2020 - 2024 ($ billion)

5.4 Packaging segment analysis 2020 - 2024

Historic Market Size - Packaging Segment 2020 - 2024 ($ billion)

5.5 Geography segment analysis 2020 - 2024

Historic Market Size - Geography Segment 2020 - 2024 ($ billion)

5.6 Country segment analysis 2020 - 2024

Historic Market Size - Country Segment 2020 - 2024 ($ billion)

6. Qualitative Analysis

6.1 Impact of AI on global soft drinks market

6.2 Impact of geopolitical conflicts on global soft drinks market

7. Five Forces Analysis

7.1 Five forces summary

Five forces analysis - Comparison between 2025 and 2030

7.2 Bargaining power of buyers

Bargaining power of buyers - Impact of key factors 2025 and 2030

7.3 Bargaining power of suppliers

Bargaining power of suppliers - Impact of key factors in 2025 and 2030

7.4 Threat of new entrants

Threat of new entrants - Impact of key factors in 2025 and 2030

7.5 Threat of substitutes

Threat of substitutes - Impact of key factors in 2025 and 2030

7.6 Threat of rivalry

Threat of rivalry - Impact of key factors in 2025 and 2030

7.7 Market condition

Chart on Market condition - Five forces 2025 and 2030

8. Market Segmentation by Product

8.1 Market segments

Chart on Product - Market share 2025-2030 (%)
Data Table on Product - Market share 2025-2030 (%)

8.2 Comparison by Product

Chart on Comparison by Product
Data Table on Comparison by Product

8.3 Carbonated soft drinks - Market size and forecast 2025-2030

Chart on Carbonated soft drinks - Market size and forecast 2025-2030 ($ billion)
Data Table on Carbonated soft drinks - Market size and forecast 2025-2030 ($ billion)
Chart on Carbonated soft drinks - Year-over-year growth 2025-2030 (%)
Data Table on Carbonated soft drinks - Year-over-year growth 2025-2030 (%)

8.4 Juices and juice concentrates - Market size and forecast 2025-2030

Chart on Juices and juice concentrates - Market size and forecast 2025-2030 ($ billion)
Data Table on Juices and juice concentrates - Market size and forecast 2025-2030 ($ billion)
Chart on Juices and juice concentrates - Year-over-year growth 2025-2030 (%)
Data Table on Juices and juice concentrates - Year-over-year growth 2025-2030 (%)

8.5 Bottled water - Market size and forecast 2025-2030

Chart on Bottled water - Market size and forecast 2025-2030 ($ billion)
Data Table on Bottled water - Market size and forecast 2025-2030 ($ billion)
Chart on Bottled water - Year-over-year growth 2025-2030 (%)
Data Table on Bottled water - Year-over-year growth 2025-2030 (%)

8.6 RTD tea and coffee - Market size and forecast 2025-2030

Chart on RTD tea and coffee - Market size and forecast 2025-2030 ($ billion)
Data Table on RTD tea and coffee - Market size and forecast 2025-2030 ($ billion)
Chart on RTD tea and coffee - Year-over-year growth 2025-2030 (%)
Data Table on RTD tea and coffee - Year-over-year growth 2025-2030 (%)

8.7 Others - Market size and forecast 2025-2030

Chart on Others - Market size and forecast 2025-2030 ($ billion)
Data Table on Others - Market size and forecast 2025-2030 ($ billion)
Chart on Others - Year-over-year growth 2025-2030 (%)
Data Table on Others - Year-over-year growth 2025-2030 (%)

8.8 Market opportunity by Product

Market opportunity by Product ($ billion)
Data Table on Market opportunity by Product ($ billion)

9. Market Segmentation by Distribution Channel

9.1 Market segments

Chart on Distribution Channel - Market share 2025-2030 (%)
Data Table on Distribution Channel - Market share 2025-2030 (%)

9.2 Comparison by Distribution Channel

Chart on Comparison by Distribution Channel
Data Table on Comparison by Distribution Channel

9.3 Offline - Market size and forecast 2025-2030

Chart on Offline - Market size and forecast 2025-2030 ($ billion)
Data Table on Offline - Market size and forecast 2025-2030 ($ billion)
Chart on Offline - Year-over-year growth 2025-2030 (%)
Data Table on Offline - Year-over-year growth 2025-2030 (%)

9.4 Online - Market size and forecast 2025-2030

Chart on Online - Market size and forecast 2025-2030 ($ billion)
Data Table on Online - Market size and forecast 2025-2030 ($ billion)
Chart on Online - Year-over-year growth 2025-2030 (%)
Data Table on Online - Year-over-year growth 2025-2030 (%)

9.5 Market opportunity by Distribution Channel

Market opportunity by Distribution Channel ($ billion)
Data Table on Market opportunity by Distribution Channel ($ billion)

10. Market Segmentation by Packaging

10.1 Market segments

Chart on Packaging - Market share 2025-2030 (%)
Data Table on Packaging - Market share 2025-2030 (%)

10.2 Comparison by Packaging

Chart on Comparison by Packaging
Data Table on Comparison by Packaging

10.3 Bottles - Market size and forecast 2025-2030

Chart on Bottles - Market size and forecast 2025-2030 ($ billion)
Data Table on Bottles - Market size and forecast 2025-2030 ($ billion)
Chart on Bottles - Year-over-year growth 2025-2030 (%)
Data Table on Bottles - Year-over-year growth 2025-2030 (%)

10.4 Cans - Market size and forecast 2025-2030

Chart on Cans - Market size and forecast 2025-2030 ($ billion)
Data Table on Cans - Market size and forecast 2025-2030 ($ billion)
Chart on Cans - Year-over-year growth 2025-2030 (%)
Data Table on Cans - Year-over-year growth 2025-2030 (%)

10.5 Cartons and tetra packs - Market size and forecast 2025-2030

Chart on Cartons and tetra packs - Market size and forecast 2025-2030 ($ billion)
Data Table on Cartons and tetra packs - Market size and forecast 2025-2030 ($ billion)
Chart on Cartons and tetra packs - Year-over-year growth 2025-2030 (%)
Data Table on Cartons and tetra packs - Year-over-year growth 2025-2030 (%)

10.6 Others - Market size and forecast 2025-2030

Chart on Others - Market size and forecast 2025-2030 ($ billion)
Data Table on Others - Market size and forecast 2025-2030 ($ billion)
Chart on Others - Year-over-year growth 2025-2030 (%)
Data Table on Others - Year-over-year growth 2025-2030 (%)

10.7 Market opportunity by Packaging

Market opportunity by Packaging ($ billion)
Data Table on Market opportunity by Packaging ($ billion)

11. Customer Landscape

11.1 Customer landscape overview

Analysis of price sensitivity, lifecycle, customer purchase basket, adoption rates, and purchase criteria

12. Geographic Landscape

12.1 Geographic segmentation

Chart on Market share by geography 2025-2030 (%)
Data Table on Market share by geography 2025-2030 (%)

12.2 Geographic comparison

Chart on Geographic comparison
Data Table on Geographic comparison

12.3 APAC - Market size and forecast 2025-2030

Chart on APAC - Market size and forecast 2025-2030 ($ billion)
Data Table on APAC - Market size and forecast 2025-2030 ($ billion)
Chart on APAC - Year-over-year growth 2025-2030 (%)
Data Table on APAC - Year-over-year growth 2025-2030 (%)
Chart on Regional Comparison - APAC
Data Table on Regional Comparison - APAC

12.3.1 China - Market size and forecast 2025-2030

Chart on China - Market size and forecast 2025-2030 ($ billion)
Data Table on China - Market size and forecast 2025-2030 ($ billion)
Chart on China - Year-over-year growth 2025-2030 (%)
Data Table on China - Year-over-year growth 2025-2030 (%)

12.3.2 India - Market size and forecast 2025-2030

Chart on India - Market size and forecast 2025-2030 ($ billion)
Data Table on India - Market size and forecast 2025-2030 ($ billion)
Chart on India - Year-over-year growth 2025-2030 (%)
Data Table on India - Year-over-year growth 2025-2030 (%)

12.3.3 Japan - Market size and forecast 2025-2030

Chart on Japan - Market size and forecast 2025-2030 ($ billion)
Data Table on Japan - Market size and forecast 2025-2030 ($ billion)
Chart on Japan - Year-over-year growth 2025-2030 (%)
Data Table on Japan - Year-over-year growth 2025-2030 (%)

12.3.4 South Korea - Market size and forecast 2025-2030

Chart on South Korea - Market size and forecast 2025-2030 ($ billion)
Data Table on South Korea - Market size and forecast 2025-2030 ($ billion)
Chart on South Korea - Year-over-year growth 2025-2030 (%)
Data Table on South Korea - Year-over-year growth 2025-2030 (%)

12.3.5 Australia - Market size and forecast 2025-2030

Chart on Australia - Market size and forecast 2025-2030 ($ billion)
Data Table on Australia - Market size and forecast 2025-2030 ($ billion)
Chart on Australia - Year-over-year growth 2025-2030 (%)
Data Table on Australia - Year-over-year growth 2025-2030 (%)

12.3.6 Indonesia - Market size and forecast 2025-2030

Chart on Indonesia - Market size and forecast 2025-2030 ($ billion)
Data Table on Indonesia - Market size and forecast 2025-2030 ($ billion)
Chart on Indonesia - Year-over-year growth 2025-2030 (%)
Data Table on Indonesia - Year-over-year growth 2025-2030 (%)

12.4 North America - Market size and forecast 2025-2030

Chart on North America - Market size and forecast 2025-2030 ($ billion)
Data Table on North America - Market size and forecast 2025-2030 ($ billion)
Chart on North America - Year-over-year growth 2025-2030 (%)
Data Table on North America - Year-over-year growth 2025-2030 (%)
Chart on Regional Comparison - North America
Data Table on Regional Comparison - North America

12.4.1 US - Market size and forecast 2025-2030

Chart on US - Market size and forecast 2025-2030 ($ billion)
Data Table on US - Market size and forecast 2025-2030 ($ billion)
Chart on US - Year-over-year growth 2025-2030 (%)
Data Table on US - Year-over-year growth 2025-2030 (%)

12.4.2 Canada - Market size and forecast 2025-2030

Chart on Canada - Market size and forecast 2025-2030 ($ billion)
Data Table on Canada - Market size and forecast 2025-2030 ($ billion)
Chart on Canada - Year-over-year growth 2025-2030 (%)
Data Table on Canada - Year-over-year growth 2025-2030 (%)

12.4.3 Mexico - Market size and forecast 2025-2030

Chart on Mexico - Market size and forecast 2025-2030 ($ billion)
Data Table on Mexico - Market size and forecast 2025-2030 ($ billion)
Chart on Mexico - Year-over-year growth 2025-2030 (%)
Data Table on Mexico - Year-over-year growth 2025-2030 (%)

12.5 Europe - Market size and forecast 2025-2030

Chart on Europe - Market size and forecast 2025-2030 ($ billion)
Data Table on Europe - Market size and forecast 2025-2030 ($ billion)
Chart on Europe - Year-over-year growth 2025-2030 (%)
Data Table on Europe - Year-over-year growth 2025-2030 (%)
Chart on Regional Comparison - Europe
Data Table on Regional Comparison - Europe

12.5.1 Germany - Market size and forecast 2025-2030

Chart on Germany - Market size and forecast 2025-2030 ($ billion)
Data Table on Germany - Market size and forecast 2025-2030 ($ billion)
Chart on Germany - Year-over-year growth 2025-2030 (%)
Data Table on Germany - Year-over-year growth 2025-2030 (%)

12.5.2 UK - Market size and forecast 2025-2030

Chart on UK - Market size and forecast 2025-2030 ($ billion)
Data Table on UK - Market size and forecast 2025-2030 ($ billion)
Chart on UK - Year-over-year growth 2025-2030 (%)
Data Table on UK - Year-over-year growth 2025-2030 (%)

12.5.3 France - Market size and forecast 2025-2030

Chart on France - Market size and forecast 2025-2030 ($ billion)
Data Table on France - Market size and forecast 2025-2030 ($ billion)
Chart on France - Year-over-year growth 2025-2030 (%)
Data Table on France - Year-over-year growth 2025-2030 (%)

12.5.4 Italy - Market size and forecast 2025-2030

Chart on Italy - Market size and forecast 2025-2030 ($ billion)
Data Table on Italy - Market size and forecast 2025-2030 ($ billion)
Chart on Italy - Year-over-year growth 2025-2030 (%)
Data Table on Italy - Year-over-year growth 2025-2030 (%)

12.5.5 Spain - Market size and forecast 2025-2030

Chart on Spain - Market size and forecast 2025-2030 ($ billion)
Data Table on Spain - Market size and forecast 2025-2030 ($ billion)
Chart on Spain - Year-over-year growth 2025-2030 (%)
Data Table on Spain - Year-over-year growth 2025-2030 (%)

12.5.6 The Netherlands - Market size and forecast 2025-2030

Chart on The Netherlands - Market size and forecast 2025-2030 ($ billion)
Data Table on The Netherlands - Market size and forecast 2025-2030 ($ billion)
Chart on The Netherlands - Year-over-year growth 2025-2030 (%)
Data Table on The Netherlands - Year-over-year growth 2025-2030 (%)

12.6 South America - Market size and forecast 2025-2030

Chart on South America - Market size and forecast 2025-2030 ($ billion)
Data Table on South America - Market size and forecast 2025-2030 ($ billion)
Chart on South America - Year-over-year growth 2025-2030 (%)
Data Table on South America - Year-over-year growth 2025-2030 (%)
Chart on Regional Comparison - South America
Data Table on Regional Comparison - South America

12.6.1 Brazil - Market size and forecast 2025-2030

Chart on Brazil - Market size and forecast 2025-2030 ($ billion)
Data Table on Brazil - Market size and forecast 2025-2030 ($ billion)
Chart on Brazil - Year-over-year growth 2025-2030 (%)
Data Table on Brazil - Year-over-year growth 2025-2030 (%)

12.6.2 Argentina - Market size and forecast 2025-2030

Chart on Argentina - Market size and forecast 2025-2030 ($ billion)
Data Table on Argentina - Market size and forecast 2025-2030 ($ billion)
Chart on Argentina - Year-over-year growth 2025-2030 (%)
Data Table on Argentina - Year-over-year growth 2025-2030 (%)

12.6.3 Colombia - Market size and forecast 2025-2030

Chart on Colombia - Market size and forecast 2025-2030 ($ billion)
Data Table on Colombia - Market size and forecast 2025-2030 ($ billion)
Chart on Colombia - Year-over-year growth 2025-2030 (%)
Data Table on Colombia - Year-over-year growth 2025-2030 (%)

12.7 Middle East and Africa - Market size and forecast 2025-2030

Chart on Middle East and Africa - Market size and forecast 2025-2030 ($ billion)
Data Table on Middle East and Africa - Market size and forecast 2025-2030 ($ billion)
Chart on Middle East and Africa - Year-over-year growth 2025-2030 (%)
Data Table on Middle East and Africa - Year-over-year growth 2025-2030 (%)
Chart on Regional Comparison - Middle East and Africa
Data Table on Regional Comparison - Middle East and Africa

12.7.1 UAE - Market size and forecast 2025-2030

Chart on UAE - Market size and forecast 2025-2030 ($ billion)
Data Table on UAE - Market size and forecast 2025-2030 ($ billion)
Chart on UAE - Year-over-year growth 2025-2030 (%)
Data Table on UAE - Year-over-year growth 2025-2030 (%)

12.7.2 Saudi Arabia - Market size and forecast 2025-2030

Chart on Saudi Arabia - Market size and forecast 2025-2030 ($ billion)
Data Table on Saudi Arabia - Market size and forecast 2025-2030 ($ billion)
Chart on Saudi Arabia - Year-over-year growth 2025-2030 (%)
Data Table on Saudi Arabia - Year-over-year growth 2025-2030 (%)

12.7.3 South Africa - Market size and forecast 2025-2030

Chart on South Africa - Market size and forecast 2025-2030 ($ billion)
Data Table on South Africa - Market size and forecast 2025-2030 ($ billion)
Chart on South Africa - Year-over-year growth 2025-2030 (%)
Data Table on South Africa - Year-over-year growth 2025-2030 (%)

12.7.4 Israel - Market size and forecast 2025-2030

Chart on Israel - Market size and forecast 2025-2030 ($ billion)
Data Table on Israel - Market size and forecast 2025-2030 ($ billion)
Chart on Israel - Year-over-year growth 2025-2030 (%)
Data Table on Israel - Year-over-year growth 2025-2030 (%)

12.7.5 Turkey - Market size and forecast 2025-2030

Chart on Turkey - Market size and forecast 2025-2030 ($ billion)
Data Table on Turkey - Market size and forecast 2025-2030 ($ billion)
Chart on Turkey - Year-over-year growth 2025-2030 (%)
Data Table on Turkey - Year-over-year growth 2025-2030 (%)

12.8 Market opportunity by geography

Market opportunity by geography ($ billion)
Data Tables on Market opportunity by geography ($ billion)

13. Drivers, Challenges, and Opportunity

13.1 Market drivers

Escalating consumer demand for functional and health-conscious beverages
Technological integration and digital transformation in production and distribution
Rising disposable income and expanding retail infrastructure in emerging markets

13.2 Market challenges

Escalating regulatory pressure and public health mandates
Evolving consumer preferences toward functional and natural alternatives
Supply chain volatility and raw material cost inflation

13.3 Impact of drivers and challenges

Impact of drivers and challenges in 2025 and 2030

13.4 Market opportunities

Functional beverages and wellness driven innovation
Sustainability and packaging evolution
Digital transformation and AI driven personalization

14. Competitive Landscape

14.1 Overview

14.2

Overview on criticality of inputs and factors of differentiation

14.3 Landscape disruption

Overview on factors of disruption

14.4 Industry risks

Impact of key risks on business

15. Competitive Analysis

15.1 Companies profiled

Companies covered

15.2 Company ranking index

15.3 Market positioning of companies

Matrix on companies position and classification

15.4 Asahi Group Holdings Ltd.

Asahi Group Holdings Ltd. - Overview
Asahi Group Holdings Ltd. - Business segments
Asahi Group Holdings Ltd. - Key news
Asahi Group Holdings Ltd. - Key offerings
Asahi Group Holdings Ltd. - Segment focus
SWOT

15.5 Danone SA

Danone SA - Overview
Danone SA - Business segments
Danone SA - Key offerings
Danone SA - Segment focus
SWOT

15.6 Del Monte Pacific Ltd.

Del Monte Pacific Ltd. - Overview
Del Monte Pacific Ltd. - Business segments
Del Monte Pacific Ltd. - Key offerings
Del Monte Pacific Ltd. - Segment focus
SWOT

15.7 Keurig Dr Pepper Inc.

Keurig Dr Pepper Inc. - Overview
Keurig Dr Pepper Inc. - Business segments
Keurig Dr Pepper Inc. - Key offerings
Keurig Dr Pepper Inc. - Segment focus
SWOT

15.8 Kirin Holdings Co. Ltd.

Kirin Holdings Co. Ltd. - Overview
Kirin Holdings Co. Ltd. - Business segments
Kirin Holdings Co. Ltd. - Key offerings
Kirin Holdings Co. Ltd. - Segment focus
SWOT

15.9 Mondelez International Inc.

Mondelez International Inc. - Overview
Mondelez International Inc. - Business segments
Mondelez International Inc. - Key offerings
Mondelez International Inc. - Segment focus
SWOT

15.10 Monster Beverage Corp.

Monster Beverage Corp. - Overview
Monster Beverage Corp. - Business segments
Monster Beverage Corp. - Key offerings
Monster Beverage Corp. - Segment focus
SWOT

15.11 National Beverage Corp.

National Beverage Corp. - Overview
National Beverage Corp. - Product / Service
National Beverage Corp. - Key offerings
SWOT

15.12 Otsuka Holdings Co. Ltd.

Otsuka Holdings Co. Ltd. - Overview
Otsuka Holdings Co. Ltd. - Business segments
Otsuka Holdings Co. Ltd. - Key offerings
Otsuka Holdings Co. Ltd. - Segment focus
SWOT

15.13 PepsiCo Inc.

PepsiCo Inc. - Overview
PepsiCo Inc. - Business segments
PepsiCo Inc. - Key news
PepsiCo Inc. - Key offerings
PepsiCo Inc. - Segment focus
SWOT

15.14 Red Bull GmbH

Red Bull GmbH - Overview
Red Bull GmbH - Product / Service
Red Bull GmbH - Key offerings
SWOT

15.15 Refresco Group BV

Refresco Group BV - Overview
Refresco Group BV - Product / Service
Refresco Group BV - Key offerings
SWOT

15.16 Suntory Beverage and Food Ltd.

Suntory Beverage and Food Ltd. - Overview
Suntory Beverage and Food Ltd. - Business segments
Suntory Beverage and Food Ltd. - Key news
Suntory Beverage and Food Ltd. - Key offerings
Suntory Beverage and Food Ltd. - Segment focus
SWOT

15.17 Tata Consumer Products Ltd.

Tata Consumer Products Ltd. - Overview
Tata Consumer Products Ltd. - Business segments
Tata Consumer Products Ltd. - Key offerings
Tata Consumer Products Ltd. - Segment focus
SWOT

15.18 The Coca Cola Co.

The Coca Cola Co. - Overview
The Coca Cola Co. - Business segments
The Coca Cola Co. - Key news
The Coca Cola Co. - Key offerings
The Coca Cola Co. - Segment focus
SWOT

16. Appendix

16.1 Scope of the report

Market definition
Objectives
Notes and caveats

16.2 Inclusions and exclusions checklist

Inclusions checklist
Exclusions checklist

16.3 Currency conversion rates for US$

16.4 Research methodology

16.5 Data procurement

Information sources

16.6 Data validation

16.7 Validation techniques employed for market sizing

16.8 Data synthesis

16.9 360 degree market analysis

16.10 List of abbreviations

Research Methodology

Technavio presents a detailed picture of the market by way of study, synthesis, and summation of data from multiple sources. The analysts have presented the various facets of the market with a particular focus on identifying the key industry influencers. The data thus presented is comprehensive, reliable, and the result of extensive research, both primary and secondary.

INFORMATION SOURCES

Primary sources

  • Manufacturers and suppliers
  • Channel partners
  • Industry experts
  • Strategic decision makers

Secondary sources

  • Industry journals and periodicals
  • Government data
  • Financial reports of key industry players
  • Historical data
  • Press releases

DATA ANALYSIS

Data Synthesis

  • Collation of data
  • Estimation of key figures
  • Analysis of derived insights

Data Validation

  • Triangulation with data models
  • Reference against proprietary databases
  • Corroboration with industry experts

REPORT WRITING

Qualitative

  • Market drivers
  • Market challenges
  • Market trends
  • Five forces analysis

Quantitative

  • Market size and forecast
  • Market segmentation
  • Geographical insights
  • Competitive landscape

Interested in this report?

Get your sample now to see our research methodology and insights!

Download Now

Frequently Asked Questions

Soft Drinks market growth will increase by USD 1101.0 billion during 2026-2030.

The Soft Drinks market is expected to grow at a CAGR of 12.8% during 2026-2030.

Soft Drinks market is segmented by Product (Carbonated soft drinks, Juices and juice concentrates, Bottled water, RTD tea and coffee, Others) Distribution channel (Offline, Online) Packaging (Bottles, Cans, Cartons and tetra packs, Others)

Asahi Group Holdings Ltd., Danone SA, Del Monte Pacific Ltd., Keurig Dr Pepper Inc., Kirin Holdings Co. Ltd., Mondelez International Inc., Monster Beverage Corp., National Beverage Corp., Nestle SA, Otsuka Holdings Co. Ltd., Parle Agro Pvt Ltd., PepsiCo Inc., Postobon SA, Purity Soft Drinks Ltd., Red Bull GmbH, Refresco Group BV, Starbucks Corp., Suntory Beverage and Food Ltd., Tata Consumer Products Ltd., The Coca Cola Co. are a few of the key vendors in the Soft Drinks market.

APAC will register the highest growth rate of 37.4% among the other regions. Therefore, the Soft Drinks market in APAC is expected to garner significant business opportunities for the vendors during the forecast period.

China, India, Japan, South Korea, Australia, Indonesia, US, Canada, Mexico, Germany, UK, France, Italy, Spain, The Netherlands, Brazil, Argentina, Colombia, UAE, Saudi Arabia, South Africa, Israel, Turkey

  • Escalating consumer demand for functional and health-conscious beverages is the driving factor this market.

The Soft Drinks market vendors should focus on grabbing business opportunities from the Product segment as it accounted for the largest market share in the base year.
RIA - Research AI Assistant
Ask RIA