
Reactive Adhesives Market Size 2025-2029
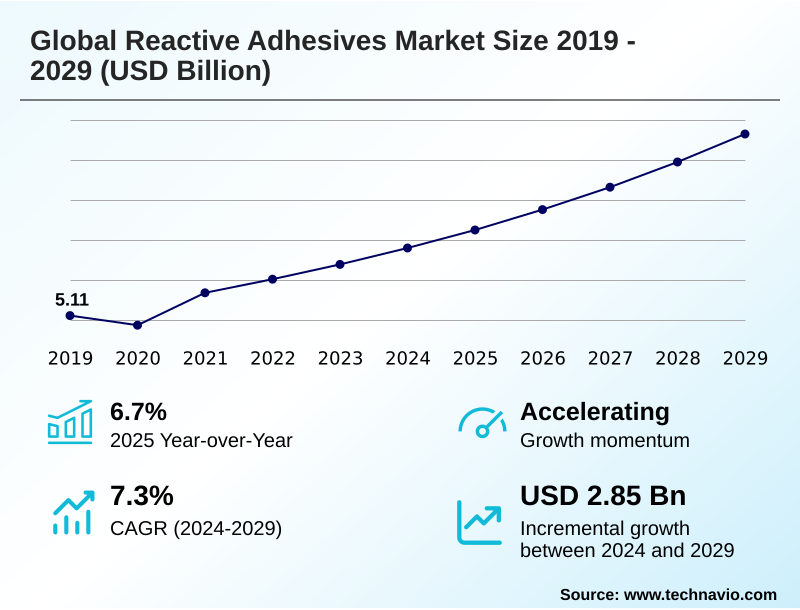
The reactive adhesives market size is valued to increase by USD 2.85 billion, at a CAGR of 7.3% from 2024 to 2029. Increasing demand for reactive adhesives in medical industry will drive the reactive adhesives market.
Major Market Trends & Insights
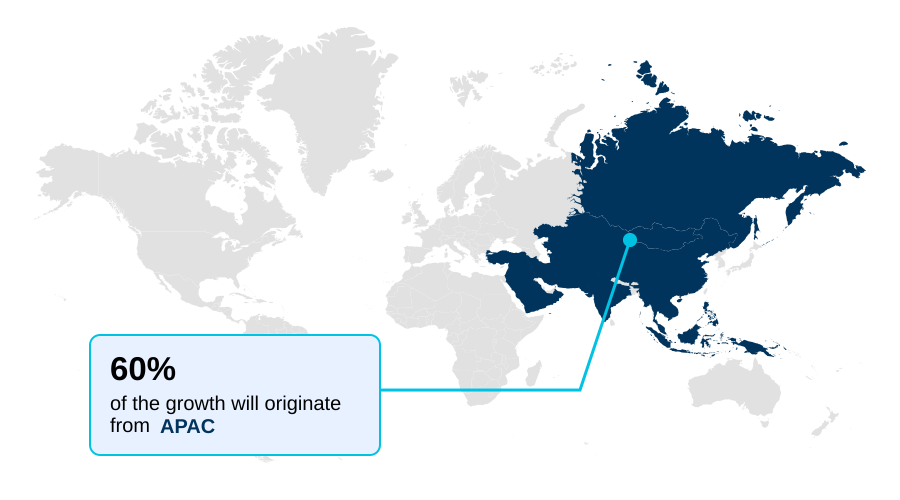
- APAC dominated the market and accounted for a 59.7% growth during the forecast period.
- By Product - Epoxy segment was valued at USD 2.54 billion in 2023
- By Application - Structural bonding segment accounted for the largest market revenue share in 2023
Market Size & Forecast
- Market Opportunities: USD 4.54 billion
- Market Future Opportunities: USD 2.85 billion
- CAGR from 2024 to 2029 : 7.3%
Market Summary
- The reactive adhesives market is defined by continuous innovation, driven by the need for high-performance adhesives in critical sectors. The shift toward lightweight material bonding in the automotive and aerospace industries is a major catalyst, where materials like composites and aluminum are joined using structural adhesives for composite bonding.
- This necessitates advanced adhesive bonding technology to replace traditional mechanical fasteners, enhancing fuel efficiency and structural integrity. A key trend is the development of green adhesive technology, with a focus on low-VOC adhesive formulations and bio-based adhesive formulations to meet stringent environmental regulations and corporate sustainability goals.
- However, the industry faces challenges from adhesive price volatility, which is linked to fluctuations in petrochemical-based feedstocks. This impacts manufacturing costs and requires sophisticated supply chain logistics. A typical business scenario involves an automotive OEM implementing automated dispensing systems for a two-component epoxy system on an EV assembly line.
- The goal is to optimize the adhesive cure time and ensure consistent bond strength testing results, thereby improving production throughput and vehicle safety without compromising on the performance of automotive structural adhesives. The use of methacrylate adhesives and moisture-curing polyurethanes further diversifies application possibilities.
What will be the Size of the Reactive Adhesives Market during the forecast period?
Get Key Insights on Market Forecast (PDF) Get Free Sample
How is the Reactive Adhesives Market Segmented?
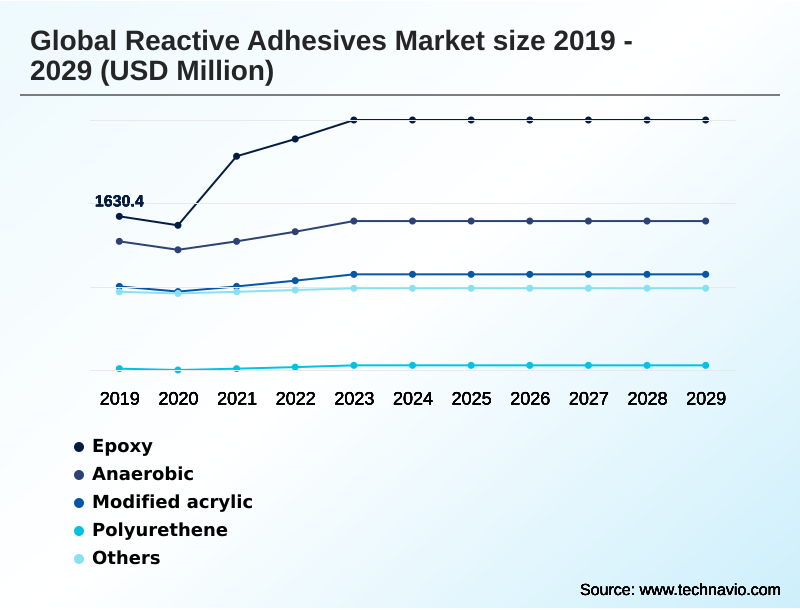
The reactive adhesives industry research report provides comprehensive data (region-wise segment analysis), with forecasts and estimates in "USD million" for the period 2025-2029, as well as historical data from 2019-2023 for the following segments.
- Product
- Epoxy
- Anaerobic
- Modified acrylic
- Polyurethene
- Others
- Application
- Structural bonding
- Surface sealing
- Component assembly
- End-user
- Building and construction
- Transportation
- Electronics
- Renewable energy
- Healthcare
- Geography
- APAC
- China
- Japan
- India
- Europe
- Germany
- UK
- France
- North America
- US
- Canada
- Mexico
- Middle East and Africa
- Saudi Arabia
- UAE
- South Africa
- South America
- Brazil
- Argentina
- Rest of World (ROW)
- APAC
By Product Insights
The epoxy segment is estimated to witness significant growth during the forecast period.
Epoxy-based formulations are pivotal in the reactive adhesives market, distinguished by their polymerization process involving resins and hardeners. This cross-linking chemical reaction creates robust covalent bond formation, yielding superior stiffness and strength.
The adaptability of two-component epoxy systems and one-component epoxy adhesives allows for tailored mechanical strength and thermal resistance, suiting diverse structural bonding applications. These high-performance adhesives are essential in sectors from electronics to aerospace, where adhesive bonding technology is critical.
Innovations in epoxy resin adhesives have led to specialized formulations, including flame-retardant and cryogenically serviceable variants, which improve operational safety.
Effective substrate adhesion properties on a wide range of materials has led to their adoption over traditional fasteners in many industrial manufacturing processes, improving product durability by over 20%.
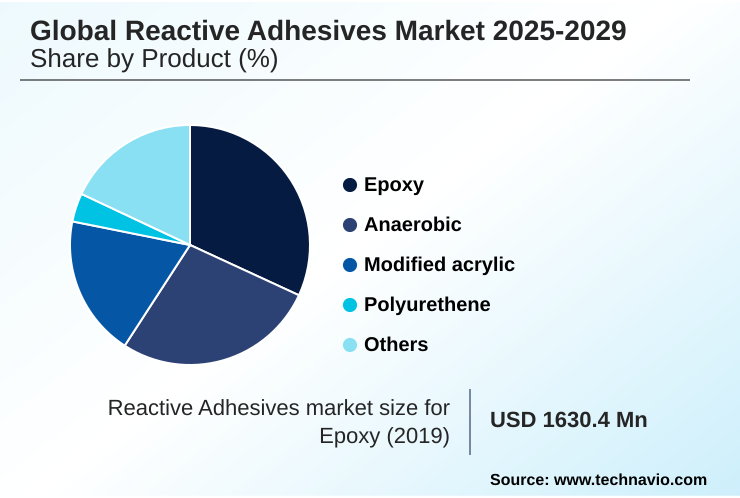
The Epoxy segment was valued at USD 2.54 billion in 2023 and showed a gradual increase during the forecast period.
Regional Analysis
APAC is estimated to contribute 59.7% to the growth of the global market during the forecast period.Technavio’s analysts have elaborately explained the regional trends and drivers that shape the market during the forecast period.
See How Reactive Adhesives Market Demand is Rising in APAC Get Free Sample
The geographic landscape is characterized by strong industrial demand in established and emerging economies. Regions with significant automotive and electronics manufacturing are key consumers, utilizing polyurethane reactive adhesives and electronics encapsulation adhesives for multi-material joining.
The growth in these areas is supported by investments in advanced manufacturing, where the use of dissimilar substrate bonding techniques has improved production efficiency by 15%.
APAC leads market expansion, contributing over 59% of the incremental growth, driven by massive infrastructure and manufacturing projects. In these regions, the adoption of water-based adhesive technology and other sustainable adhesive materials is accelerating to meet global environmental standards.
This focus on product development cycle optimization and regulatory alignment is critical for vendors navigating diverse regional requirements for construction adhesive sealants and other niche market applications.
Market Dynamics
Our researchers analyzed the data with 2024 as the base year, along with the key drivers, trends, and challenges. A holistic analysis of drivers will help companies refine their marketing strategies to gain a competitive advantage.
- Strategic decision-making in the reactive adhesives market requires a deep understanding of specific application needs and technological advancements. The demand for high-strength reactive adhesives for automotive applications, particularly for adhesives for EV battery assembly, is reshaping product development priorities.
- Manufacturers are focused on improving bond strength in reactive adhesives while simultaneously reducing curing time for epoxy adhesives to enhance assembly line efficiency. In the construction sector, the adoption of low-VOC reactive adhesives for construction and weather-resistant sealants for building facades aligns with green building mandates. For industrial machinery, the reliability of anaerobic adhesives for industrial machinery is paramount.
- A key operational challenge is sourcing sustainable alternatives to solvent-based adhesives, with companies that successfully transition reporting supply chain risk reductions of up to 20% compared to those reliant on volatile petrochemicals. The versatility of these materials is further demonstrated in applications like reactive hot melt for woodworking and specialized medical grade reactive adhesive solutions.
- As industries increasingly use composites, the need for effective structural adhesives for composite bonding grows. Understanding the nuances of surface preparation for structural bonding and making an informed comparison of one-part vs two-part epoxies are critical for success. The market's direction is also influenced by price trends of reactive adhesive raw materials and the regulatory impact on reactive adhesive formulations.
- Future growth will likely stem from advancements in hybrid reactive adhesive technology and the ability to bond dissimilar materials with modified acrylics, particularly in adhesives for renewable energy applications and polyurethane adhesives for flexible packaging.
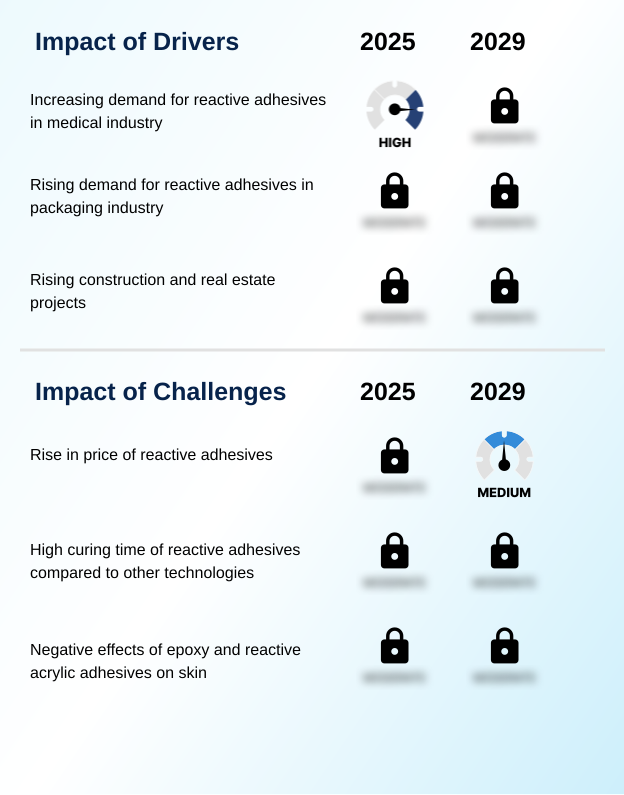
What are the key market drivers leading to the rise in the adoption of Reactive Adhesives Industry?
- The increasing demand for reactive adhesives within the medical industry serves as a key driver for market growth.
- Key market drivers stem from the performance demands of advanced industries.
- The automotive sector's transition to electric vehicles fuels demand for automotive structural adhesives and specialized thermal management adhesives for battery systems, where their use can improve heat dissipation efficiency by over 10%.
- Similarly, the aerospace industry relies on heat resistant adhesives and materials with high fatigue resistance properties for critical assemblies.
- The increasing sophistication of electronics requires advanced moisture-curing polyurethanes for encapsulation and protection, with precise application improving component lifespan by as much as 25%.
- The need for robust medical device adhesives is another significant driver, where adhesive viscosity control and biocompatibility are paramount. These end-user industry applications continually push the boundaries of adhesive product innovation, demanding materials with superior performance and reliability.
What are the market trends shaping the Reactive Adhesives Industry?
- The market is experiencing a significant trend toward non-hazardous, green, and sustainable reactive adhesives. This shift is driven by stricter environmental regulations and growing consumer preference for eco-friendly products.
- A primary trend is the push for sustainability, driving innovation in green adhesive technology. The development of e-beam curable adhesives and bio-based adhesive formulations is accelerating, with some new processes reducing energy consumption by up to 20%. This shift away from traditional petrochemical-based feedstocks addresses both regulatory pressures and corporate sustainability goals.
- In parallel, advancements in hybrid resin formulations are enabling the creation of impact resistant adhesives with enhanced performance characteristics. These materials are crucial for lightweight material bonding in demanding sectors. For instance, manufacturers using these new formulations have reported a 15% increase in product durability.
- The focus on the entire product development cycle ensures that recyclable adhesive products are designed for the circular economy, improving end-of-life material recovery.
What challenges does the Reactive Adhesives Industry face during its growth?
- A primary challenge affecting industry growth is the rise in the price of reactive adhesives, driven by raw material cost volatility.
- The primary challenge facing the market is managing the adhesive price volatility associated with adhesive raw materials. Fluctuations in feedstock costs can impact profit margins by as much as 5-10% in a single quarter, complicating financial planning.
- Another hurdle is optimizing the adhesive cure time without compromising chemical resistance properties or bond integrity, a critical factor in high-volume industrial manufacturing processes. The implementation of new environmental regulations concerning volatile organic compound (VOC) emissions requires significant R&D investment to ensure regulatory compliance standards.
- For instance, reformulating a product line to meet new standards can increase development costs by 15%. Providing adequate technical support services for increasingly complex custom adhesive formulation and application processes also presents an ongoing operational challenge for suppliers.
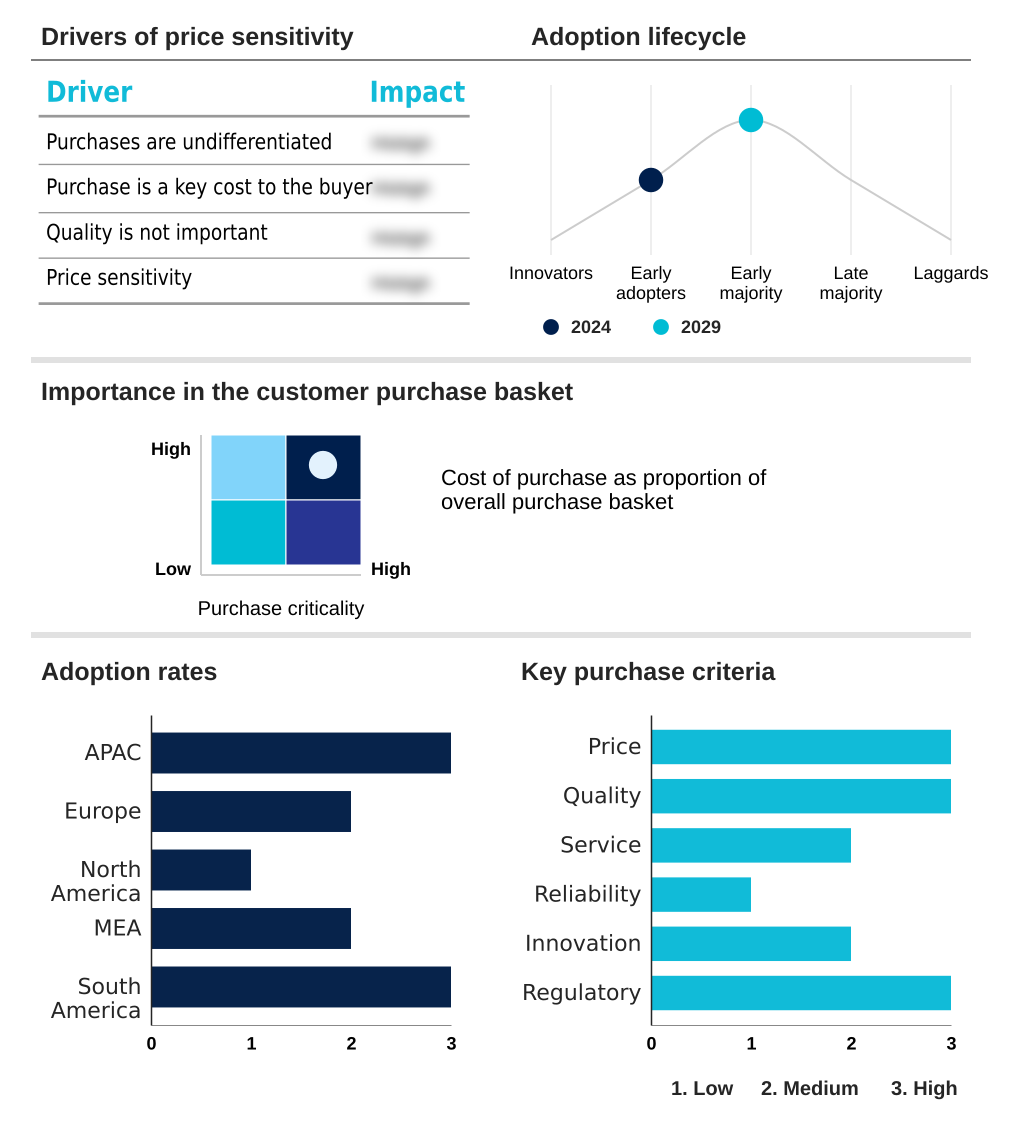
Exclusive Technavio Analysis on Customer Landscape
The reactive adhesives market forecasting report includes the adoption lifecycle of the market, covering from the innovator’s stage to the laggard’s stage. It focuses on adoption rates in different regions based on penetration. Furthermore, the reactive adhesives market report also includes key purchase criteria and drivers of price sensitivity to help companies evaluate and develop their market growth analysis strategies.
Customer Landscape of Reactive Adhesives Industry
Competitive Landscape
Companies are implementing various strategies, such as strategic alliances, reactive adhesives market forecast, partnerships, mergers and acquisitions, geographical expansion, and product/service launches, to enhance their presence in the industry.
3M Co. - Offerings include advanced polyurethane reactive adhesives engineered for high-performance industrial bonding and assembly applications, enhancing manufacturing efficiency and product durability.
The industry research and growth report includes detailed analyses of the competitive landscape of the market and information about key companies, including:
- 3M Co.
- Arkema Group
- Avery Dennison Corp.
- Buhnen GmbH and Co. KG
- Collano AG
- Dow Chemical Co.
- Franklin International
- H.B. Fuller Co.
- Henkel AG and Co. KGaA
- Hexion Inc.
- Huntsman International LLC
- Illinois Tool Works Inc.
- Intertape Polymer Group Inc.
- Jowat SE
- LINTEC Corp.
- Master Bond Inc.
- Parker Hannifin Corp.
- Pidilite Industries Ltd.
- Sika AG
- Wacker Chemie AG
Qualitative and quantitative analysis of companies has been conducted to help clients understand the wider business environment as well as the strengths and weaknesses of key industry players. Data is qualitatively analyzed to categorize companies as pure play, category-focused, industry-focused, and diversified; it is quantitatively analyzed to categorize companies as dominant, leading, strong, tentative, and weak.
Recent Development and News in Reactive adhesives market
- In August 2024, Henkel commenced production at its new polyurethane reactive hot melt adhesive reactor in Shanghai, enhancing its capacity to serve the regional market.
- In November 2024, Henkel expanded its portfolio for maintenance and repair solutions by acquiring Critica Infrastructure, targeting critical infrastructure applications.
- In December 2024, Arkema finalized its acquisition of Dow's flexible packaging laminating adhesives business, strengthening its position in sustainable packaging solutions.
- In February 2025, H.B. Fuller launched a new line of thermally conductive reactive adhesives specifically designed for electric vehicle battery pack assembly, addressing thermal management challenges.
Dive into Technavio’s robust research methodology, blending expert interviews, extensive data synthesis, and validated models for unparalleled Reactive Adhesives Market insights. See full methodology.
| Market Scope | |
|---|---|
| Page number | 309 |
| Base year | 2024 |
| Historic period | 2019-2023 |
| Forecast period | 2025-2029 |
| Growth momentum & CAGR | Accelerate at a CAGR of 7.3% |
| Market growth 2025-2029 | USD 2853.1 million |
| Market structure | Fragmented |
| YoY growth 2024-2025(%) | 6.7% |
| Key countries | China, Japan, India, South Korea, Australia, Indonesia, Germany, UK, France, Italy, Spain, The Netherlands, US, Canada, Mexico, Saudi Arabia, UAE, South Africa, Egypt, Nigeria, Brazil, Argentina and Chile |
| Competitive landscape | Leading Companies, Market Positioning of Companies, Competitive Strategies, and Industry Risks |
Research Analyst Overview
- The reactive adhesives market is evolving beyond simple bonding to become a critical enabler of advanced manufacturing. The core of this shift lies in a diverse portfolio including epoxy resin adhesives, anaerobic threadlockers, and modified acrylic adhesives, with polyurethane reactive adhesives being essential for flexible applications.
- Boardroom decisions are now heavily influenced by the need for sustainable solutions, driving investment in low-VOC adhesive formulations and thermoset resin technology. For example, firms adopting these technologies have seen a 15% improvement in their environmental compliance ratings. From intricate electronics encapsulation adhesives to large-scale aerospace adhesive solutions, the right adhesive bonding technology is crucial.
- Success in structural bonding applications depends on the performance of one-component and two-component epoxy systems, alongside specialized methacrylate adhesives. The market supports everything from component assembly adhesives to surface sealing compounds, utilizing systems like polymerization initiators to trigger covalent bond formation and cross-linking chemical reactions.
- Whether it's ambient temperature curing or using reactive hot melt adhesives, the goal is optimal substrate adhesion properties. Formulations range from solvent-borne adhesive systems to advanced silane modified polymers and silicone pressure-sensitive adhesives (PSAs). The use of high-performance adhesives in medical device adhesives, construction adhesive sealants, and renewable energy adhesives highlights their versatility.
- The development of hybrid resin formulations and E-beam curable adhesives, including moisture-curing polyurethanes, addresses the demand for heat resistant, chemical resistant, and flexible packaging adhesives, solidifying their role in creating next-generation automotive structural adhesives.
What are the Key Data Covered in this Reactive Adhesives Market Research and Growth Report?
-
What is the expected growth of the Reactive Adhesives Market between 2025 and 2029?
-
USD 2.85 billion, at a CAGR of 7.3%
-
-
What segmentation does the market report cover?
-
The report is segmented by Product (Epoxy, Anaerobic, Modified acrylic, Polyurethene, Others), Application (Structural bonding, Surface sealing, Component assembly), End-user (Building and construction, Transportation, Electronics, Renewable energy, Healthcare) and Geography (APAC, Europe, North America, Middle East and Africa, South America)
-
-
Which regions are analyzed in the report?
-
APAC, Europe, North America, Middle East and Africa and South America
-
-
What are the key growth drivers and market challenges?
-
Increasing demand for reactive adhesives in medical industry, Rise in price of reactive adhesives
-
-
Who are the major players in the Reactive Adhesives Market?
-
3M Co., Arkema Group, Avery Dennison Corp., Buhnen GmbH and Co. KG, Collano AG, Dow Chemical Co., Franklin International, H.B. Fuller Co., Henkel AG and Co. KGaA, Hexion Inc., Huntsman International LLC, Illinois Tool Works Inc., Intertape Polymer Group Inc., Jowat SE, LINTEC Corp., Master Bond Inc., Parker Hannifin Corp., Pidilite Industries Ltd., Sika AG and Wacker Chemie AG
-
Market Research Insights
- Market dynamics are shaped by a focus on performance and efficiency. The adoption of custom adhesive formulation allows end-users to achieve specific bond strength testing criteria, improving product reliability by over 25%. Concurrently, the push for green adhesive technology and adherence to regulatory compliance standards is compelling innovation in sustainable adhesive materials.
- This shift has led to a 15% reduction in volatile organic compound (VOC) emissions for some manufacturers. Challenges such as adhesive price volatility are being managed through strategic sourcing of adhesive raw materials and optimized supply chain logistics.
- Furthermore, the integration of automated dispensing systems in industrial manufacturing processes has decreased application errors by up to 20%, highlighting the market's commitment to enhancing both product quality and operational excellence through adhesive product innovation.
We can help! Our analysts can customize this reactive adhesives market research report to meet your requirements.
 RIA -
RIA - 
