Ready-To-Eat (RTE) Popcorn Market Analysis, Size, and Forecast 2025-2029: North America (US and Canada), Europe (France, Germany, Italy, The Netherlands, and UK), APAC (China, India, and Japan), and Rest of World (ROW)

Ready-To-Eat (RTE) Popcorn Market Analysis, Size, and Forecast 2025-2029:
North America (US and Canada), Europe (France, Germany, Italy, The Netherlands, and UK), APAC (China, India, and Japan), and Rest of World (ROW)

Published: Apr 2025 227 Pages SKU: IRTNTR72413

Market Overview at a Glance

$3.92 B
Market Opportunity
8.5%
CAGR
7.7
YoY growth 2024-2025(%)

Ready-To-Eat (RTE) Popcorn Market Size 2025-2029

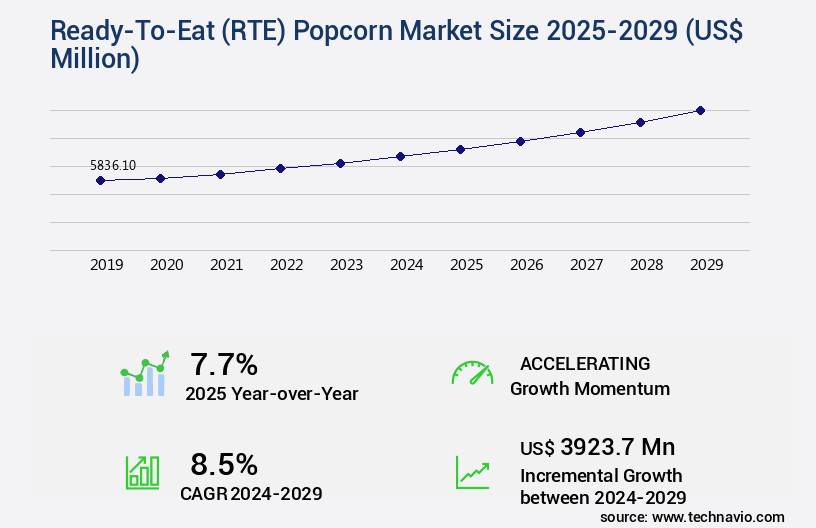
The ready-to-eat (RTE) popcorn market size is valued to increase USD 3.92 billion, at a CAGR of 8.5% from 2024 to 2029. Expansion of retail stores will drive the ready-to-eat (RTE) popcorn market.

Major Market Trends & Insights

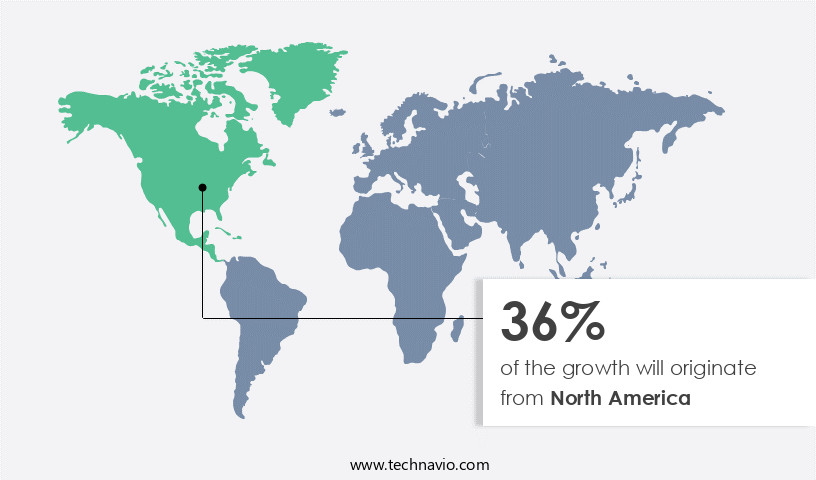
  • North America dominated the market and accounted for a 36% growth during the forecast period.
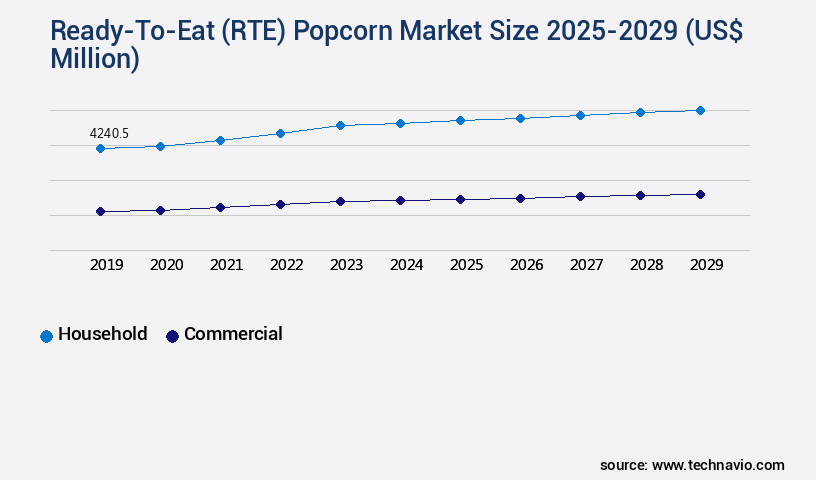
  • By Application - Household segment was valued at USD 4.24 billion in 2023
  • By Product - Savory segment accounted for the largest market revenue share in 2023

Market Size & Forecast

  • Market Opportunities: USD 100.62 million
  • Market Future Opportunities: USD 3923.70 million
  • CAGR from 2024 to 2029 : 8.5%

Market Summary

  • The market has experienced significant growth, with global sales reaching USD 6.5 billion in 2020. This expansion can be attributed to several key factors. First, the convenience of RTE popcorn aligns with consumers' increasingly busy lifestyles, making it a popular snack choice. Additionally, evolving taste preferences have led to an influx of innovative flavors, catering to diverse palates and expanding the market's reach. Despite these opportunities, challenges persist. Fluctuating prices of corn, a primary ingredient, can impact production costs and profitability. Moreover, intense competition among market players necessitates continuous innovation to maintain a competitive edge. The future of the RTE popcorn market is promising, as manufacturers explore new ways to cater to health-conscious consumers through the use of natural ingredients and reduced sodium levels.
  • Furthermore, the integration of technology, such as smart packaging and automated production lines, aims to enhance both efficiency and consumer experience. In conclusion, the RTE popcorn market's growth is driven by consumer preferences for convenience and innovation, while challenges include price fluctuations and competition. Market players must stay agile and responsive to maintain market share and capitalize on emerging trends.

What will be the Size of the Ready-To-Eat (RTE) Popcorn Market during the forecast period?

Ready-To-Eat (RTE) Popcorn Market Size

Get Key Insights on Market Forecast (PDF) Request Free Sample

How is the Ready-To-Eat (RTE) Popcorn Market Segmented ?

The ready-to-eat (RTE) popcorn industry research report provides comprehensive data (region-wise segment analysis), with forecasts and estimates in "USD million" for the period 2025-2029, as well as historical data from 2019-2023 for the following segments.

  • Application
    • Household
    • Commercial
  • Product
    • Savory
    • Sweet
    • Others
  • Distribution Channel
    • Supermarkets and hypermarkets
    • Convenience stores
    • Online retail
    • Specialty food stores
    • Others
  • Geography
    • North America
      • US
      • Canada
    • Europe
      • France
      • Germany
      • Italy
      • The Netherlands
      • UK
    • APAC
      • China
      • India
      • Japan
    • Rest of World (ROW)

By Application Insights

The household segment is estimated to witness significant growth during the forecast period.

In the dynamic and evolving market of 2024, the household segment is witnessing robust growth, fueled by the rising consumer trend towards convenient and healthier snack choices, including organic, non-GMO, and gluten-free options. Social media platforms, such as Instagram and Facebook, are instrumental in promoting RTE popcorn, showcasing its versatility for various occasions, from picnics and house parties to family gatherings. Innovative packaging formats, like microwaveable bags and portable snack-sized servings, cater to the health-conscious consumer base. The gourmet popcorn market, with its diverse flavors like caramel, cheese, and spicy varieties, is expanding the appeal of this popular snack.

Ready-To-Eat (RTE) Popcorn Market Size

Request Free Sample

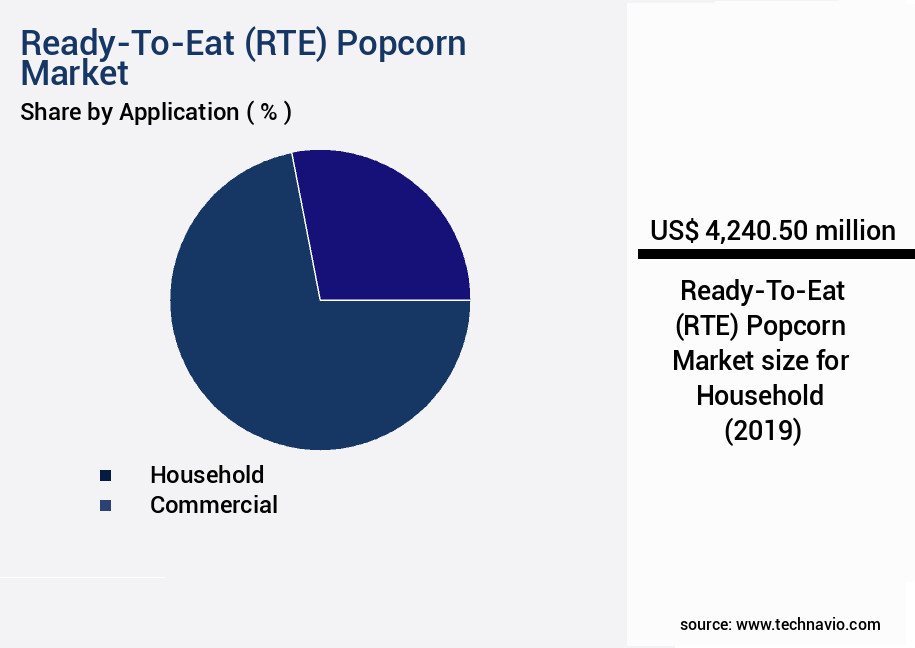
The Household segment was valued at USD 4.24 billion in 2019 and showed a gradual increase during the forecast period.

Moreover, the increasing popularity of home streaming and movie nights has significantly boosted demand for RTE popcorn. According to recent market studies, the global RTE popcorn market is projected to reach a value of USD 12.6 billion by 2027. To ensure product quality, manufacturers focus on various aspects, such as kernel moisture content, aflatoxin contamination, colorimetric analysis, starch gelatinization, processing yield optimization, shelf life stability, extrusion cooking, microbial contamination risk, texture profile analysis, aroma compound retention, packaging film permeability, energy efficiency improvement, water activity levels, heat transfer coefficient, microwave processing, thermal processing kinetics, flavoring encapsulation, quality control metrics, modified atmosphere packaging, popping expansion ratio, ingredient sourcing strategies, oxygen scavenging technology, protein denaturation, vacuum packaging process, packaging material selection, consumer acceptance testing, sensory attribute mapping, sensory evaluation methods, lipid oxidation, supply chain management, mass transfer modeling, flavor volatility assessment, oil absorption rate, and waste reduction strategies.

Ready-To-Eat (RTE) Popcorn Market Size

Request Free Sample

Regional Analysis

North America is estimated to contribute 36% to the growth of the global market during the forecast period. Technavio's analysts have elaborately explained the regional trends and drivers that shape the market during the forecast period.

Ready-To-Eat (RTE) Popcorn Market Share by Geography

See How Ready-To-Eat (RTE) Popcorn Market Demand is Rising in North America Request Free Sample

In the global ready-to-eat popcorn market, North America holds a significant share, with the United States and Canada being the primary consumers. The region's dominance is attributed to the increasing preference for convenient and affordable snacking options. The market remains moderately concentrated with key players such as Campbell Soup Co., Conagra Brands Inc., PepsiCo Inc., Quinn Snacks, and Proper Food leading the charge. The growth of the North American market is driven by the popularity of both traditional and innovative popcorn flavors. Ready-to-eat popcorn has expanded its reach beyond households, finding a place in movie theaters, sporting events, fairs, and other public venues.

Market Dynamics

Our researchers analyzed the data with 2024 as the base year, along with the key drivers, trends, and challenges. A holistic analysis of drivers will help companies refine their marketing strategies to gain a competitive advantage.

The market is a significant segment within the global snack industry, with continuous research and development efforts focused on enhancing product quality and consumer satisfaction. Several factors influence the production and quality of RTE popcorn. One crucial aspect is the popping temperature's impact on kernel expansion, which determines the popcorn's size, shape, and texture. An optimal temperature ensures uniform expansion and prevents burning. Moisture content is another critical factor, as it affects popcorn texture, with ideal moisture levels ensuring a crisp and light texture. The relationship between oil absorption and flavor release is essential in RTE popcorn production. Optimizing microwave processing parameters, such as power levels and cooking times, is necessary to achieve even oil distribution and maximize flavor release. Packaging plays a vital role in maintaining popcorn shelf life. Evaluating different packaging films is crucial to ensure adequate moisture and oxygen barrier properties. Consumer preferences for various popcorn flavors are also essential, with continuous research focusing on developing new flavoring systems and assessing sensory attributes. Flavor encapsulation methods and various coating techniques are used to enhance popcorn's taste and texture. Determining critical control points in production and assessing energy efficiency during processing are essential for ensuring product consistency and sustainability. Storage temperature's impact on popcorn quality attributes is significant, with modified atmosphere packaging and vacuum packaging used to preserve aroma and flavor. Ingredient quality also influences popcorn characteristics, with the use of high-quality kernels and seasonings essential for optimal product performance. Comparing different processing methods, such as extrusion and air popping, and assessing their impact on product quality and consumer acceptance of various textures, is an ongoing research focus in the RTE popcorn market. Overall, the market's growth is driven by consumer demand for convenient, high-quality snack options, and continuous innovation in production techniques and flavor development.

In the growing Ready-To-Eat (RTE) Popcorn Market, product quality, shelf life, and flavor innovation are key factors influencing consumer satisfaction and brand success. A critical aspect of production is understanding the impact of popping temperature on kernel expansion. The right temperature ensures maximum expansion, minimizing unpopped kernels and improving texture and mouthfeel. Equally important is the effect of moisture content on popcorn texture. Too little moisture leads to incomplete popping, while too much can make the final product chewy rather than crisp. Manufacturers are increasingly focusing on the optimization of microwave processing parameters for popcorn, aiming to achieve uniform popping while preserving flavor and texture, especially in home-use products.

To maintain quality after production, the evaluation of different packaging films for popcorn shelf life is essential. Barrier properties against moisture, oxygen, and light significantly influence freshness and crunchiness over time. Complementing this, the application of modified atmosphere packaging for popcorn preservation is becoming more common, as it helps extend shelf life by slowing oxidation and microbial activity. Understanding the analysis of consumer preferences for various popcorn flavors allows producers to develop targeted flavor profiles, from classic butter and caramel to trending spicy or savory blends. The comparison of flavor encapsulation methods for popcorn is critical in maintaining taste stability during storage and enhancing the flavor release during consumption.

Texture and appearance are also affected by the assessment of various coating techniques for popcorn. Techniques like panning, spraying, and tumbling influence how well seasonings and sweeteners adhere, and how they interact with the popcorn's surface during storage. Maintaining quality and safety across production involves the determination of critical control points in popcorn production. From raw material inspection to final packaging, monitoring these points ensures consistency, food safety, and regulatory compliance.

Storage conditions also play a pivotal role in product integrity. The impact of storage temperature on popcorn quality attributes such as crispness, aroma, and visual appeal is well-documented, with higher temperatures accelerating quality degradation. In this context, the effect of vacuum packaging on popcorn aroma retention is gaining attention, as reducing air exposure helps preserve volatile compounds that define the product's sensory appeal.

Finally, to ensure consumer satisfaction, the evaluation of sensory attributes for ready-to-eat popcorn provides essential insights into flavor, texture, and overall acceptability. Sensory panels and instrumental texture analysis work together to guide product formulation and quality control. Together, these research areas support the continued innovation and quality assurance in the ready-to-eat popcorn market, helping producers meet consumer expectations while optimizing manufacturing and packaging processes.

Ready-To-Eat (RTE) Popcorn Market Size

What are the key market drivers leading to the rise in the adoption of Ready-To-Eat (RTE) Popcorn Industry?

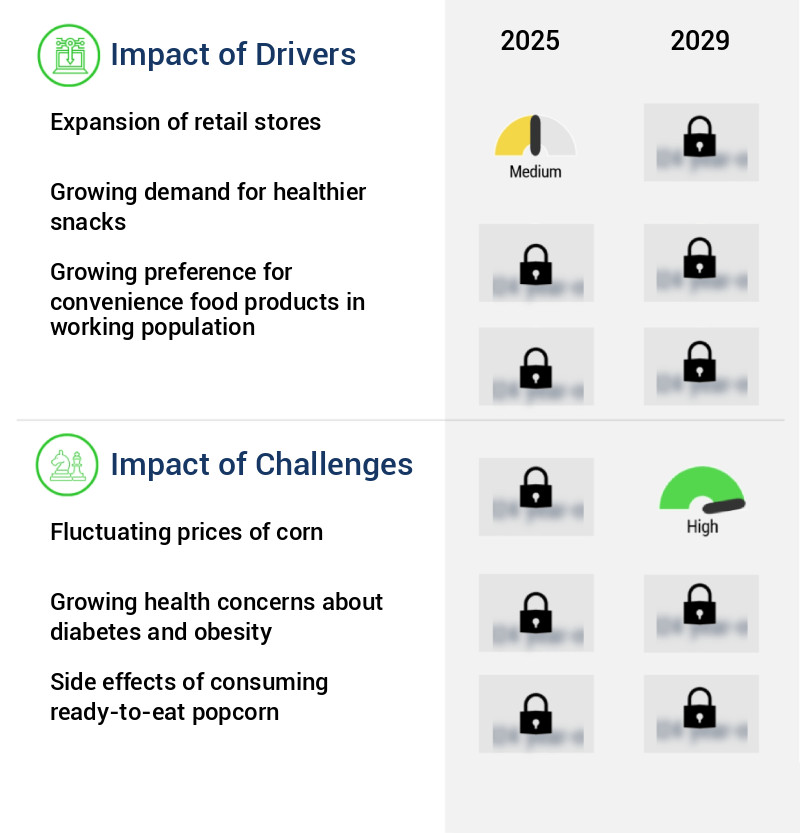
  • The expansion of retail stores serves as the primary catalyst for market growth. 
  • The ready-to-eat popcorn market has experienced significant growth, driven by the expanding organized retail sector. Supermarkets, hypermarkets, and specialty stores are increasingly popular distribution channels for this product category. Companies compete for limited shelf space in these retail outlets, making them a crucial market for ready-to-eat popcorn manufacturers. Consumers prioritize convenience and value for money, and organized retailers cater to these preferences by offering a wide range of products under one roof.
  • The importance of these retailers in the market is underscored by their dominance in the food industry. For instance, supermarkets account for a substantial share of the global food retail sales. This trend is expected to continue, as consumers' preference for convenient and affordable food options persists.

What are the market trends shaping the Ready-To-Eat (RTE) Popcorn Industry?

  • Taste preferences are evolving and becoming the latest market trend. (Formal tone, sentence case)
  • The market experiences continuous evolution, catering to shifting consumer preferences for savory snacks. Millennials, a significant consumer demographic, particularly in Europe and the Americas, seek novelty and health-conscious options. In response, manufacturers innovate through product development, brand extensions, and the introduction of new brands. The global RTE popcorn market's growth is driven by this consumer-centric approach. Companies explore various ingredients and flavors to capture the attention of health-conscious consumers.
  • For instance, ethnic and exotic flavors like fruit-flavored chutney popcorn and barbecue popcorn are gaining popularity. This focus on innovation ensures the sustainability of the RTE popcorn industry.

What challenges does the Ready-To-Eat (RTE) Popcorn Industry face during its growth?

  • The volatile pricing of corn poses a significant challenge to the expansion and growth of the industry. 
  • The market has witnessed significant shifts due to unpredictable corn supply and its subsequent influence on production costs. El Nino, a weather phenomenon, has caused notable damage to corn crops in the US, leading to increased prices and operational challenges for market participants. In addition, weather conditions in certain geographic regions have delayed corn planting, affecting the Eastern Corn Belt, which includes Western Ohio, Indiana, and Illinois. The overall impact of El Nino on corn crop yields remains uncertain. Companies in the RTE Popcorn Market must navigate these supply chain disruptions to maintain production and meet consumer demand.
  • Despite these challenges, the market continues to grow, driven by increasing consumer preference for convenient and healthy snacking options. The RTE Popcorn Market's evolution underscores the importance of adaptability and resilience in the face of external factors.

Exclusive Technavio Analysis on Customer Landscape

The ready-to-eat (RTE) popcorn market forecasting report includes the adoption lifecycle of the market, covering from the innovator's stage to the laggard's stage. It focuses on adoption rates in different regions based on penetration. Furthermore, the ready-to-eat (RTE) popcorn market report also includes key purchase criteria and drivers of price sensitivity to help companies evaluate and develop their market growth analysis strategies.

Ready-To-Eat (RTE) Popcorn Market Share by Geography

 Customer Landscape of Ready-To-Eat (RTE) Popcorn Industry

Competitive Landscape

Companies are implementing various strategies, such as strategic alliances, ready-to-eat (RTE) popcorn market forecast, partnerships, mergers and acquisitions, geographical expansion, and product/service launches, to enhance their presence in the industry.

American Garden - This company specializes in ready-to-eat popcorn products, including microwave and cheese varieties. Their offerings cater to consumers seeking convenient, flavorful snacking options. The American Garden brand, featuring these popcorn variants, represents a significant contribution to the ready-to-eat snack market.

The industry research and growth report includes detailed analyses of the competitive landscape of the market and information about key companies, including:

  • American Garden
  • American Pop Corn Co.
  • Campbell Soup Co.
  • Conagra Brands Inc.
  • Cretors
  • Garrett Popcorn Holding Company LLC
  • Gary Poppins LLC
  • General Mills Inc.
  • Intersnack Group GmbH and Co. KG
  • Newmans Own Inc.
  • Oogies Snacks LLC
  • PepsiCo Inc.
  • PnC popcorn
  • PROPER Snacks
  • Quinn Foods LLC
  • Shallowford Farms Inc.
  • Simply 7 Snacks LLC
  • The Hershey Co.
  • The J.M. Smucker Co.
  • Weaver Popcorn Manufacturing Inc.

Qualitative and quantitative analysis of companies has been conducted to help clients understand the wider business environment as well as the strengths and weaknesses of key industry players. Data is qualitatively analyzed to categorize companies as pure play, category-focused, industry-focused, and diversified; it is quantitatively analyzed to categorize companies as dominant, leading, strong, tentative, and weak.

Recent Development and News in Ready-To-Eat (RTE) Popcorn Market

  • In January 2024, Frito-Lay North America, a PepsiCo subsidiary, introduced a new line of microwavable RTE popcorn under the brand name "PopCorners." This innovation expanded their product portfolio and catered to the growing demand for healthier snacking options (Frito-Lay North America Press Release).
  • In March 2024, Popcorn, Indiana, a leading RTE popcorn manufacturer, announced a strategic partnership with Nestle to distribute their products in the European market. This collaboration aimed to strengthen Popcorn, Indiana's presence in the international arena and tap into Nestle's extensive distribution network (Popcorn, Indiana Press Release).
  • In April 2025, Conagra Brands, a major food manufacturer, completed the acquisition of Duke's Popcorn, a premium RTE popcorn brand. This acquisition allowed Conagra Brands to broaden their snack offerings and enter the gourmet RTE popcorn segment (Conagra Brands Press Release).
  • In May 2025, The Popcorn Board, a research and promotion organization for the U.S. Popcorn industry, announced the launch of a new certification program for RTE popcorn. This program aimed to ensure product quality and adherence to specific nutritional guidelines, providing consumers with more transparency and healthier options (The Popcorn Board Press Release).

Dive into Technavio's robust research methodology, blending expert interviews, extensive data synthesis, and validated models for unparalleled Ready-To-Eat (RTE) Popcorn Market insights. See full methodology.

Market Scope

Report Coverage

Details

Page number

227

Base year

2024

Historic period

2019-2023

Forecast period

2025-2029

Growth momentum & CAGR

Accelerate at a CAGR of 8.5%

Market growth 2025-2029

USD 3923.7 million

Market structure

Fragmented

YoY growth 2024-2025(%)

7.7

Key countries

US, Canada, China, UK, Germany, France, India, Japan, The Netherlands, and Italy

Competitive landscape

Leading Companies, Market Positioning of Companies, Competitive Strategies, and Industry Risks

Request Free Sample

Research Analyst Overview

  • The market continues to evolve, driven by consumer preferences for convenient and healthier snacking options. Kernel moisture content and aflatoxin contamination are critical factors in ensuring product quality and consumer safety. To mitigate these risks, popcorn manufacturers employ colorimetric analysis and starch gelatinization during processing. Processing yield optimization and shelf life stability are essential for maintaining profitability and customer satisfaction. Extrusion cooking and thermal processing kinetics play a significant role in optimizing texture profile analysis and aroma compound retention. Microbial contamination risk is minimized through proper sanitation and packaging film permeability control. Energy efficiency improvements, such as heat transfer coefficient optimization and microwave processing, are essential for reducing production costs.
  • Industry growth is expected to reach double-digit percentages as consumers seek healthier snack alternatives. For instance, a leading popcorn manufacturer increased sales by 15% through flavoring encapsulation and modified atmosphere packaging. Quality control metrics, including sensory attribute mapping and sensory evaluation methods, ensure consistent product quality. Ingredient sourcing strategies, such as oxygen scavenging technology and protein denaturation, impact taste and texture. Vacuum packaging processes and packaging material selection are crucial for maintaining product freshness and extending shelf life. Consumer acceptance testing and waste reduction strategies further enhance market competitiveness. Mass transfer modeling and flavor volatility assessment are essential for optimizing oil absorption rate and minimizing lipid oxidation.
  • Supply chain management and logistics are critical for ensuring on-time delivery and maintaining customer relationships. Overall, the RTE popcorn market remains dynamic, with ongoing innovations in processing, packaging, and ingredient sourcing strategies.

What are the Key Data Covered in this Ready-To-Eat (RTE) Popcorn Market Research and Growth Report?

  • What is the expected growth of the Ready-To-Eat (RTE) Popcorn Market between 2025 and 2029?

    • USD 3.92 billion, at a CAGR of 8.5%

  • What segmentation does the market report cover?

    • The report is segmented by Application (Household and Commercial), Product (Savory, Sweet, and Others), Distribution Channel (Supermarkets and hypermarkets, Convenience stores, Online retail, Specialty food stores, and Others), and Geography (North America, Europe, APAC, South America, and Middle East and Africa)

  • Which regions are analyzed in the report?

    • North America, Europe, APAC, South America, and Middle East and Africa

  • What are the key growth drivers and market challenges?

    • Expansion of retail stores, Fluctuating prices of corn

  • Who are the major players in the Ready-To-Eat (RTE) Popcorn Market?

    • American Garden, American Pop Corn Co., Campbell Soup Co., Conagra Brands Inc., Cretors, Garrett Popcorn Holding Company LLC, Gary Poppins LLC, General Mills Inc., Intersnack Group GmbH and Co. KG, Newmans Own Inc., Oogies Snacks LLC, PepsiCo Inc., PnC popcorn, PROPER Snacks, Quinn Foods LLC, Shallowford Farms Inc., Simply 7 Snacks LLC, The Hershey Co., The J.M. Smucker Co., and Weaver Popcorn Manufacturing Inc.

Market Research Insights

  • The ready-to-eat popcorn market exhibits continuous evolution, driven by consumer preferences and industry advancements. According to recent data, the market size surpassed 1.5 billion units sold annually, with an estimated growth expectation of 5% per annum. An illustrative example of market dynamics is the increasing demand for popcorn with enhanced aroma and improved texture. A leading manufacturer reported a 10% sales increase by introducing a new flavoring compound delivery system.
  • This innovation not only pleased consumers but also allowed for cost optimization through ingredient functionality. Industry experts anticipate this trend to continue, as consumers seek convenient, flavorful, and healthier snack options.

We can help! Our analysts can customize this ready-to-eat (RTE) popcorn market research report to meet your requirements.

Get in touch

1 Executive Summary

  • 1.1 Market overview
    • Executive Summary - Chart on Market Overview
    • Executive Summary - Data Table on Market Overview
    • Executive Summary - Chart on Global Market Characteristics
    • Executive Summary - Chart on Market by Geography
    • Executive Summary - Chart on Market Segmentation by Application
    • Executive Summary - Chart on Market Segmentation by Product
    • Executive Summary - Chart on Market Segmentation by Distribution Channel
    • Executive Summary - Chart on Incremental Growth
    • Executive Summary - Data Table on Incremental Growth
    • Executive Summary - Chart on Company Market Positioning

2 Technavio Analysis

  • 2.1 Analysis of price sensitivity, lifecycle, customer purchase basket, adoption rates, and purchase criteria
    • Analysis of price sensitivity, lifecycle, customer purchase basket, adoption rates, and purchase criteria
  • 2.2 Criticality of inputs and Factors of differentiation
    • Overview on criticality of inputs and factors of differentiation
  • 2.3 Factors of disruption
    • Overview on factors of disruption
  • 2.4 Impact of drivers and challenges
    • Impact of drivers and challenges in 2024 and 2029

3 Market Landscape

  • 3.1 Market ecosystem
    • Parent Market
    • Data Table on - Parent Market
  • 3.2 Market characteristics
    • Market characteristics analysis
  • 3.3 Value chain analysis
    • Value chain analysis

4 Market Sizing

  • 4.1 Market definition
    • Offerings of companies included in the market definition
  • 4.2 Market segment analysis
    • Market segments
  • 4.3 Market size 2024
    • 4.4 Market outlook: Forecast for 2024-2029
      • Chart on Global - Market size and forecast 2024-2029 ($ million)
      • Data Table on Global - Market size and forecast 2024-2029 ($ million)
      • Chart on Global Market: Year-over-year growth 2024-2029 (%)
      • Data Table on Global Market: Year-over-year growth 2024-2029 (%)

    5 Historic Market Size

    • 5.1 Global Ready-To-Eat (RTE) Popcorn Market 2019 - 2023
      • Historic Market Size - Data Table on Global Ready-To-Eat (RTE) Popcorn Market 2019 - 2023 ($ million)
    • 5.2 Application segment analysis 2019 - 2023
      • Historic Market Size - Application Segment 2019 - 2023 ($ million)
    • 5.3 Product segment analysis 2019 - 2023
      • Historic Market Size - Product Segment 2019 - 2023 ($ million)
    • 5.4 Distribution Channel segment analysis 2019 - 2023
      • Historic Market Size - Distribution Channel Segment 2019 - 2023 ($ million)
    • 5.5 Geography segment analysis 2019 - 2023
      • Historic Market Size - Geography Segment 2019 - 2023 ($ million)
    • 5.6 Country segment analysis 2019 - 2023
      • Historic Market Size - Country Segment 2019 - 2023 ($ million)

    6 Qualitative Analysis

    • 6.1 The AI impact on global ready-to-eat (RTE) popcorn market

      7 Five Forces Analysis

      • 7.1 Five forces summary
        • Five forces analysis - Comparison between 2024 and 2029
      • 7.2 Bargaining power of buyers
        • Bargaining power of buyers - Impact of key factors 2024 and 2029
      • 7.3 Bargaining power of suppliers
        • Bargaining power of suppliers - Impact of key factors in 2024 and 2029
      • 7.4 Threat of new entrants
        • Threat of new entrants - Impact of key factors in 2024 and 2029
      • 7.5 Threat of substitutes
        • Threat of substitutes - Impact of key factors in 2024 and 2029
      • 7.6 Threat of rivalry
        • Threat of rivalry - Impact of key factors in 2024 and 2029
      • 7.7 Market condition
        • Chart on Market condition - Five forces 2024 and 2029

      8 Market Segmentation by Application

      • 8.1 Market segments
        • Chart on Application - Market share 2024-2029 (%)
        • Data Table on Application - Market share 2024-2029 (%)
      • 8.2 Comparison by Application
        • Chart on Comparison by Application
        • Data Table on Comparison by Application
      • 8.3 Household - Market size and forecast 2024-2029
        • Chart on Household - Market size and forecast 2024-2029 ($ million)
        • Data Table on Household - Market size and forecast 2024-2029 ($ million)
        • Chart on Household - Year-over-year growth 2024-2029 (%)
        • Data Table on Household - Year-over-year growth 2024-2029 (%)
      • 8.4 Commercial - Market size and forecast 2024-2029
        • Chart on Commercial - Market size and forecast 2024-2029 ($ million)
        • Data Table on Commercial - Market size and forecast 2024-2029 ($ million)
        • Chart on Commercial - Year-over-year growth 2024-2029 (%)
        • Data Table on Commercial - Year-over-year growth 2024-2029 (%)
      • 8.5 Market opportunity by Application
        • Market opportunity by Application ($ million)
        • Data Table on Market opportunity by Application ($ million)

      9 Market Segmentation by Product

      • 9.1 Market segments
        • Chart on Product - Market share 2024-2029 (%)
        • Data Table on Product - Market share 2024-2029 (%)
      • 9.2 Comparison by Product
        • Chart on Comparison by Product
        • Data Table on Comparison by Product
      • 9.3 Savory - Market size and forecast 2024-2029
        • Chart on Savory - Market size and forecast 2024-2029 ($ million)
        • Data Table on Savory - Market size and forecast 2024-2029 ($ million)
        • Chart on Savory - Year-over-year growth 2024-2029 (%)
        • Data Table on Savory - Year-over-year growth 2024-2029 (%)
      • 9.4 Sweet - Market size and forecast 2024-2029
        • Chart on Sweet - Market size and forecast 2024-2029 ($ million)
        • Data Table on Sweet - Market size and forecast 2024-2029 ($ million)
        • Chart on Sweet - Year-over-year growth 2024-2029 (%)
        • Data Table on Sweet - Year-over-year growth 2024-2029 (%)
      • 9.5 Others - Market size and forecast 2024-2029
        • Chart on Others - Market size and forecast 2024-2029 ($ million)
        • Data Table on Others - Market size and forecast 2024-2029 ($ million)
        • Chart on Others - Year-over-year growth 2024-2029 (%)
        • Data Table on Others - Year-over-year growth 2024-2029 (%)
      • 9.6 Market opportunity by Product
        • Market opportunity by Product ($ million)
        • Data Table on Market opportunity by Product ($ million)

      10 Market Segmentation by Distribution Channel

      • 10.1 Market segments
        • Chart on Distribution Channel - Market share 2024-2029 (%)
        • Data Table on Distribution Channel - Market share 2024-2029 (%)
      • 10.2 Comparison by Distribution Channel
        • Chart on Comparison by Distribution Channel
        • Data Table on Comparison by Distribution Channel
      • 10.3 Supermarkets and hypermarkets - Market size and forecast 2024-2029
        • Chart on Supermarkets and hypermarkets - Market size and forecast 2024-2029 ($ million)
        • Data Table on Supermarkets and hypermarkets - Market size and forecast 2024-2029 ($ million)
        • Chart on Supermarkets and hypermarkets - Year-over-year growth 2024-2029 (%)
        • Data Table on Supermarkets and hypermarkets - Year-over-year growth 2024-2029 (%)
      • 10.4 Convenience stores - Market size and forecast 2024-2029
        • Chart on Convenience stores - Market size and forecast 2024-2029 ($ million)
        • Data Table on Convenience stores - Market size and forecast 2024-2029 ($ million)
        • Chart on Convenience stores - Year-over-year growth 2024-2029 (%)
        • Data Table on Convenience stores - Year-over-year growth 2024-2029 (%)
      • 10.5 Online retail - Market size and forecast 2024-2029
        • Chart on Online retail - Market size and forecast 2024-2029 ($ million)
        • Data Table on Online retail - Market size and forecast 2024-2029 ($ million)
        • Chart on Online retail - Year-over-year growth 2024-2029 (%)
        • Data Table on Online retail - Year-over-year growth 2024-2029 (%)
      • 10.6 Specialty food stores - Market size and forecast 2024-2029
        • Chart on Specialty food stores - Market size and forecast 2024-2029 ($ million)
        • Data Table on Specialty food stores - Market size and forecast 2024-2029 ($ million)
        • Chart on Specialty food stores - Year-over-year growth 2024-2029 (%)
        • Data Table on Specialty food stores - Year-over-year growth 2024-2029 (%)
      • 10.7 Others - Market size and forecast 2024-2029
        • Chart on Others - Market size and forecast 2024-2029 ($ million)
        • Data Table on Others - Market size and forecast 2024-2029 ($ million)
        • Chart on Others - Year-over-year growth 2024-2029 (%)
        • Data Table on Others - Year-over-year growth 2024-2029 (%)
      • 10.8 Market opportunity by Distribution Channel
        • Market opportunity by Distribution Channel ($ million)
        • Data Table on Market opportunity by Distribution Channel ($ million)

      11 Customer Landscape

      • 11.1 Customer landscape overview
        • Analysis of price sensitivity, lifecycle, customer purchase basket, adoption rates, and purchase criteria

      12 Geographic Landscape

      • 12.1 Geographic segmentation
        • Chart on Market share by geography 2024-2029 (%)
        • Data Table on Market share by geography 2024-2029 (%)
      • 12.2 Geographic comparison
        • Chart on Geographic comparison
        • Data Table on Geographic comparison
      • 12.3 North America - Market size and forecast 2024-2029
        • Chart on North America - Market size and forecast 2024-2029 ($ million)
        • Data Table on North America - Market size and forecast 2024-2029 ($ million)
        • Chart on North America - Year-over-year growth 2024-2029 (%)
        • Data Table on North America - Year-over-year growth 2024-2029 (%)
      • 12.4 Europe - Market size and forecast 2024-2029
        • Chart on Europe - Market size and forecast 2024-2029 ($ million)
        • Data Table on Europe - Market size and forecast 2024-2029 ($ million)
        • Chart on Europe - Year-over-year growth 2024-2029 (%)
        • Data Table on Europe - Year-over-year growth 2024-2029 (%)
      • 12.5 APAC - Market size and forecast 2024-2029
        • Chart on APAC - Market size and forecast 2024-2029 ($ million)
        • Data Table on APAC - Market size and forecast 2024-2029 ($ million)
        • Chart on APAC - Year-over-year growth 2024-2029 (%)
        • Data Table on APAC - Year-over-year growth 2024-2029 (%)
      • 12.6 South America - Market size and forecast 2024-2029
        • Chart on South America - Market size and forecast 2024-2029 ($ million)
        • Data Table on South America - Market size and forecast 2024-2029 ($ million)
        • Chart on South America - Year-over-year growth 2024-2029 (%)
        • Data Table on South America - Year-over-year growth 2024-2029 (%)
      • 12.7 Middle East and Africa - Market size and forecast 2024-2029
        • Chart on Middle East and Africa - Market size and forecast 2024-2029 ($ million)
        • Data Table on Middle East and Africa - Market size and forecast 2024-2029 ($ million)
        • Chart on Middle East and Africa - Year-over-year growth 2024-2029 (%)
        • Data Table on Middle East and Africa - Year-over-year growth 2024-2029 (%)
      • 12.8 US - Market size and forecast 2024-2029
        • Chart on US - Market size and forecast 2024-2029 ($ million)
        • Data Table on US - Market size and forecast 2024-2029 ($ million)
        • Chart on US - Year-over-year growth 2024-2029 (%)
        • Data Table on US - Year-over-year growth 2024-2029 (%)
      • 12.9 Canada - Market size and forecast 2024-2029
        • Chart on Canada - Market size and forecast 2024-2029 ($ million)
        • Data Table on Canada - Market size and forecast 2024-2029 ($ million)
        • Chart on Canada - Year-over-year growth 2024-2029 (%)
        • Data Table on Canada - Year-over-year growth 2024-2029 (%)
      • 12.10 China - Market size and forecast 2024-2029
        • Chart on China - Market size and forecast 2024-2029 ($ million)
        • Data Table on China - Market size and forecast 2024-2029 ($ million)
        • Chart on China - Year-over-year growth 2024-2029 (%)
        • Data Table on China - Year-over-year growth 2024-2029 (%)
      • 12.11 UK - Market size and forecast 2024-2029
        • Chart on UK - Market size and forecast 2024-2029 ($ million)
        • Data Table on UK - Market size and forecast 2024-2029 ($ million)
        • Chart on UK - Year-over-year growth 2024-2029 (%)
        • Data Table on UK - Year-over-year growth 2024-2029 (%)
      • 12.12 Germany - Market size and forecast 2024-2029
        • Chart on Germany - Market size and forecast 2024-2029 ($ million)
        • Data Table on Germany - Market size and forecast 2024-2029 ($ million)
        • Chart on Germany - Year-over-year growth 2024-2029 (%)
        • Data Table on Germany - Year-over-year growth 2024-2029 (%)
      • 12.13 Japan - Market size and forecast 2024-2029
        • Chart on Japan - Market size and forecast 2024-2029 ($ million)
        • Data Table on Japan - Market size and forecast 2024-2029 ($ million)
        • Chart on Japan - Year-over-year growth 2024-2029 (%)
        • Data Table on Japan - Year-over-year growth 2024-2029 (%)
      • 12.14 India - Market size and forecast 2024-2029
        • Chart on India - Market size and forecast 2024-2029 ($ million)
        • Data Table on India - Market size and forecast 2024-2029 ($ million)
        • Chart on India - Year-over-year growth 2024-2029 (%)
        • Data Table on India - Year-over-year growth 2024-2029 (%)
      • 12.15 France - Market size and forecast 2024-2029
        • Chart on France - Market size and forecast 2024-2029 ($ million)
        • Data Table on France - Market size and forecast 2024-2029 ($ million)
        • Chart on France - Year-over-year growth 2024-2029 (%)
        • Data Table on France - Year-over-year growth 2024-2029 (%)
      • 12.16 Italy - Market size and forecast 2024-2029
        • Chart on Italy - Market size and forecast 2024-2029 ($ million)
        • Data Table on Italy - Market size and forecast 2024-2029 ($ million)
        • Chart on Italy - Year-over-year growth 2024-2029 (%)
        • Data Table on Italy - Year-over-year growth 2024-2029 (%)
      • 12.17 The Netherlands - Market size and forecast 2024-2029
        • Chart on The Netherlands - Market size and forecast 2024-2029 ($ million)
        • Data Table on The Netherlands - Market size and forecast 2024-2029 ($ million)
        • Chart on The Netherlands - Year-over-year growth 2024-2029 (%)
        • Data Table on The Netherlands - Year-over-year growth 2024-2029 (%)
      • 12.18 Market opportunity by geography
        • Market opportunity by geography ($ million)
        • Data Tables on Market opportunity by geography ($ million)

      13 Drivers, Challenges, and Opportunity/Restraints

      • 13.1 Market drivers
        • 13.2 Market challenges
          • 13.3 Impact of drivers and challenges
            • Impact of drivers and challenges in 2024 and 2029
          • 13.4 Market opportunities/restraints

            14 Competitive Landscape

            • 14.1 Overview
              • 14.2 Competitive Landscape
                • Overview on criticality of inputs and factors of differentiation
              • 14.3 Landscape disruption
                • Overview on factors of disruption
              • 14.4 Industry risks
                • Impact of key risks on business

              15 Competitive Analysis

              • 15.1 Companies profiled
                • Companies covered
              • 15.2 Company ranking index
                • Company ranking index
              • 15.3 Market positioning of companies
                • Matrix on companies position and classification
              • 15.4 American Garden
                • American Garden - Overview
                • American Garden - Product / Service
                • American Garden - Key offerings
                • SWOT
              • 15.5 American Pop Corn Co.
                • American Pop Corn Co. - Overview
                • American Pop Corn Co. - Product / Service
                • American Pop Corn Co. - Key offerings
                • SWOT
              • 15.6 Campbell Soup Co.
                • Campbell Soup Co. - Overview
                • Campbell Soup Co. - Business segments
                • Campbell Soup Co. - Key news
                • Campbell Soup Co. - Key offerings
                • Campbell Soup Co. - Segment focus
                • SWOT
              • 15.7 Conagra Brands Inc.
                • Conagra Brands Inc. - Overview
                • Conagra Brands Inc. - Business segments
                • Conagra Brands Inc. - Key news
                • Conagra Brands Inc. - Key offerings
                • Conagra Brands Inc. - Segment focus
                • SWOT
              • 15.8 Cretors
                • Cretors - Overview
                • Cretors - Product / Service
                • Cretors - Key offerings
                • SWOT
              • 15.9 Gary Poppins LLC
                • Gary Poppins LLC - Overview
                • Gary Poppins LLC - Product / Service
                • Gary Poppins LLC - Key offerings
                • SWOT
              • 15.10 General Mills Inc.
                • General Mills Inc. - Overview
                • General Mills Inc. - Business segments
                • General Mills Inc. - Key news
                • General Mills Inc. - Key offerings
                • General Mills Inc. - Segment focus
                • SWOT
              • 15.11 Intersnack Group GmbH and Co. KG
                • Intersnack Group GmbH and Co. KG - Overview
                • Intersnack Group GmbH and Co. KG - Product / Service
                • Intersnack Group GmbH and Co. KG - Key offerings
                • SWOT
              • 15.12 Newmans Own Inc.
                • Newmans Own Inc. - Overview
                • Newmans Own Inc. - Product / Service
                • Newmans Own Inc. - Key offerings
                • SWOT
              • 15.13 Oogies Snacks LLC
                • Oogies Snacks LLC - Overview
                • Oogies Snacks LLC - Product / Service
                • Oogies Snacks LLC - Key offerings
                • SWOT
              • 15.14 PepsiCo Inc.
                • PepsiCo Inc. - Overview
                • PepsiCo Inc. - Business segments
                • PepsiCo Inc. - Key news
                • PepsiCo Inc. - Key offerings
                • PepsiCo Inc. - Segment focus
                • SWOT
              • 15.15 Shallowford Farms Inc.
                • Shallowford Farms Inc. - Overview
                • Shallowford Farms Inc. - Product / Service
                • Shallowford Farms Inc. - Key offerings
                • SWOT
              • 15.16 Simply 7 Snacks LLC
                • Simply 7 Snacks LLC - Overview
                • Simply 7 Snacks LLC - Product / Service
                • Simply 7 Snacks LLC - Key offerings
                • SWOT
              • 15.17 The Hershey Co.
                • The Hershey Co. - Overview
                • The Hershey Co. - Business segments
                • The Hershey Co. - Key news
                • The Hershey Co. - Key offerings
                • The Hershey Co. - Segment focus
                • SWOT
              • 15.18 The J.M. Smucker Co.
                • The J.M. Smucker Co. - Overview
                • The J.M. Smucker Co. - Business segments
                • The J.M. Smucker Co. - Key news
                • The J.M. Smucker Co. - Key offerings
                • The J.M. Smucker Co. - Segment focus
                • SWOT

              16 Appendix

              • 16.1 Scope of the report
                • 16.2 Inclusions and exclusions checklist
                  • Inclusions checklist
                  • Exclusions checklist
                • 16.3 Currency conversion rates for US$
                  • Currency conversion rates for US$
                • 16.4 Research methodology
                  • Research methodology
                • 16.5 Data procurement
                  • Information sources
                • 16.6 Data validation
                  • Data validation
                • 16.7 Validation techniques employed for market sizing
                  • Validation techniques employed for market sizing
                • 16.8 Data synthesis
                  • Data synthesis
                • 16.9 360 degree market analysis
                  • 360 degree market analysis
                • 16.10 List of abbreviations
                  • List of abbreviations

                Research Methodology

                Technavio presents a detailed picture of the market by way of study, synthesis, and summation of data from multiple sources. The analysts have presented the various facets of the market with a particular focus on identifying the key industry influencers. The data thus presented is comprehensive, reliable, and the result of extensive research, both primary and secondary.

                INFORMATION SOURCES

                Primary sources

                • Manufacturers and suppliers
                • Channel partners
                • Industry experts
                • Strategic decision makers

                Secondary sources

                • Industry journals and periodicals
                • Government data
                • Financial reports of key industry players
                • Historical data
                • Press releases

                DATA ANALYSIS

                Data Synthesis

                • Collation of data
                • Estimation of key figures
                • Analysis of derived insights

                Data Validation

                • Triangulation with data models
                • Reference against proprietary databases
                • Corroboration with industry experts

                REPORT WRITING

                Qualitative

                • Market drivers
                • Market challenges
                • Market trends
                • Five forces analysis

                Quantitative

                • Market size and forecast
                • Market segmentation
                • Geographical insights
                • Competitive landscape

                Interested in this report?

                Get your sample now to see our research methodology and insights!

                Download Now

                Frequently Asked Questions

                Ready-To-Eat (Rte) Popcorn market growth will increase by $ 3923.7 mn during 2025-2029 .

                The Ready-To-Eat (Rte) Popcorn market is expected to grow at a CAGR of 8.5% during 2025-2029 .

                Ready-To-Eat (Rte) Popcorn market is segmented by Application( Household, Commercial, Others) Product( Savory, Sweet, Others, South America, Middle East and Africa) Distribution Channel( Supermarkets and hypermarkets, Convenience stores, Online retail, Specialty food stores, Others)

                American Garden, American Pop Corn Co., Campbell Soup Co., Conagra Brands Inc., Cretors, Garrett Popcorn Holding Company LLC, Gary Poppins LLC, General Mills Inc., Intersnack Group GmbH and Co. KG, Newmans Own Inc., Oogies Snacks LLC, PepsiCo Inc., PnC popcorn, PROPER Snacks, Quinn Foods LLC, Shallowford Farms Inc., Simply 7 Snacks LLC, The Hershey Co., The J.M. Smucker Co., Weaver Popcorn Manufacturing Inc. are a few of the key vendors in the Ready-To-Eat (Rte) Popcorn market.

                North America will register the highest growth rate of 36% among the other regions. Therefore, the Ready-To-Eat (Rte) Popcorn market in North America is expected to garner significant business opportunities for the vendors during the forecast period.

                US, Canada, China, UK, Germany, France, India, Japan, The Netherlands, Italy

                • Expansion of retail storesThe growing presence of supermarkets is the driving factor this market.
                • hypermarkets is the driving factor this market.
                • and specialty stores is indicative of the proliferation of the organized retail sector worldwide. Snacks is the driving factor this market.
                • including ready-to-eat popcorn is the driving factor this market.
                • are primarily sold by large is the driving factor this market.
                • organized retailers such as Walmart and Tesco. Companies operating in this market compete for limited shelf space in large retail stores. Supermarkets constitute a major distribution channel for nutritious and affordable food products.Convenience and value for money are critical parameters for consumers is the driving factor this market.
                • given their hectic lifestyles. Organized retailers meet these parameters by stocking a wide variety of products under a single roof. Thus is the driving factor this market.
                • consumer preference has shifted toward supermarkets and hypermarkets and increased the importance of organized retailers among companies. Such factors are expected to drive the growth of the global ready-to-eat (RTE) popcorn market during the forecast period. is the driving factor this market.

                The Ready-To-Eat (Rte) Popcorn market vendors should focus on grabbing business opportunities from the Household segment as it accounted for the largest market share in the base year.